Garfield: Fire Incidents, New Jersey (NJ)
Where are fire incidents reported in Garfield, NJ
Something went wrong! Please refresh the page.
| Fire incidents reported | |
|---|---|
| Sreet name | Count |
| MIDLAND AVE | 312 |
| PLAUDERVILLE AVE | 178 |
| RIVER DR | 176 |
| PASSAIC ST | 172 |
| OUTWATER LANE | 170 |
| COMMERCE ST | 132 |
| LANZA AVE | 126 |
| MAC ARTHUR AVE | 110 |
| PALISADE AVE | 110 |
| HARRISON AVE | 104 |
| BELMONT AVE | 72 |
| JEWELL ST | 58 |
| GRAND ST | 50 |
| MALCOLM AVE | 46 |
| SEMEL AVE | 44 |
| MAIN ST | 40 |
| BANTA AVE | 38 |
| CEDAR ST | 38 |
| ELIZABETH ST | 38 |
| ORCHARD ST | 38 |
| CAMBRIDGE AVE | 36 |
| MAITLAND PL | 32 |
| VAN WINKLE AVE | 30 |
| DIVISION AVE | 28 |
| SOMERSET ST | 28 |
| PROSPECT ST | 26 |
| WESSINGTON AVE | 26 |
| LINCOLN PL | 24 |
| MAC DONALD ST | 24 |
| CHESTNUT ST | 22 |
2002 - 2016 National Fire Incident Reporting System (NFIRS) incidents
- Incident types reported to NFIRS in Garfield, NJ
- 1,59537.6%Fire
- 1,58737.4%Hazardous Condition
- 44010.4%False Alarm
- 3809.0%Service Call
- 1553.7%Good Intent Call
- 451.1%Rescue & EMS
- 310.7%Special Incident
- 80.2%Severe Weather
- Fire incident types reported to NFIRS in Garfield, NJ
- 1,07867.6%Structure Fires
- 36422.8%Outside Fires
- 1408.8%Mobile Property/Vehicle Fires
- 130.8%Other
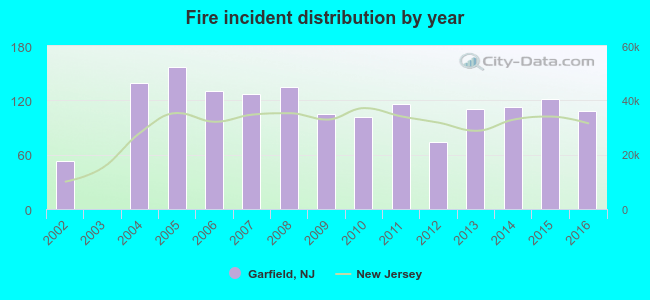 Based on the data from the years 2002 - 2016 the average number of fires per year is 106. The highest number of reported fires - 157 took place in 2005, and the least - 0 in 2003. The data has an increasing trend.
The average number of yearly fire incidents per 10k residents in Garfield, NJ compared to nearest cities:
(Note: Based on data for the last 3 years, including only cities with population 5,000 and above)
| Garfield: | 12.0 |
| Lodi: | 24.5 |
| Saddle Brook: | 26.1 |
| Wallington: | 24.1 |
| Elmwood Park: | 21.6 |
| Passaic: | 35.8 |
| Hasbrouck Heights: | 18.9 |
| Rochelle Park: | 26.5 |
| Clifton: | 22.3 |
 The median response time based on all reported fire incidents is 3 minutes. This is lower compared to the New Jersey median value.
The median response time in Garfield, NJ compared to nearest cities:
(Note: Based on data for all years, including only cities with at least 500 fire incidents)
| Garfield: | 3 minutes |
| Lodi: | 4 minutes |
| Elmwood Park: | 5 minutes |
| Passaic: | 4 minutes |
| Clifton: | 5 minutes |
| Hackensack: | 3 minutes |
| East Rutherford: | 2 minutes |
| Rutherford: | 5 minutes |
| Fair Lawn: | 5 minutes |
 According to the data from the years 2002 - 2016 the average number of fire-related fatalities per year is 0. The highest number of deaths - 1 took place in 2006, and the lowest - 0 in 2002. The data has a constant trend.
 According to the data from the years 2002 - 2016 the average number of fire-related yearly casualties is 3. The highest number of injuries - 11 took place in 2004, and the lowest - 0 in 2003. The data has a declining trend.
The average number of casualties per 1,000 fires is 27. This indicator was the highest - 79 in 2004, and the lowest 0 in 2003. The trend for injuries per 1,000 fires is decreasing. Compared to the New Jersey value the number of injuries per 1,000 incidents is much higher.
According to the data from the years 2002 - 2016 the average number of fire-related yearly casualties is 3. The highest number of injuries - 11 took place in 2004, and the lowest - 0 in 2003. The data has a declining trend.
The average number of casualties per 1,000 fires is 27. This indicator was the highest - 79 in 2004, and the lowest 0 in 2003. The trend for injuries per 1,000 fires is decreasing. Compared to the New Jersey value the number of injuries per 1,000 incidents is much higher.Casualties per 1,000 incidents in Garfield, NJ compared to nearest cities:
(Note: Based on data for all years, including only cities with at least 500 fire incidents)
| Garfield: | 28.2 |
| Lodi: | 6.3 |
| Elmwood Park: | 8.4 |
| Passaic: | 3.3 |
| Clifton: | 13.0 |
| Hackensack: | 13.1 |
| East Rutherford: | 6.9 |
| Rutherford: | 6.0 |
| Fair Lawn: | 6.7 |
 30.8% incidents where reported in the morning and 69.2% in the evening. The most fires (15.5%) took place on Saturday, and the least (13.3%) on Monday.
 According to the 1,595 incident reports from years 2002 - 2016 most fires (11.0%) took place during April, and the least (7.0%) in July.
 Out of all 4,244 cases reported during the years 2002 - 2016, the most belonged to the categories: Fire (37.6%), Hazardous Condition (37.4%), and False Alarm (10.4%).
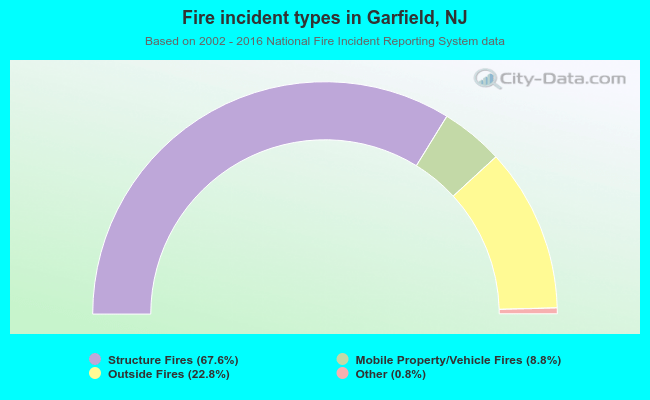 When looking into fire subcategories, the most incidents belonged to: Structure Fires (67.6%), and Outside Fires (22.8%).