Rutherford: Fire Incidents, New Jersey (NJ)
Where are fire incidents reported in Rutherford, NJ
Something went wrong! Please refresh the page.
| Fire incidents reported | |
|---|---|
| Sreet name | Count |
| PARK AVE | 196 |
| UNION AVE | 114 |
| ORIENT WAY | 90 |
| ROUTE 17 HWY | 56 |
| HASTINGS AVE | 52 |
| PASSAIC AVE | 46 |
| ROUTE 3 HWY | 46 |
| CHESTNUT ST | 44 |
| EDWIN L. WARD MEMORIAL HWY | 44 |
| MONTROSS AVE | 42 |
| STATION SQ | 40 |
| FERONIA WAY | 36 |
| EDWIN L WARD MEMORIAL HWY | 34 |
| MEADOW RD | 32 |
| MILTON CT | 32 |
| AMES AVE | 30 |
| WOODLAND AVE | 30 |
| LINCOLN AVE | 28 |
| DONALDSON AVE | 26 |
| JACKSON AVE | 26 |
| RUTHERFORD AVE | 26 |
| WASHINGTON AVE | 26 |
| CARMITA AVE | 24 |
| KIP AVE | 24 |
| RIDGE RD | 24 |
| CARNEER AVE | 22 |
| GLEN RD | 22 |
| MORTIMER AVE | 18 |
| PIERREPONT AVE | 18 |
| SYLVAN ST | 18 |
2004 - 2018 National Fire Incident Reporting System (NFIRS) incidents
- Incident types reported to NFIRS in Rutherford, NJ
- 1,02329.2%False Alarm
- 1,00028.5%Fire
- 98128.0%Hazardous Condition
- 2436.9%Good Intent Call
- 1674.8%Service Call
- 742.1%Rescue & EMS
- 110.3%Severe Weather
- 40.1%Overpressure Rupture
- Fire incident types reported to NFIRS in Rutherford, NJ
- 69469.4%Structure Fires
- 18018.0%Outside Fires
- 11811.8%Mobile Property/Vehicle Fires
- 80.8%Other
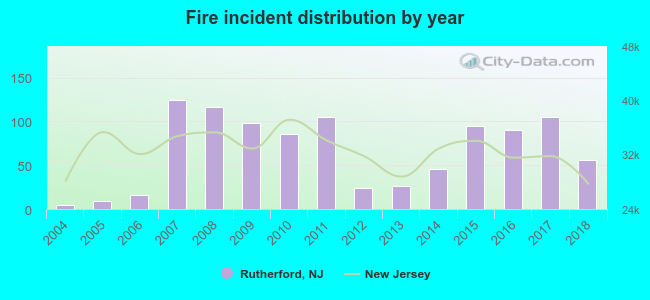 Based on the data from the years 2004 - 2018 the average number of fires per year is 67. The highest number of fire incidents - 124 took place in 2007, and the least - 4 in 2004. The data has a growing trend.
The average number of yearly fire incidents per 10k residents in Rutherford, NJ compared to nearest cities:
(Note: Based on data for the last 3 years, including only cities with population 5,000 and above)
| Rutherford: | 45.3 |
| East Rutherford: | 192.9 |
| Lyndhurst: | 39.0 |
| Carlstadt: | 56.0 |
| Wallington: | 24.1 |
| Passaic: | 35.8 |
| Nutley: | 44.0 |
| North Arlington: | 24.8 |
| Hasbrouck Heights: | 18.9 |
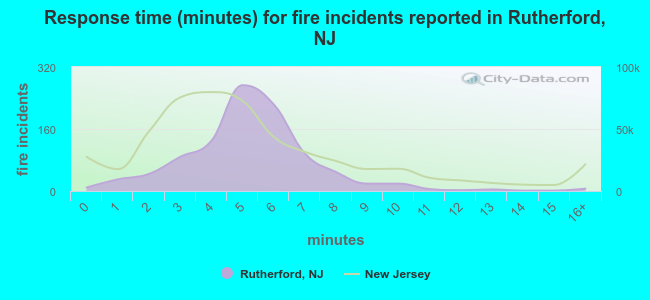 The median response time based on all reported fire incidents is 5 minutes. This is comparable to the state median value.
The median response time in Rutherford, NJ compared to nearest cities:
(Note: Based on data for all years, including only cities with at least 500 fire incidents)
| Rutherford: | 5 minutes |
| East Rutherford: | 2 minutes |
| Lyndhurst: | 3 minutes |
| Passaic: | 4 minutes |
| Nutley: | 2 minutes |
| Garfield: | 3 minutes |
| Clifton: | 5 minutes |
| Belleville: | 3 minutes |
| Lodi: | 4 minutes |
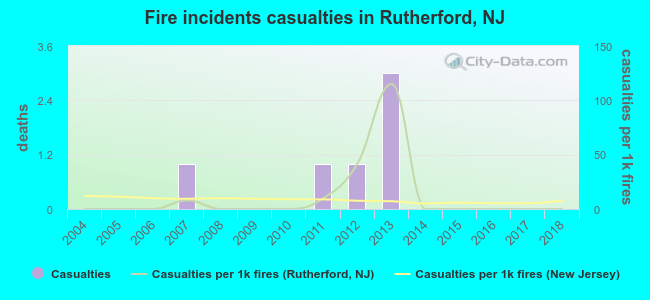 According to the reports from the years 2004 - 2018 the average number of fire-related yearly casualties is 0. The highest number of casualties - 3 took place in 2013, and the lowest - 0 in 2004. The data has a constant trend.
The average number of injuries per 1,000 fire incidents is 12. This indicator was the highest - 115 in 2013, and the lowest 0 in 2004. The trend for injuries per 1,000 incidents is constant. Compared to the New Jersey value the number of casualties per 1,000 fire incidents is lower.
According to the reports from the years 2004 - 2018 the average number of fire-related yearly casualties is 0. The highest number of casualties - 3 took place in 2013, and the lowest - 0 in 2004. The data has a constant trend.
The average number of injuries per 1,000 fire incidents is 12. This indicator was the highest - 115 in 2013, and the lowest 0 in 2004. The trend for injuries per 1,000 incidents is constant. Compared to the New Jersey value the number of casualties per 1,000 fire incidents is lower.Casualties per 1,000 incidents in Rutherford, NJ compared to nearest cities:
(Note: Based on data for all years, including only cities with at least 500 fire incidents)
| Rutherford: | 6.0 |
| East Rutherford: | 6.9 |
| Lyndhurst: | 6.0 |
| Passaic: | 3.3 |
| Nutley: | 10.7 |
| Garfield: | 28.2 |
| Clifton: | 13.0 |
| Belleville: | 10.2 |
| Lodi: | 6.3 |
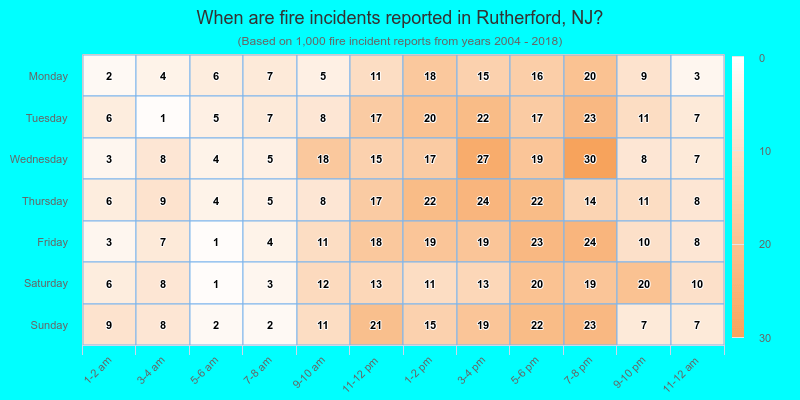
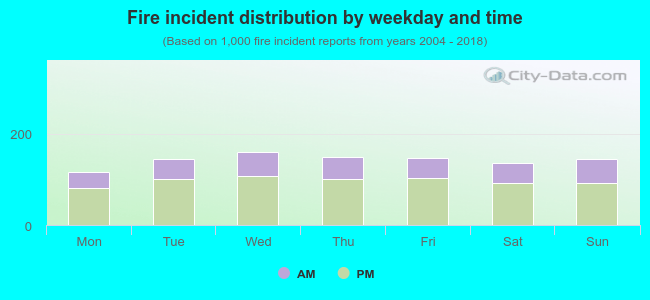 32.1% incidents where reported in the morning and 67.9% in the evening. The most fires (16.1%) took place on Wednesday, and the least (11.6%) on Monday.
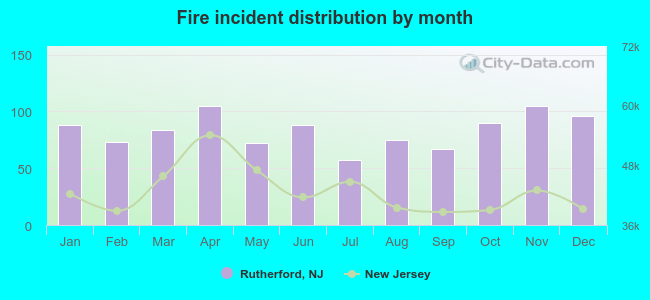 According to the 1,000 fire incidents from years 2004 - 2018 most fires (10.5%) took place during April, and the least (5.7%) in July.
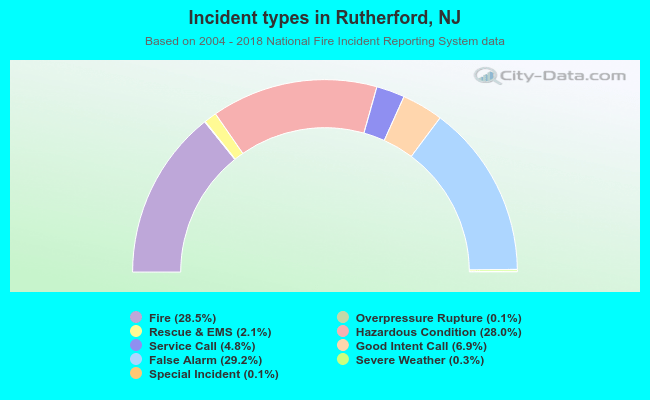 Out of all 3,506 cases reported during the years 2004 - 2018, the most belonged to the categories: False Alarm (29.2%), Fire (28.5%), and Hazardous Condition (28.0%).
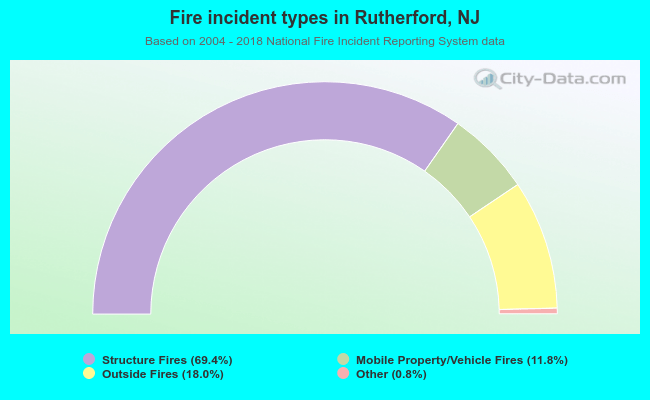 When looking into fire subcategories, the most reports belonged to: Structure Fires (69.4%), and Outside Fires (18.0%).