Passaic: Fire Incidents, New Jersey (NJ)
Where are fire incidents reported in Passaic, NJ
Something went wrong! Please refresh the page.
| Fire incidents reported | |
|---|---|
| Sreet name | Count |
| MAIN AVE | 302 |
| ASPEN PL | 272 |
| GREGORY AVE | 226 |
| PASSAIC ST | 198 |
| BROADWAY | 184 |
| MONROE ST | 174 |
| PAULISON AVE | 150 |
| FOURTH ST | 144 |
| RIVER DR | 144 |
| MARKET ST | 132 |
| THIRD ST | 114 |
| BOULEVARD | 110 |
| LEXINGTON AVE | 104 |
| AYCRIGG AVE | 102 |
| PASSAIC AVE | 102 |
| EIGHTH ST | 86 |
| HOWE AVE | 80 |
| GROVE ST | 78 |
| PENNINGTON AVE | 78 |
| CENTRAL AVE | 74 |
| MYRTLE AVE | 74 |
| LAFAYETTE AVE | 70 |
| STATE ST | 70 |
| DAYTON AVE | 68 |
| HOPE AVE | 68 |
| ASCENSION ST | 66 |
| MADISON ST | 66 |
| SIXTH ST | 66 |
| BROOK AVE | 60 |
| HARRISON ST | 58 |
2003 - 2018 National Fire Incident Reporting System (NFIRS) incidents
- Incident types reported to NFIRS in Passaic, NJ
- 5,76922.6%Hazardous Condition
- 5,17720.3%False Alarm
- 5,14320.2%Service Call
- 4,74018.6%Rescue & EMS
- 3,00911.8%Fire
- 1,5766.2%Good Intent Call
- 590.2%Overpressure Rupture
- 290.1%Special Incident
- Fire incident types reported to NFIRS in Passaic, NJ
- 2,10670.0%Structure Fires
- 34211.4%Outside Fires
- 2889.6%Other
- 2739.1%Mobile Property/Vehicle Fires
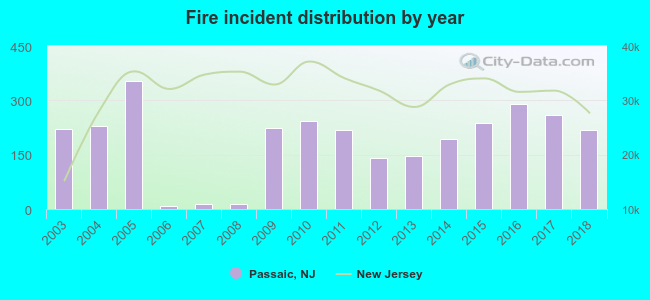 According to the data from the years 2003 - 2018 the average number of fire incidents per year is 188. The highest number of reported fire incidents - 354 took place in 2005, and the least - 8 in 2006. The data has a declining trend.
The average number of yearly fire incidents per 10k residents in Passaic, NJ compared to nearest cities:
(Note: Based on data for the last 3 years, including only cities with population 5,000 and above)
| Passaic: | 35.8 |
| Wallington: | 24.1 |
| Clifton: | 22.3 |
| Garfield: | 12.0 |
| Rutherford: | 45.3 |
| East Rutherford: | 192.9 |
| Lodi: | 24.5 |
| Hasbrouck Heights: | 18.9 |
| Carlstadt: | 56.0 |
 The median response time based on all reported fire incidents is 4 minutes. This is lower compared to the state median value.
The median response time in Passaic, NJ compared to nearest cities:
(Note: Based on data for all years, including only cities with at least 500 fire incidents)
| Passaic: | 4 minutes |
| Clifton: | 5 minutes |
| Garfield: | 3 minutes |
| Rutherford: | 5 minutes |
| East Rutherford: | 2 minutes |
| Lodi: | 4 minutes |
| Nutley: | 2 minutes |
| Elmwood Park: | 5 minutes |
| Lyndhurst: | 3 minutes |
 Based on the reports from the years 2003 - 2018 the average number of fire-related casualties per year is 1. The highest number of reported injuries - 3 took place in 2009, and the lowest - 0 in 2004. The data has a decreasing trend.
The average number of casualties per 1,000 fires is 3. This indicator was the highest - 13 in 2009, and the lowest 0 in 2004. The trend for casualties per 1,000 incidents is decreasing. Compared to the state value the number of injuries per 1,000 incidents is much lower.
Based on the reports from the years 2003 - 2018 the average number of fire-related casualties per year is 1. The highest number of reported injuries - 3 took place in 2009, and the lowest - 0 in 2004. The data has a decreasing trend.
The average number of casualties per 1,000 fires is 3. This indicator was the highest - 13 in 2009, and the lowest 0 in 2004. The trend for casualties per 1,000 incidents is decreasing. Compared to the state value the number of injuries per 1,000 incidents is much lower.Casualties per 1,000 incidents in Passaic, NJ compared to nearest cities:
(Note: Based on data for all years, including only cities with at least 500 fire incidents)
| Passaic: | 3.3 |
| Clifton: | 13.0 |
| Garfield: | 28.2 |
| Rutherford: | 6.0 |
| East Rutherford: | 6.9 |
| Lodi: | 6.3 |
| Nutley: | 10.7 |
| Elmwood Park: | 8.4 |
| Lyndhurst: | 6.0 |
 31.9% incidents where reported in the morning and 68.1% in the evening. The most fires (15.8%) took place on Saturday, and the least (12.4%) on Tuesday.
 Based on the 3,009 fires from years 2003 - 2018 most fires (10.0%) took place during April, and the least (6.9%) in July.
 Out of all 25,506 cases reported during the years 2003 - 2018, the most belonged to the categories: Hazardous Condition (22.6%), False Alarm (20.3%), and Service Call (20.2%).
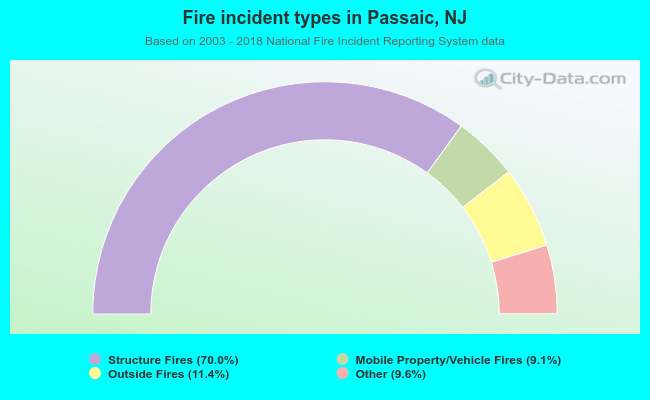 When looking into fire subcategories, the most reports belonged to: Structure Fires (70.0%), and Outside Fires (11.4%).