Paterson: Fire Incidents, New Jersey (NJ)
Where are fire incidents reported in Paterson, NJ
Something went wrong! Please refresh the page.
| Fire incidents reported | |
|---|---|
| Sreet name | Count |
| BROADWAY | 616 |
| MAIN ST | 592 |
| MARKET ST | 398 |
| PARK AVE | 326 |
| STRAIGHT ST | 312 |
| 21ST AVE | 260 |
| MADISON AVE | 250 |
| PRESIDENTIAL BLVD | 250 |
| WARD ST | 238 |
| 12TH AVE | 236 |
| ROSA PARKS BLVD | 224 |
| 19TH ST | 208 |
| 20TH AVE | 208 |
| RIVER ST | 200 |
| CARROLL ST | 194 |
| 23RD ST | 188 |
| ELLISON ST | 178 |
| MILL ST | 178 |
| UNION AVE | 160 |
| 18TH ST | 152 |
| 24TH ST | 148 |
| MUTUIAL AID- PATERSON | 142 |
| HAMILTON AVE | 138 |
| 27TH ST | 136 |
| SUMMER ST | 134 |
| 32ND ST | 128 |
| AUBURN ST | 128 |
| 22ND ST | 124 |
| VAN HOUTEN ST | 124 |
| TOTOWA AVE | 118 |
| Other | 927 |
2005 - 2018 National Fire Incident Reporting System (NFIRS) incidents
- Incident types reported to NFIRS in Paterson, NJ
- 7,61525.2%Fire
- 7,48124.7%False Alarm
- 5,72518.9%Hazardous Condition
- 3,70712.3%Service Call
- 3,29410.9%Rescue & EMS
- 2,2547.4%Good Intent Call
- 1100.4%Overpressure Rupture
- 650.2%Special Incident
- Fire incident types reported to NFIRS in Paterson, NJ
- 5,79076.0%Structure Fires
- 91812.1%Outside Fires
- 80710.6%Mobile Property/Vehicle Fires
- 1001.3%Other
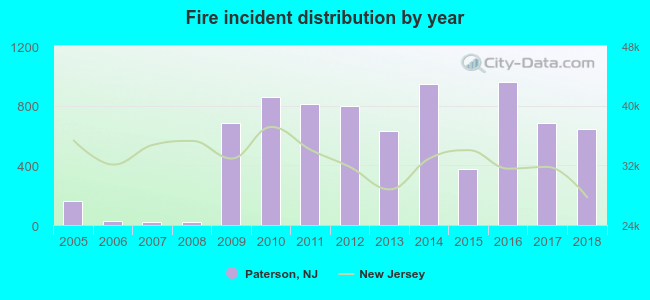 According to the data from the years 2005 - 2018 the average number of fires per year is 544. The highest number of fires - 961 took place in 2016, and the least - 18 in 2008. The data has a growing trend.
The average number of yearly fire incidents per 10k residents in Paterson, NJ compared to nearest cities:
(Note: Based on data for the last 3 years, including only cities with population 5,000 and above)
| Paterson: | 52.0 |
| Prospect Park: | 16.3 |
| Haledon: | 23.2 |
| Elmwood Park: | 21.6 |
| West Paterson: | 0.9 |
| Fair Lawn: | 22.2 |
| Hawthorne: | 15.5 |
| Totowa: | 76.8 |
| Clifton: | 22.3 |
 The median response time based on all reported fire incidents is 4 minutes. This is lower compared to the state median value.
The median response time in Paterson, NJ compared to nearest cities:
(Note: Based on data for all years, including only cities with at least 500 fire incidents)
| Paterson: | 4 minutes |
| Elmwood Park: | 5 minutes |
| Fair Lawn: | 5 minutes |
| Hawthorne: | 5 minutes |
| Totowa: | 3 minutes |
| Clifton: | 5 minutes |
| Garfield: | 3 minutes |
| Little Falls: | 4 minutes |
| Passaic: | 4 minutes |
 According to the reports from the years 2005 - 2018 the average number of fire-related yearly deaths is 1. The highest number of reported deaths - 4 took place in 2010, and the lowest - 0 in 2005. The data has a constant trend.
The average number of deaths per 1,000 fires is 2. This indicator was the highest - 5 in 2010, and the lowest 0 in 2005. The trend for fatalities per 1,000 fires is constant. Compared to the New Jersey value the number of deaths per 1,000 fire incidents is higher.
According to the reports from the years 2005 - 2018 the average number of fire-related yearly deaths is 1. The highest number of reported deaths - 4 took place in 2010, and the lowest - 0 in 2005. The data has a constant trend.
The average number of deaths per 1,000 fires is 2. This indicator was the highest - 5 in 2010, and the lowest 0 in 2005. The trend for fatalities per 1,000 fires is constant. Compared to the New Jersey value the number of deaths per 1,000 fire incidents is higher.
 Based on the reports from the years 2005 - 2018 the average number of fire-related casualties per year is 6. The highest number of casualties - 16 took place in 2013, and the lowest - 0 in 2006. The data has a decreasing trend.
The average number of casualties per 1,000 fires is 11. This indicator was the highest - 50 in 2005, and the lowest 0 in 2006. The trend for casualties per 1,000 fire incidents is decreasing. Compared to the state value the number of casualties per 1,000 fires is higher.
Based on the reports from the years 2005 - 2018 the average number of fire-related casualties per year is 6. The highest number of casualties - 16 took place in 2013, and the lowest - 0 in 2006. The data has a decreasing trend.
The average number of casualties per 1,000 fires is 11. This indicator was the highest - 50 in 2005, and the lowest 0 in 2006. The trend for casualties per 1,000 fire incidents is decreasing. Compared to the state value the number of casualties per 1,000 fires is higher.Casualties per 1,000 incidents in Paterson, NJ compared to nearest cities:
(Note: Based on data for all years, including only cities with at least 500 fire incidents)
| Paterson: | 11.2 |
| Elmwood Park: | 8.4 |
| Fair Lawn: | 6.7 |
| Hawthorne: | 5.1 |
| Totowa: | 6.0 |
| Clifton: | 13.0 |
| Garfield: | 28.2 |
| Little Falls: | 2.0 |
| Passaic: | 3.3 |
 35.1% incidents where reported in the morning and 64.9% in the evening. The most fires (15.9%) took place on Sunday, and the least (13.2%) on Thursday.
 According to the 7,615 fire incident reports from years 2005 - 2018 most fires (10.7%) took place during April, and the least (6.1%) in July.
 Out of all 30,256 cases reported during the years 2005 - 2018, the most belonged to the categories: Fire (25.2%), False Alarm (24.7%), and Hazardous Condition (18.9%).
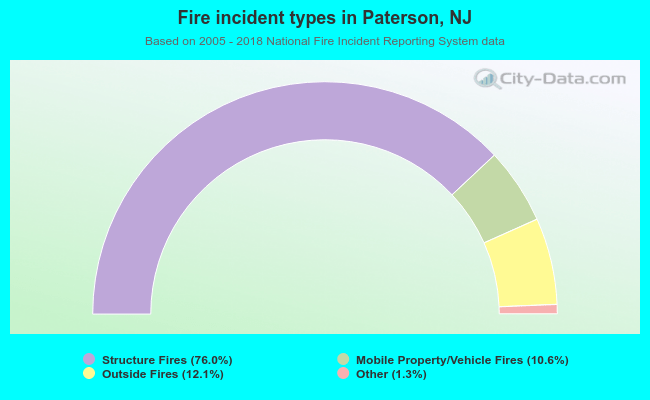 When looking into fire subcategories, the most incidents belonged to: Structure Fires (76.0%), and Outside Fires (12.1%).