Totowa: Fire Incidents, New Jersey (NJ)
Where are fire incidents reported in Totowa, NJ
Something went wrong! Please refresh the page.
| Fire incidents reported | |
|---|---|
| Sreet name | Count |
| UNION BLVD | 206 |
| RIVERVIEW DR | 200 |
| RT 46 HWY | 190 |
| TOTOWA RD | 132 |
| MINNISINK RD | 102 |
| MALTESE DR | 64 |
| LINCOLN AVE | 42 |
| RT 80 HWY | 42 |
| BOYLE AVE | 40 |
| MUTUIAL AID- TOTOWA | 38 |
| COMMERCE WAY | 32 |
| FURLER ST | 30 |
| BOGERT ST | 22 |
| DEWEY AVE | 22 |
| VREELAND AVE | 22 |
| HILLSIDE DR | 20 |
| HOBART PL | 20 |
| JEFFERSON PL | 20 |
| WASHINGTON PL | 20 |
| YOUNG AVE | 20 |
| GRANT AVE | 18 |
| HAMILTON TRL | 18 |
| HUDSON AVE | 18 |
| WILLARD AVE | 18 |
| WINIFRED DR | 18 |
| BARNERT AVE | 16 |
| GREENE AVE | 16 |
| SUTTON AVE | 16 |
| GARFIELD PL | 14 |
| COLUMBUS AVE | 12 |
2004 - 2018 National Fire Incident Reporting System (NFIRS) incidents
- Incident types reported to NFIRS in Totowa, NJ
- 99741.3%Fire
- 60925.2%Hazardous Condition
- 52021.5%False Alarm
- 1144.7%Service Call
- 883.6%Good Intent Call
- 441.8%Rescue & EMS
- 220.9%Special Incident
- 160.7%Overpressure Rupture
- 60.2%Severe Weather
- Fire incident types reported to NFIRS in Totowa, NJ
- 58358.5%Structure Fires
- 22322.4%Outside Fires
- 18718.8%Mobile Property/Vehicle Fires
- 40.4%Other
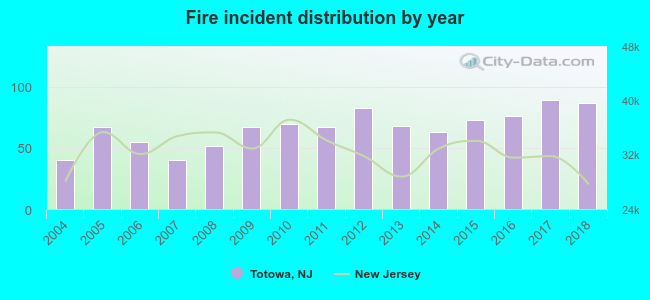 Based on the data from the years 2004 - 2018 the average number of fire incidents per year is 66. The highest number of fire incidents - 89 took place in 2017, and the least - 40 in 2004. The data has an increasing trend.
The average number of yearly fire incidents per 10k residents in Totowa, NJ compared to nearest cities:
(Note: Based on data for the last 3 years, including only cities with population 5,000 and above)
| Totowa: | 76.8 |
| West Paterson: | 0.9 |
| Little Falls: | 65.6 |
| Haledon: | 23.2 |
| Paterson: | 52.0 |
| Wayne: | 12.5 |
| Prospect Park: | 16.3 |
| Cedar Grove: | 13.1 |
| North Caldwell: | 9.3 |
 The median response time based on all reported fire incidents is 3 minutes. This is lower compared to the state median value.
The median response time in Totowa, NJ compared to nearest cities:
(Note: Based on data for all years, including only cities with at least 500 fire incidents)
| Totowa: | 3 minutes |
| Little Falls: | 4 minutes |
| Paterson: | 4 minutes |
| Wayne: | 5 minutes |
| Clifton: | 5 minutes |
| Fairfield: | 5 minutes |
| Hawthorne: | 5 minutes |
| Elmwood Park: | 5 minutes |
| West Caldwell: | 3 minutes |
 According to the data from the years 2004 - 2018 the average number of fire-related yearly casualties is 0. The highest number of reported injuries - 2 took place in 2006, and the lowest - 0 in 2004. The data has a growing trend.
The average number of injuries per 1,000 fires is 6. This indicator was the highest - 36 in 2006, and the lowest 0 in 2004. The trend for injuries per 1,000 fires is increasing. Compared to the state value the number of injuries per 1,000 fires is lower.
According to the data from the years 2004 - 2018 the average number of fire-related yearly casualties is 0. The highest number of reported injuries - 2 took place in 2006, and the lowest - 0 in 2004. The data has a growing trend.
The average number of injuries per 1,000 fires is 6. This indicator was the highest - 36 in 2006, and the lowest 0 in 2004. The trend for injuries per 1,000 fires is increasing. Compared to the state value the number of injuries per 1,000 fires is lower.Casualties per 1,000 incidents in Totowa, NJ compared to nearest cities:
(Note: Based on data for all years, including only cities with at least 500 fire incidents)
| Totowa: | 6.0 |
| Little Falls: | 2.0 |
| Paterson: | 11.2 |
| Wayne: | 5.9 |
| Clifton: | 13.0 |
| Fairfield: | 0.0 |
| Hawthorne: | 5.1 |
| Elmwood Park: | 8.4 |
| West Caldwell: | 7.6 |
 34.3% incidents where reported in the morning and 65.7% in the evening. The most fires (16.4%) took place on Friday, and the least (13.3%) on Wednesday.
 Based on the 997 fires from years 2004 - 2018 most fires (11.2%) took place during April, and the least (5.7%) in January.
 Out of all 2,416 cases reported during the years 2004 - 2018, the most belonged to the categories: Fire (41.3%), Hazardous Condition (25.2%), and False Alarm (21.5%).
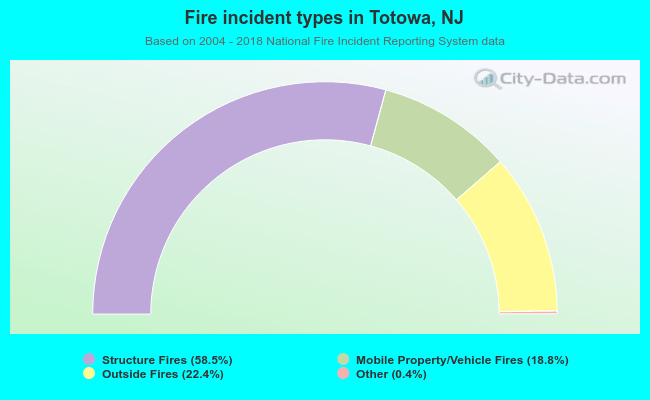 When looking into fire subcategories, the most reports belonged to: Structure Fires (58.5%), and Outside Fires (22.4%).