Wayne: Fire Incidents, New Jersey (NJ)
Where are fire incidents reported in Wayne, NJ
Something went wrong! Please refresh the page.
| Fire incidents reported | |
|---|---|
| Sreet name | Count |
| HAMBURG TPKE | 334 |
| ROUTE 23 | 162 |
| VALLEY RD | 146 |
| PARKSIDE CT | 98 |
| RT 23 HWY | 96 |
| RATZER RD | 86 |
| ALPS RD | 80 |
| BERDAN AVE | 64 |
| WILLOWBROOK BLVD | 64 |
| BLACK OAK RIDGE RD | 58 |
| WILLOWBROOK MALL | 58 |
| NEVINS RD | 56 |
| OLDHAM RD | 48 |
| WILLOWBROOK LT | 46 |
| POMPTON RD | 42 |
| BRITTANY DR | 38 |
| HAZEN CT | 36 |
| RUNNYMEDE DR | 32 |
| SIENA VILLAGE | 32 |
| NEWARK POMPTON TPKE | 30 |
| PINES LAKE DR | 28 |
| ROUTE 46 | 28 |
| PARISH DR | 26 |
| WAYNE TOWNE CN | 26 |
| MUTUIAL AID- WAYNE | 24 |
| TERHUNE DR | 24 |
| ANDOVER DR | 22 |
| ATHERTON CT | 22 |
| CHICOPEE DR | 22 |
| LENOX RD | 22 |
| Other | 168 |
2004 - 2018 National Fire Incident Reporting System (NFIRS) incidents
- Incident types reported to NFIRS in Wayne, NJ
- 3,09540.7%Hazardous Condition
- 2,01826.6%Fire
- 1,65221.7%False Alarm
- 4185.5%Good Intent Call
- 2733.6%Service Call
- 1101.4%Rescue & EMS
- 190.3%Special Incident
- 110.1%Overpressure Rupture
- Fire incident types reported to NFIRS in Wayne, NJ
- 1,12455.7%Structure Fires
- 57328.4%Outside Fires
- 28714.2%Mobile Property/Vehicle Fires
- 341.7%Other
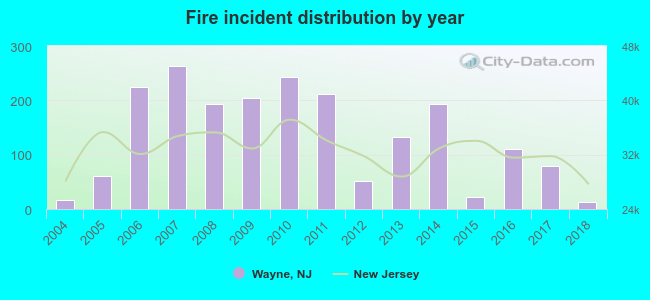 According to the data from the years 2004 - 2018 the average number of fires per year is 135. The highest number of reported fire incidents - 263 took place in 2007, and the least - 12 in 2018. The data has a dropping trend.
The average number of yearly fire incidents per 10k residents in Wayne, NJ compared to nearest cities:
(Note: Based on data for the last 3 years, including only cities with population 5,000 and above)
| Wayne: | 12.5 |
| Lincoln Park: | 7.6 |
| Totowa: | 76.8 |
| Haledon: | 23.2 |
| North Haledon: | 30.5 |
| Prospect Park: | 16.3 |
| West Paterson: | 0.9 |
| Pompton Lakes: | 14.9 |
| Little Falls: | 65.6 |
 The median response time based on all reported fire incidents is 5 minutes. This is comparable to the state median value.
The median response time in Wayne, NJ compared to nearest cities:
(Note: Based on data for all years, including only cities with at least 500 fire incidents)
| Wayne: | 5 minutes |
| Totowa: | 3 minutes |
| Little Falls: | 4 minutes |
| Fairfield: | 5 minutes |
| Paterson: | 4 minutes |
| Hawthorne: | 5 minutes |
| Wyckoff: | 5 minutes |
| Oakland: | 5 minutes |
| West Caldwell: | 3 minutes |
 According to the data from the years 2004 - 2018 the average number of fire-related yearly deaths is 0. The highest number of reported deaths - 1 took place in 2007, and the lowest - 0 in 2004. The data has a constant trend.
 According to the data from the years 2004 - 2018 the average number of fire-related yearly casualties is 1. The highest number of reported casualties - 6 took place in 2007, and the lowest - 0 in 2004. The data has a constant trend.
The average number of injuries per 1,000 fire incidents is 4. This indicator was the highest - 23 in 2007, and the lowest 0 in 2004. The trend for casualties per 1,000 fire incidents is constant. Compared to the state value the number of casualties per 1,000 fire incidents is lower.
According to the data from the years 2004 - 2018 the average number of fire-related yearly casualties is 1. The highest number of reported casualties - 6 took place in 2007, and the lowest - 0 in 2004. The data has a constant trend.
The average number of injuries per 1,000 fire incidents is 4. This indicator was the highest - 23 in 2007, and the lowest 0 in 2004. The trend for casualties per 1,000 fire incidents is constant. Compared to the state value the number of casualties per 1,000 fire incidents is lower.Casualties per 1,000 incidents in Wayne, NJ compared to nearest cities:
(Note: Based on data for all years, including only cities with at least 500 fire incidents)
| Wayne: | 5.9 |
| Totowa: | 6.0 |
| Little Falls: | 2.0 |
| Fairfield: | 0.0 |
| Paterson: | 11.2 |
| Hawthorne: | 5.1 |
| Wyckoff: | 1.4 |
| Oakland: | 12.8 |
| West Caldwell: | 7.6 |
 25.8% incidents where reported in the morning and 74.2% in the evening. The most fires (15.3%) took place on Monday, and the least (12.2%) on Wednesday.
 Based on the 2,018 reports from years 2004 - 2018 most fires (11.4%) took place during April, and the least (7.2%) in January.
 Out of all 7,600 cases reported during the years 2004 - 2018, the most belonged to the categories: Hazardous Condition (40.7%), Fire (26.6%), and False Alarm (21.7%).
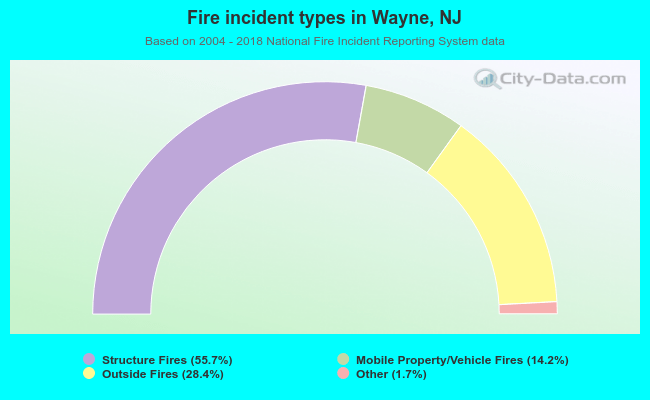 When looking into fire subcategories, the most reports belonged to: Structure Fires (55.7%), and Outside Fires (28.4%).