Lincoln Park: Fire Incidents, New Jersey (NJ)
Where are fire incidents reported in Lincoln Park, NJ
Something went wrong! Please refresh the page.
|
| |||||||||||||||||||||||||||||||||||||||||||||||||||||||||||||||||||||||||||||||||||||||||||||||||||||||||||||
2002 - 2018 National Fire Incident Reporting System (NFIRS) incidents
- Incident types reported to NFIRS in Lincoln Park, NJ
- 40035.5%Hazardous Condition
- 33629.8%False Alarm
- 28625.4%Fire
- 534.7%Service Call
- 222.0%Rescue & EMS
- 181.6%Good Intent Call
- 60.5%Special Incident
- 40.4%Severe Weather
- 30.3%Overpressure Rupture
- Fire incident types reported to NFIRS in Lincoln Park, NJ
- 17460.8%Structure Fires
- 6823.8%Outside Fires
- 3110.8%Mobile Property/Vehicle Fires
- 134.5%Other
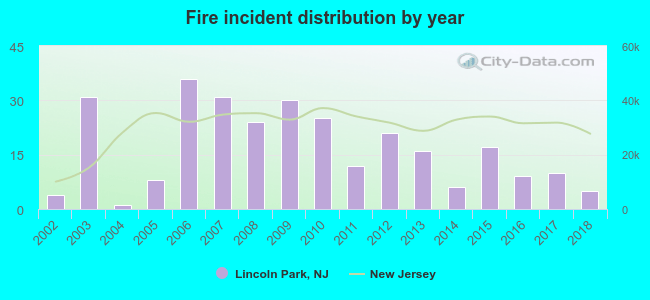 Based on the data from the years 2002 - 2018 the average number of fire incidents per year is 17. The highest number of fires - 36 took place in 2006, and the least - 1 in 2004. The data has a growing trend.
The average number of yearly fire incidents per 10k residents in Lincoln Park, NJ compared to nearest cities:
(Note: Based on data for the last 3 years, including only cities with population 5,000 and above)
| Lincoln Park: | 7.6 |
| Wayne: | 12.5 |
| Fairfield: | 65.1 |
| Totowa: | 76.8 |
| North Caldwell: | 9.3 |
| Little Falls: | 65.6 |
| West Caldwell: | 32.1 |
| Pompton Lakes: | 14.9 |
| West Paterson: | 0.9 |

 35.3% incidents where reported in the morning and 64.7% in the evening. The most fires (18.2%) took place on Wednesday, and the least (11.2%) on Friday.
 According to the 286 incident reports from years 2002 - 2018 most fires (11.2%) took place during March, and the least (5.2%) in December.
 Out of all 1,128 cases reported during the years 2002 - 2018, the most belonged to the categories: Hazardous Condition (35.5%), False Alarm (29.8%), and Fire (25.4%).
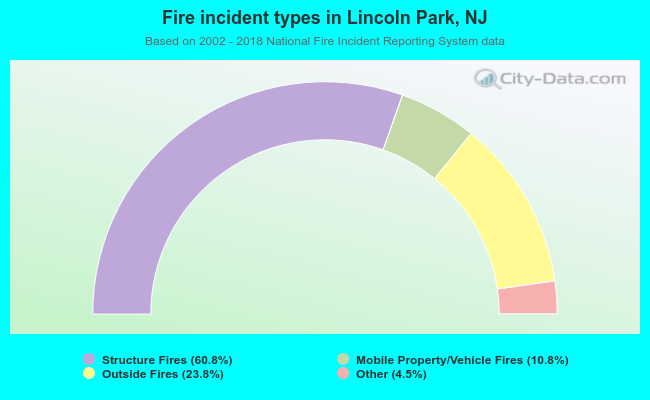 When looking into fire subcategories, the most incidents belonged to: Structure Fires (60.8%), and Outside Fires (23.8%).