Cedar Grove: Fire Incidents, New Jersey (NJ)
Where are fire incidents reported in Cedar Grove, NJ
Something went wrong! Please refresh the page.
|
| |||||||||||||||||||||||||||||||||||||||||||||||||||||||||||||||||||||||||||||||||||||||||||||||||||||||||||||
2005 - 2018 National Fire Incident Reporting System (NFIRS) incidents
- Incident types reported to NFIRS in Cedar Grove, NJ
- 56751.0%False Alarm
- 23821.4%Hazardous Condition
- 11810.6%Fire
- 686.1%Service Call
- 635.7%Rescue & EMS
- 474.2%Good Intent Call
- 60.5%Severe Weather
- 50.4%Overpressure Rupture
- Fire incident types reported to NFIRS in Cedar Grove, NJ
- 7765.3%Structure Fires
- 2823.7%Outside Fires
- 119.3%Mobile Property/Vehicle Fires
- 21.7%Other
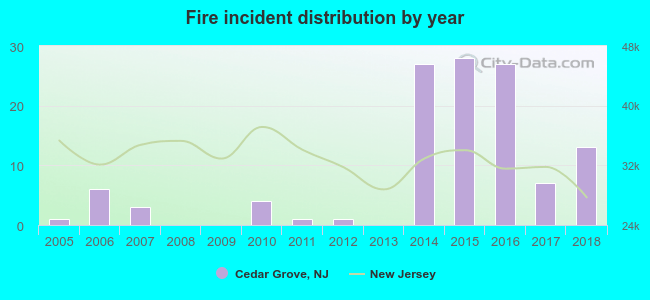 According to the data from the years 2005 - 2018 the average number of fire incidents per year is 8. The highest number of fires - 28 took place in 2015, and the least - 0 in 2008. The data has a rising trend.
The average number of yearly fire incidents per 10k residents in Cedar Grove, NJ compared to nearest cities:
(Note: Based on data for the last 3 years, including only cities with population 5,000 and above)
| Cedar Grove: | 13.1 |
| Upper Montclair: | 11.2 |
| North Caldwell: | 9.3 |
| Little Falls: | 65.6 |
| Verona: | 1.9 |
| Montclair: | 14.4 |
| Caldwell: | 18.1 |
| West Paterson: | 0.9 |
| West Caldwell: | 32.1 |

 42.4% incidents where reported in the morning and 57.6% in the evening. The most fires (21.2%) took place on Saturday, and the least (11.0%) on Tuesday.
 According to the 118 fire incident reports from years 2005 - 2018 most fires (12.7%) took place during February, and the least (5.1%) in July.
 Out of all 1,112 cases reported during the years 2005 - 2018, the most belonged to the categories: False Alarm (51.0%), Hazardous Condition (21.4%), and Fire (10.6%).
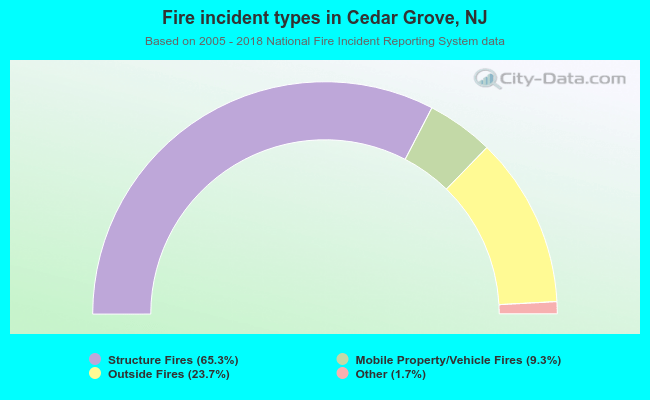 When looking into fire subcategories, the most reports belonged to: Structure Fires (65.3%), and Outside Fires (23.7%).