Englewood: Fire Incidents, New Jersey (NJ)
Where are fire incidents reported in Englewood, NJ
Something went wrong! Please refresh the page.
| Fire incidents reported | |
|---|---|
| Sreet name | Count |
| PALISADE AVE | 568 |
| ENGLE ST | 272 |
| GRAND AVE | 196 |
| ENGLEWOOD AVE | 128 |
| DEAN ST | 122 |
| VAN BRUNT ST | 102 |
| JAMES ST | 82 |
| FOREST AVE | 80 |
| TENAFLY RD | 78 |
| WILLIAM ST | 76 |
| TRIBUTARY PLZ | 72 |
| TRYON AVE | 70 |
| HUDSON AVE | 68 |
| LAFAYETTE PL | 58 |
| LINDEN AVE | 56 |
| WOODLAND ST | 56 |
| CHAMIN PLZ | 54 |
| LYDECKER ST | 50 |
| NATHANIEL PL | 50 |
| KNICKERBOCKER RD | 48 |
| MAPLE ST | 48 |
| HIDDEN LEDGE RD | 46 |
| OLD QUARRY RD | 46 |
| WEST ST | 46 |
| DEMAREST AVE | 42 |
| LIBERTY RD | 42 |
| ROUTE 4 HWY | 42 |
| BROAD AVE | 40 |
| HUMPHREY ST | 40 |
| VAN NOSTRAND AVE | 40 |
2002 - 2018 National Fire Incident Reporting System (NFIRS) incidents
- Incident types reported to NFIRS in Englewood, NJ
- 4,86635.1%Hazardous Condition
- 3,06222.1%False Alarm
- 2,67919.3%Fire
- 1,44410.4%Service Call
- 1,1037.9%Rescue & EMS
- 6654.8%Good Intent Call
- 340.2%Overpressure Rupture
- 170.1%Special Incident
- Fire incident types reported to NFIRS in Englewood, NJ
- 2,11078.8%Structure Fires
- 39514.7%Outside Fires
- 1595.9%Mobile Property/Vehicle Fires
- 150.6%Other
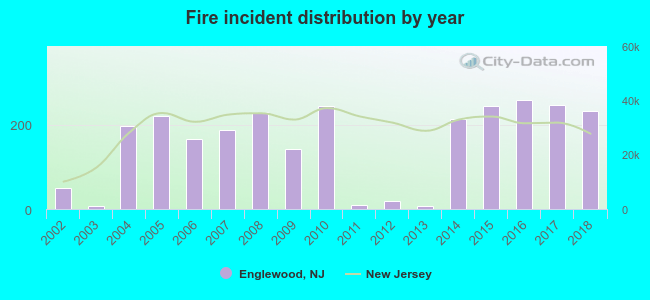 According to the data from the years 2002 - 2018 the average number of fires per year is 158. The highest number of reported fires - 258 took place in 2016, and the least - 6 in 2003. The data has a rising trend.
The average number of yearly fire incidents per 10k residents in Englewood, NJ compared to nearest cities:
(Note: Based on data for the last 3 years, including only cities with population 5,000 and above)
| Englewood: | 88.8 |
| Englewood Cliffs: | 18.0 |
| Teaneck: | 47.0 |
| Tenafly: | 11.0 |
| Leonia: | 53.6 |
| Bergenfield: | 27.6 |
| Fort Lee: | 43.8 |
| Bogota: | 35.6 |
| Cresskill: | 9.1 |
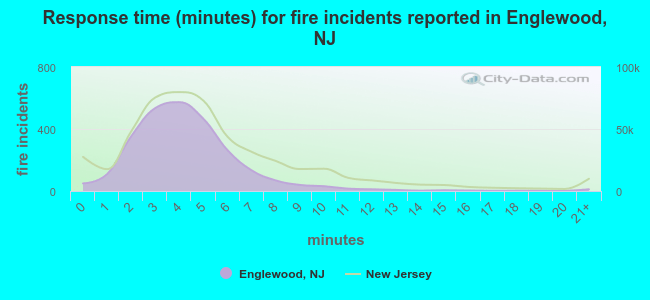 The median response time based on all reported fire incidents is 4 minutes. This is lower compared to the New Jersey median value.
The median response time in Englewood, NJ compared to nearest cities:
(Note: Based on data for all years, including only cities with at least 500 fire incidents)
| Englewood: | 4 minutes |
| Teaneck: | 3 minutes |
| Leonia: | 3 minutes |
| Bergenfield: | 3 minutes |
| Fort Lee: | 4 minutes |
| Palisades Park: | 2 minutes |
| Hackensack: | 3 minutes |
| Edgewater: | 3 minutes |
| Ridgefield: | 3 minutes |
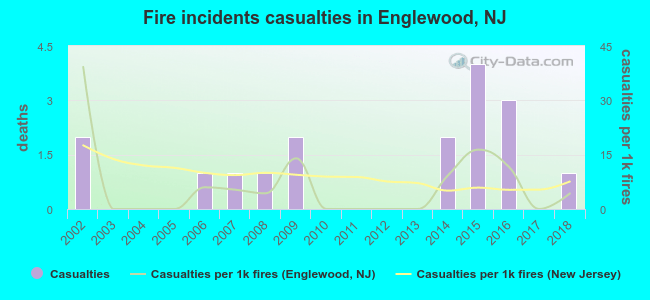 According to the data from the years 2002 - 2018 the average number of fire-related yearly casualties is 1. The highest number of reported injuries - 4 took place in 2015, and the lowest - 0 in 2003. The data has a dropping trend.
The average number of casualties per 1,000 fires is 6. This indicator was the highest - 39 in 2002, and the lowest 0 in 2003. The trend for casualties per 1,000 incidents is dropping. Compared to the New Jersey value the number of injuries per 1,000 incidents is lower.
According to the data from the years 2002 - 2018 the average number of fire-related yearly casualties is 1. The highest number of reported injuries - 4 took place in 2015, and the lowest - 0 in 2003. The data has a dropping trend.
The average number of casualties per 1,000 fires is 6. This indicator was the highest - 39 in 2002, and the lowest 0 in 2003. The trend for casualties per 1,000 incidents is dropping. Compared to the New Jersey value the number of injuries per 1,000 incidents is lower.Casualties per 1,000 incidents in Englewood, NJ compared to nearest cities:
(Note: Based on data for all years, including only cities with at least 500 fire incidents)
| Englewood: | 6.3 |
| Teaneck: | 11.1 |
| Leonia: | 1.4 |
| Bergenfield: | 18.9 |
| Fort Lee: | 18.4 |
| Palisades Park: | 7.4 |
| Hackensack: | 13.1 |
| Edgewater: | 0.0 |
| Ridgefield: | 7.6 |
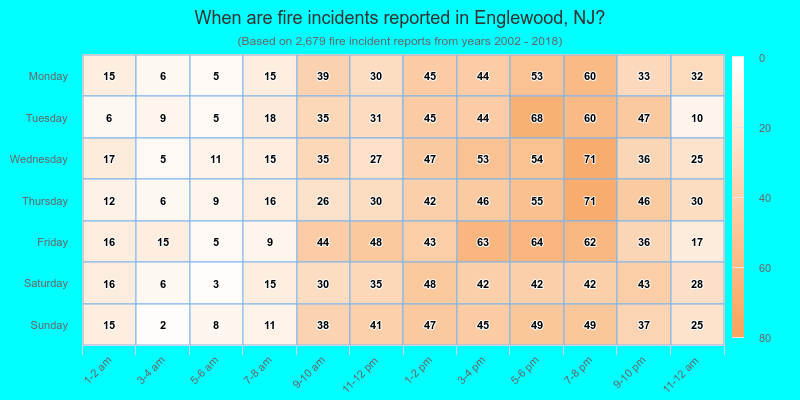
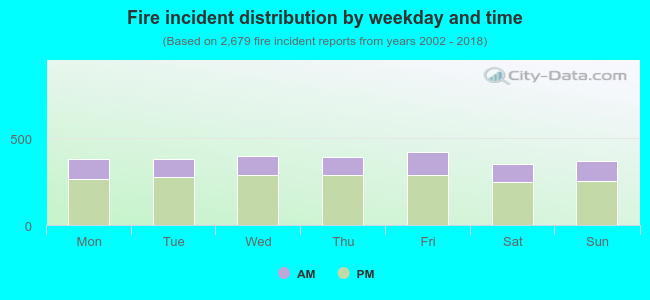 29.1% incidents where reported in the morning and 70.9% in the evening. The most fires (15.8%) took place on Friday, and the least (13.1%) on Saturday.
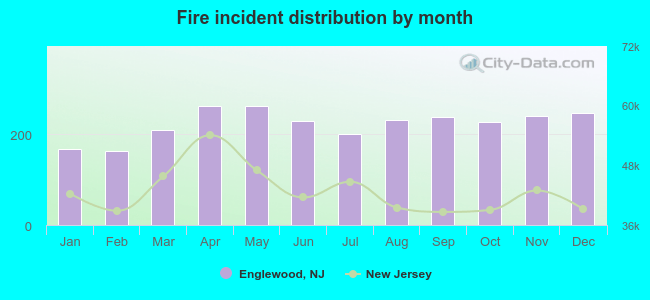 According to the 2,679 fire incidents from years 2002 - 2018 most fires (9.8%) took place during April, and the least (6.0%) in February.
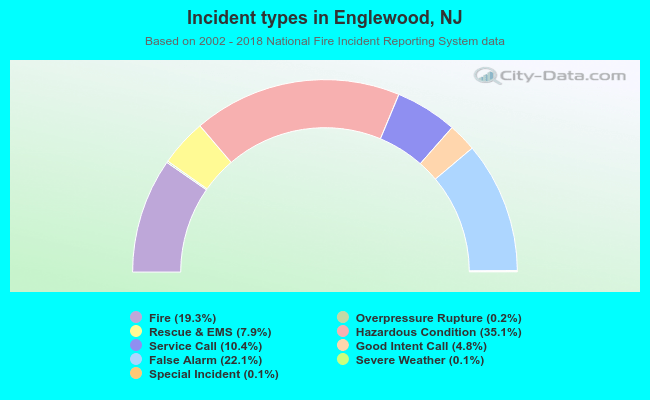 Out of all 13,878 cases reported during the years 2002 - 2018, the most belonged to the categories: Hazardous Condition (35.1%), False Alarm (22.1%), and Fire (19.3%).
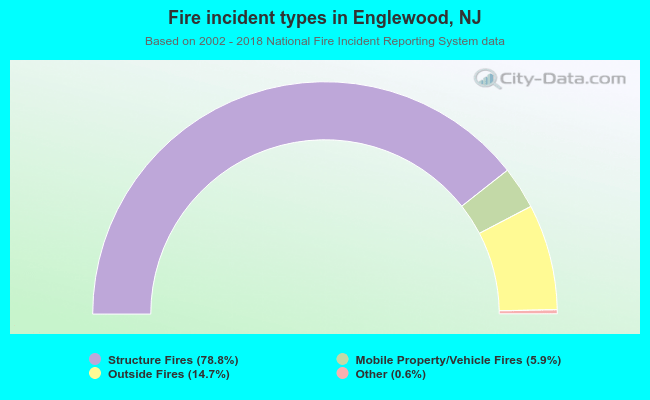 When looking into fire subcategories, the most incidents belonged to: Structure Fires (78.8%), and Outside Fires (14.7%).