Fort Lee: Fire Incidents, New Jersey (NJ)
Where are fire incidents reported in Fort Lee, NJ
Something went wrong! Please refresh the page.
| Fire incidents reported | |
|---|---|
| Sreet name | Count |
| MAIN ST | 294 |
| LEMOINE AVE | 206 |
| PALISADE AVE | 196 |
| CENTER AVE | 124 |
| HORIZON RD | 120 |
| ANDERSON AVE | 94 |
| LINWOOD AVE | 92 |
| 15TH ST | 86 |
| ROUTE 4 | 82 |
| ROUTE 95 | 82 |
| BERGEN BLVD | 72 |
| NORTH AVE | 72 |
| HUDSON TER | 70 |
| OLD PALISADE RD | 42 |
| CENTRAL RD | 40 |
| EDWIN AVE | 36 |
| ABBOTT BLVD | 34 |
| INWOOD TER | 32 |
| BRIDGE PLAZA NORTH | 28 |
| EXECUTIVE DR | 26 |
| LINWOOD PLZ | 26 |
| N. CENTRAL RD | 26 |
| BRIDGE PLAZA SOUTH | 24 |
| PARK PL | 24 |
| PARKER AVE | 22 |
| CEDAR ST | 20 |
| FLETCHER AVE | 20 |
| JOHN ST | 20 |
| MYRTLE AVE | 20 |
| WEST ST | 20 |
2004 - 2018 National Fire Incident Reporting System (NFIRS) incidents
- Incident types reported to NFIRS in Fort Lee, NJ
- 2,76733.8%Hazardous Condition
- 2,75033.5%False Alarm
- 1,46817.9%Fire
- 7699.4%Service Call
- 2573.1%Rescue & EMS
- 1451.8%Good Intent Call
- 250.3%Overpressure Rupture
- 110.1%Severe Weather
- Fire incident types reported to NFIRS in Fort Lee, NJ
- 77252.6%Structure Fires
- 41928.5%Outside Fires
- 20514.0%Mobile Property/Vehicle Fires
- 724.9%Other
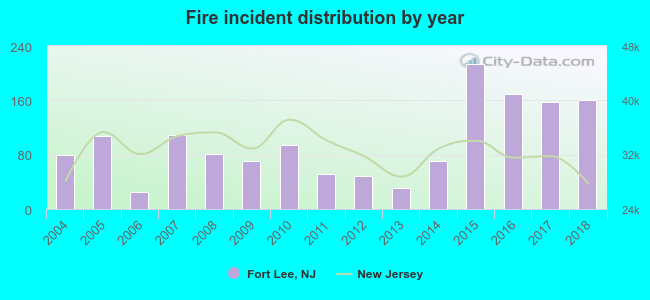 According to the data from the years 2004 - 2018 the average number of fire incidents per year is 98. The highest number of reported fire incidents - 213 took place in 2015, and the least - 25 in 2006. The data has a growing trend.
The average number of yearly fire incidents per 10k residents in Fort Lee, NJ compared to nearest cities:
(Note: Based on data for the last 3 years, including only cities with population 5,000 and above)
| Fort Lee: | 43.8 |
| Palisades Park: | 37.8 |
| Leonia: | 53.6 |
| Edgewater: | 39.4 |
| Ridgefield: | 38.7 |
| Cliffside Park: | 53.6 |
| Englewood Cliffs: | 18.0 |
| Ridgefield Park: | 30.3 |
| Fairview: | 16.3 |
 The median response time based on all reported fire incidents is 4 minutes. This is lower compared to the state median value.
The median response time in Fort Lee, NJ compared to nearest cities:
(Note: Based on data for all years, including only cities with at least 500 fire incidents)
| Fort Lee: | 4 minutes |
| Palisades Park: | 2 minutes |
| Leonia: | 3 minutes |
| Edgewater: | 3 minutes |
| Ridgefield: | 3 minutes |
| Cliffside Park: | 5 minutes |
| Englewood: | 4 minutes |
| Teaneck: | 3 minutes |
| Hackensack: | 3 minutes |
 Based on the reports from the years 2004 - 2018 the average number of fire-related fatalities per year is 0. The highest number of deaths - 2 took place in 2010, and the lowest - 0 in 2004. The data has a constant trend.
 According to the reports from the years 2004 - 2018 the average number of fire-related yearly casualties is 2. The highest number of reported injuries - 13 took place in 2007, and the lowest - 0 in 2006. The data has a decreasing trend.
The average number of casualties per 1,000 fire incidents is 18. This indicator was the highest - 119 in 2007, and the lowest 0 in 2006. The trend for casualties per 1,000 incidents is declining. Compared to the state value the number of injuries per 1,000 incidents is much higher.
According to the reports from the years 2004 - 2018 the average number of fire-related yearly casualties is 2. The highest number of reported injuries - 13 took place in 2007, and the lowest - 0 in 2006. The data has a decreasing trend.
The average number of casualties per 1,000 fire incidents is 18. This indicator was the highest - 119 in 2007, and the lowest 0 in 2006. The trend for casualties per 1,000 incidents is declining. Compared to the state value the number of injuries per 1,000 incidents is much higher.Casualties per 1,000 incidents in Fort Lee, NJ compared to nearest cities:
(Note: Based on data for all years, including only cities with at least 500 fire incidents)
| Fort Lee: | 18.4 |
| Palisades Park: | 7.4 |
| Leonia: | 1.4 |
| Edgewater: | 0.0 |
| Ridgefield: | 7.6 |
| Cliffside Park: | 4.7 |
| Englewood: | 6.3 |
| Teaneck: | 11.1 |
| Hackensack: | 13.1 |
 28.1% incidents where reported in the morning and 71.9% in the evening. The most fires (16.1%) took place on Saturday, and the least (13.1%) on Friday.
 Based on the 1,468 fire incident reports from years 2004 - 2018 most fires (10.8%) took place during May, and the least (6.4%) in January.
 Out of all 8,197 cases reported during the years 2004 - 2018, the most belonged to the categories: Hazardous Condition (33.8%), False Alarm (33.5%), and Fire (17.9%).
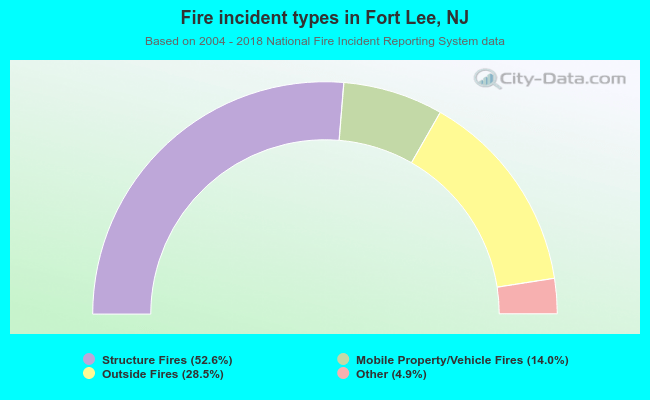 When looking into fire subcategories, the most reports belonged to: Structure Fires (52.6%), and Outside Fires (28.5%).