Cliffside Park: Fire Incidents, New Jersey (NJ)
Where are fire incidents reported in Cliffside Park, NJ
Something went wrong! Please refresh the page.
| Fire incidents reported | |
|---|---|
| Sreet name | Count |
| GORGE RD | 1,168 |
| ANDERSON AVE | 336 |
| PALISADE AVE | 178 |
| WINSTON DR | 162 |
| PALISADES AVE | 104 |
| WALKER ST | 66 |
| COLUMBIA AVE | 48 |
| KNOX AVE | 42 |
| LAWTON AVE | 42 |
| OAKDENE AVE | 40 |
| WASHINGTON PL | 34 |
| GRANT AVE | 30 |
| LINCOLN AVE | 28 |
| NELSON AVE | 28 |
| DAY AVE | 26 |
| EDGEWATER RD | 26 |
| WASHINGTON AVE | 26 |
| LAIRD AVE | 24 |
| CLIFF ST | 22 |
| LAFAYETTE AVE | 22 |
| OLYMPIA AVE | 20 |
| FRANKLIN AVE | 16 |
| ADOLPHUS AVE | 12 |
| DIVISION ST | 12 |
| ONCREST TER | 12 |
| PARK AVE | 12 |
| RIVERVIEW AVE | 12 |
| WEST END AVE | 12 |
| COLUMBUS PL | 10 |
| CRESCENT AVE | 10 |
2004 - 2018 National Fire Incident Reporting System (NFIRS) incidents
- Incident types reported to NFIRS in Cliffside Park, NJ
- 1,49538.3%Fire
- 1,20930.9%Hazardous Condition
- 74819.1%False Alarm
- 3037.8%Service Call
- 731.9%Good Intent Call
- 611.6%Rescue & EMS
- 160.4%Severe Weather
- Fire incident types reported to NFIRS in Cliffside Park, NJ
- 1,28686.0%Structure Fires
- 1026.8%Outside Fires
- 604.0%Mobile Property/Vehicle Fires
- 473.1%Other
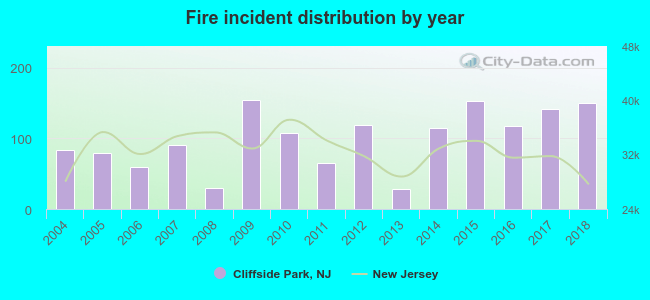 Based on the data from the years 2004 - 2018 the average number of fire incidents per year is 100. The highest number of fires - 154 took place in 2009, and the least - 29 in 2013. The data has a growing trend.
The average number of yearly fire incidents per 10k residents in Cliffside Park, NJ compared to nearest cities:
(Note: Based on data for the last 3 years, including only cities with population 5,000 and above)
| Cliffside Park: | 53.6 |
| Fairview: | 16.3 |
| Edgewater: | 39.4 |
| Ridgefield: | 38.7 |
| Palisades Park: | 37.8 |
| Fort Lee: | 43.8 |
| Guttenberg: | 20.6 |
| West New York: | 20.0 |
| Leonia: | 53.6 |
 The median response time based on all reported fire incidents is 5 minutes. This is comparable to the state median value.
The median response time in Cliffside Park, NJ compared to nearest cities:
(Note: Based on data for all years, including only cities with at least 500 fire incidents)
| Cliffside Park: | 5 minutes |
| Edgewater: | 3 minutes |
| Ridgefield: | 3 minutes |
| Palisades Park: | 2 minutes |
| Fort Lee: | 4 minutes |
| West New York: | 4 minutes |
| Leonia: | 3 minutes |
| Union City: | 4 minutes |
| Secaucus: | 4 minutes |
 Based on the reports from the years 2004 - 2018 the average number of fire-related yearly casualties is 0. The highest number of casualties - 2 took place in 2009, and the lowest - 0 in 2004. The data has a constant trend.
The average number of injuries per 1,000 fire incidents is 5. This indicator was the highest - 33 in 2008, and the lowest 0 in 2004. The trend for injuries per 1,000 fires is constant. Compared to the New Jersey value the number of casualties per 1,000 fire incidents is lower.
Based on the reports from the years 2004 - 2018 the average number of fire-related yearly casualties is 0. The highest number of casualties - 2 took place in 2009, and the lowest - 0 in 2004. The data has a constant trend.
The average number of injuries per 1,000 fire incidents is 5. This indicator was the highest - 33 in 2008, and the lowest 0 in 2004. The trend for injuries per 1,000 fires is constant. Compared to the New Jersey value the number of casualties per 1,000 fire incidents is lower.Casualties per 1,000 incidents in Cliffside Park, NJ compared to nearest cities:
(Note: Based on data for all years, including only cities with at least 500 fire incidents)
| Cliffside Park: | 4.7 |
| Edgewater: | 0.0 |
| Ridgefield: | 7.6 |
| Palisades Park: | 7.4 |
| Fort Lee: | 18.4 |
| West New York: | 3.4 |
| Leonia: | 1.4 |
| Union City: | 10.8 |
| Secaucus: | 5.0 |
 28.4% incidents where reported in the morning and 71.6% in the evening. The most fires (17.7%) took place on Sunday, and the least (12.8%) on Tuesday.
 According to the 1,495 fire incident reports from years 2004 - 2018 most fires (10.0%) took place during March, and the least (6.6%) in July.
 Out of all 3,908 cases reported during the years 2004 - 2018, the most belonged to the categories: Fire (38.3%), Hazardous Condition (30.9%), and False Alarm (19.1%).
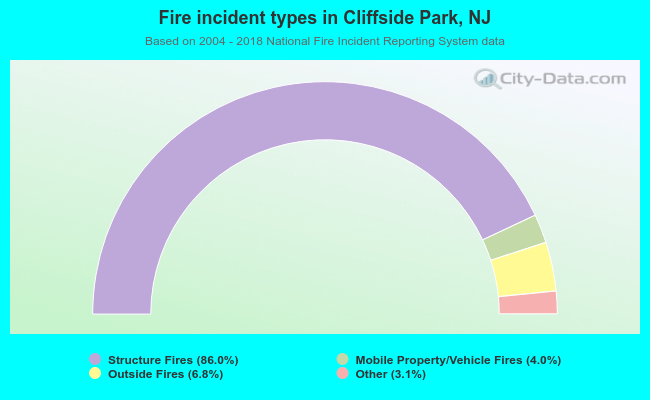 When looking into fire subcategories, the most reports belonged to: Structure Fires (86.0%), and Outside Fires (6.8%).