Guttenberg: Fire Incidents, New Jersey (NJ)
Where are fire incidents reported in Guttenberg, NJ
Something went wrong! Please refresh the page.
|
| |||||||||||||||||||||||||||||||||||||||||||||||||||||||||||||||||||||||||||||
2004 - 2018 National Fire Incident Reporting System (NFIRS) incidents
- Incident types reported to NFIRS in Guttenberg, NJ
- 76034.2%False Alarm
- 61927.8%Hazardous Condition
- 44920.2%Fire
- 1999.0%Service Call
- 1024.6%Rescue & EMS
- 894.0%Good Intent Call
- 30.1%Overpressure Rupture
- Fire incident types reported to NFIRS in Guttenberg, NJ
- 37082.4%Structure Fires
- 5712.7%Outside Fires
- 153.3%Mobile Property/Vehicle Fires
- 71.6%Other
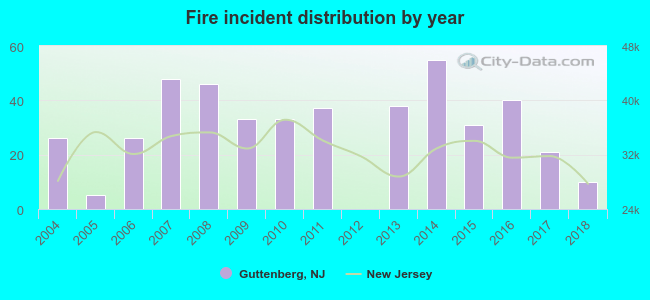 Based on the data from the years 2004 - 2018 the average number of fires per year is 30. The highest number of fire incidents - 55 took place in 2014, and the least - 0 in 2012. The data has a decreasing trend.
The average number of yearly fire incidents per 10k residents in Guttenberg, NJ compared to nearest cities:
(Note: Based on data for the last 3 years, including only cities with population 5,000 and above)
| Guttenberg: | 20.6 |
| West New York: | 20.0 |
| Fairview: | 16.3 |
| Cliffside Park: | 53.6 |
| Union City: | 27.0 |
| Ridgefield: | 38.7 |
| Secaucus: | 39.3 |
| Edgewater: | 39.4 |
| Palisades Park: | 37.8 |

 32.3% incidents where reported in the morning and 67.7% in the evening. The most fires (17.1%) took place on Saturday, and the least (11.4%) on Tuesday.
 According to the 449 fire incident reports from years 2004 - 2018 most fires (13.4%) took place during April, and the least (6.7%) in February.
 Out of all 2,223 cases reported during the years 2004 - 2018, the most belonged to the categories: False Alarm (34.2%), Hazardous Condition (27.8%), and Fire (20.2%).
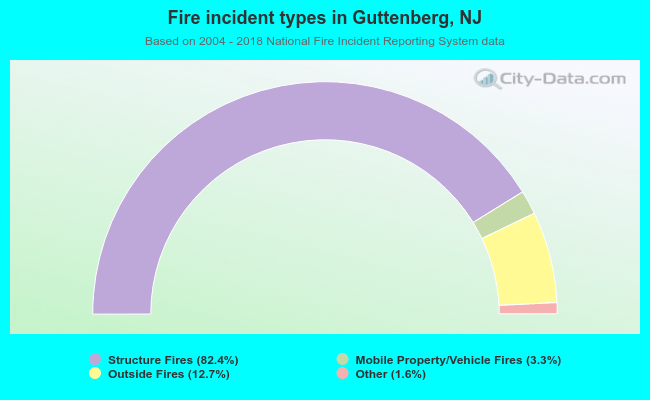 When looking into fire subcategories, the most reports belonged to: Structure Fires (82.4%), and Outside Fires (12.7%).