Hoboken: Fire Incidents, New Jersey (NJ)
Where are fire incidents reported in Hoboken, NJ
Something went wrong! Please refresh the page.
| Fire incidents reported | |
|---|---|
| Sreet name | Count |
| WASHINGTON ST | 532 |
| HUDSON ST | 368 |
| WILLOW AVE | 280 |
| RIVER TERRACE | 236 |
| PARK AVE | 230 |
| CASTLE POINT STATION | 212 |
| JACKSON ST | 208 |
| GARDEN ST | 206 |
| ADAMS ST | 202 |
| CLINTON ST | 200 |
| JEFFERSON ST | 186 |
| RIVER ST | 182 |
| MADISON ST | 180 |
| 1ST ST | 166 |
| BLOOMFIELD ST | 166 |
| MONROE ST | 150 |
| GRAND ST | 136 |
| MARSHALL DR | 114 |
| CASTLE POINT TERRACE | 98 |
| NEWARK ST | 92 |
| CHURCH TOWERS | 88 |
| HARRISON ST | 76 |
| STEVENS CAMPUS | 70 |
| 14TH ST | 68 |
| 13TH ST | 58 |
| 11TH ST | 56 |
| 9TH ST | 46 |
| SINATRA DRIVE | 46 |
| 12TH ST | 44 |
| 6TH ST | 42 |
2006 - 2018 National Fire Incident Reporting System (NFIRS) incidents
- Incident types reported to NFIRS in Hoboken, NJ
- 6,16830.3%False Alarm
- 5,33226.2%Hazardous Condition
- 2,97214.6%Service Call
- 2,70113.3%Fire
- 1,5007.4%Rescue & EMS
- 1,3266.5%Good Intent Call
- 2921.4%Special Incident
- 650.3%Overpressure Rupture
- 240.1%Severe Weather
- Fire incident types reported to NFIRS in Hoboken, NJ
- 2,10377.9%Structure Fires
- 46517.2%Outside Fires
- 813.0%Mobile Property/Vehicle Fires
- 521.9%Other
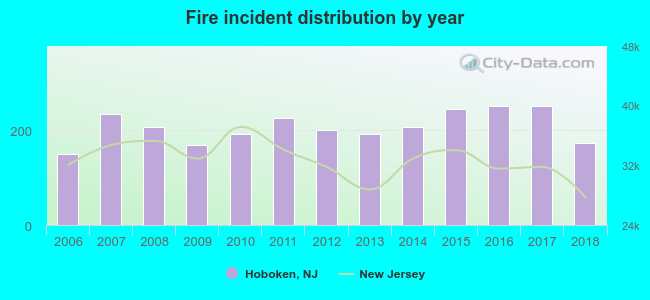 According to the data from the years 2006 - 2018 the average number of fire incidents per year is 208. The highest number of fires - 252 took place in 2017, and the least - 149 in 2006. The data has a growing trend.
The average number of yearly fire incidents per 10k residents in Hoboken, NJ compared to nearest cities:
(Note: Based on data for the last 3 years, including only cities with population 5,000 and above)
| Hoboken: | 42.3 |
| Union City: | 27.0 |
| Jersey City: | 54.2 |
| West New York: | 20.0 |
| Secaucus: | 39.3 |
| Guttenberg: | 20.6 |
| Fairview: | 16.3 |
| Kearny: | 23.8 |
| Cliffside Park: | 53.6 |
 The median response time based on all reported fire incidents is 3 minutes. This is lower compared to the state median value.
The median response time in Hoboken, NJ compared to nearest cities:
(Note: Based on data for all years, including only cities with at least 500 fire incidents)
| Hoboken: | 3 minutes |
| Union City: | 4 minutes |
| Jersey City: | 4 minutes |
| West New York: | 4 minutes |
| Secaucus: | 4 minutes |
| Kearny: | 4 minutes |
| Cliffside Park: | 5 minutes |
| Ridgefield: | 3 minutes |
| Lyndhurst: | 3 minutes |
 Based on the data from the years 2006 - 2018 the average number of fire-related casualties per year is 1. The highest number of reported injuries - 5 took place in 2006, and the lowest - 0 in 2008. The data has a dropping trend.
The average number of casualties per 1,000 fires is 5. This indicator was the highest - 34 in 2006, and the lowest 0 in 2008. The trend for casualties per 1,000 fire incidents is declining. Compared to the state value the number of injuries per 1,000 fire incidents is lower.
Based on the data from the years 2006 - 2018 the average number of fire-related casualties per year is 1. The highest number of reported injuries - 5 took place in 2006, and the lowest - 0 in 2008. The data has a dropping trend.
The average number of casualties per 1,000 fires is 5. This indicator was the highest - 34 in 2006, and the lowest 0 in 2008. The trend for casualties per 1,000 fire incidents is declining. Compared to the state value the number of injuries per 1,000 fire incidents is lower.Casualties per 1,000 incidents in Hoboken, NJ compared to nearest cities:
(Note: Based on data for all years, including only cities with at least 500 fire incidents)
| Hoboken: | 4.4 |
| Union City: | 10.8 |
| Jersey City: | 8.9 |
| West New York: | 3.4 |
| Secaucus: | 5.0 |
| Kearny: | 16.0 |
| Cliffside Park: | 4.7 |
| Ridgefield: | 7.6 |
| Lyndhurst: | 6.0 |
 29.8% incidents where reported in the morning and 70.2% in the evening. The most fires (17.5%) took place on Sunday, and the least (11.8%) on Friday.
 According to the 2,701 fire incidents from years 2006 - 2018 most fires (9.4%) took place during November, and the least (5.6%) in September.
 Out of all 20,380 cases reported during the years 2006 - 2018, the most belonged to the categories: False Alarm (30.3%), Hazardous Condition (26.2%), and Service Call (14.6%).
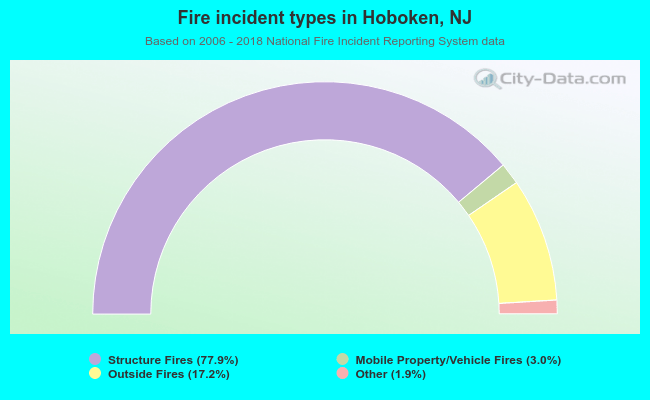 When looking into fire subcategories, the most incidents belonged to: Structure Fires (77.9%), and Outside Fires (17.2%).