Estimated zip code population in 2022: 81,831 Zip code population in 2010: 82,728 Zip code population in 2000: 77,785
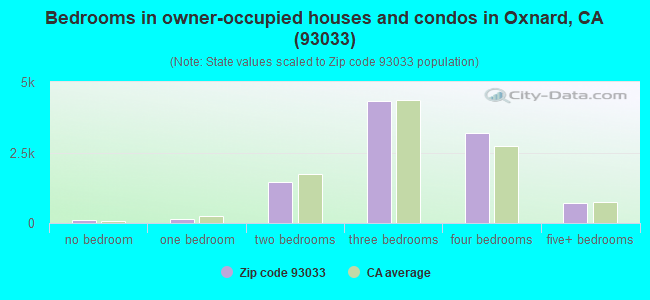
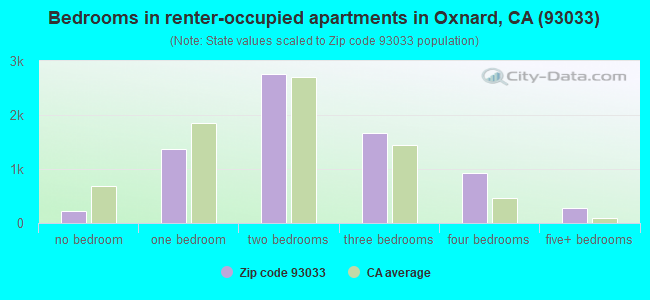
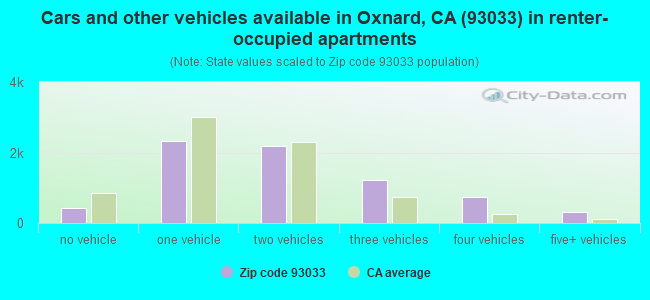
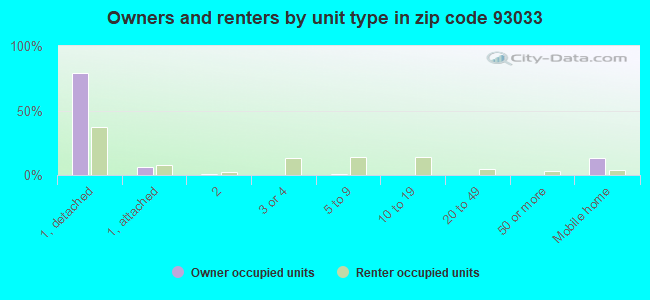
Houses and condos: 17,734 Renter-occupied apartments: 7,235
% of renters here:
42%
State:
44%
March 2022 cost of living index in zip code 93033: 92.0 (less than average, U.S. average is 100)
Land area: 29.3 sq. mi. Water area: 0.1 sq. mi.
Population density: 2,790 people per square mile
(average).
OSM Map
General Map
Google Map
MSN Map
OSM Map
General Map
Google Map
MSN Map
OSM Map
General Map
Google Map
MSN Map
OSM Map
General Map
Google Map
MSN Map
Please wait while loading the map...
Real estate property taxes paid for housing units in 2022:
This zip code:
0.6% ($3,123)
California:
0.7% ($4,831)
Median real estate property taxes paid for housing units with mortgages in 2022: $3,684 (0.6%) Median real estate property taxes paid for housing units with no mortgage in 2022: $1,847 (0.4%)
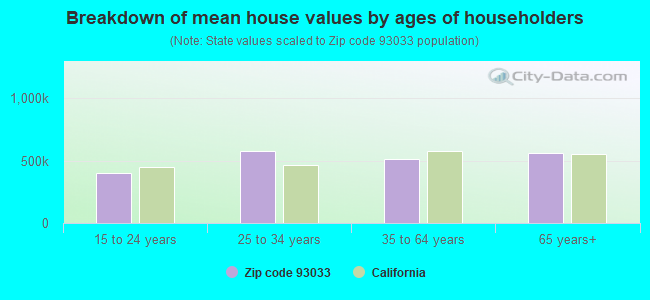
Estimated median house/condo value in 2022: $564,207
93033:
$564,207
California:
$715,900
According to our research of California and other state lists, there were 64 registered sex offenders living in 93033 zip code as of April 27, 2024. The ratio of all residents to sex offenders in zip code 93033 is 1,317 to 1. The ratio of registered sex offenders to all residents in this zip code is lower than the state average.
Median resident age:
This zip code:
31.3 years
California median age:
37.9 years
Average household size:
This zip code:
4.7 people
California:
2.8 people
Averages for the 2020 tax year for zip code 93033, filed in 2021:
Average Adjusted Gross Income (AGI) in 2020: $41,886 (Individual Income Tax Returns)
Here:
$41,886
State:
$95,910
Salary/wage: $38,446 (reported on 89.5% of returns)
Here:
$38,446
State:
$77,331
(% of AGI for various income ranges: 1721.9% for AGIs below $25k, 4986.1% for AGIs $25k-50k, 8706.5% for AGIs $50k-75k, 12383.8% for AGIs $75k-100k, 19425.4% for AGIs $100k-200k, 80220.0% for AGIs over 200k)
Taxable interest for individuals: $381 (reported on 18.1% of returns)
This zip code:
$381
California:
$2,294
(% of AGI for various income ranges: 3.9% for AGIs below $25k, 5.8% for AGIs $25k-50k, 15.5% for AGIs $50k-75k, 28.4% for AGIs $75k-100k, 58.1% for AGIs $100k-200k, 606.7% for AGIs over 200k)
Ordinary dividends: $2,028 (reported on 3.6% of returns)
Here:
$2,028
State:
$10,949
(% of AGI for various income ranges: 2.8% for AGIs below $25k, 2.4% for AGIs $25k-50k, 10.3% for AGIs $50k-75k, 21.2% for AGIs $75k-100k, 66.4% for AGIs $100k-200k, 3180.0% for AGIs over 200k)
Net capital gain/loss in AGI: +$5,792 (reported on 3.9% of returns)
Here:
+$5,792
State:
+$49,306
(% of AGI for various income ranges: 1.5% for AGIs below $25k, 3.7% for AGIs $25k-50k, 14.5% for AGIs $50k-75k, 32.5% for AGIs $75k-100k, 246.7% for AGIs $100k-200k, 14883.3% for AGIs over 200k)
Profit/loss from business: +$9,450 (reported on 10.2% of returns)
Here:
+$9,450
State:
+$15,671
(% of AGI for various income ranges: 159.0% for AGIs below $25k, 122.4% for AGIs $25k-50k, 150.9% for AGIs $50k-75k, 229.2% for AGIs $75k-100k, 249.9% for AGIs $100k-200k, 5263.3% for AGIs over 200k)
Taxable individual retirement arrangement distribution: $12,066 (reported on 2.1% of returns)
93033:
$12,066
California:
$23,505
(% of AGI for various income ranges: 14.6% for AGIs below $25k, 18.6% for AGIs $25k-50k, 40.9% for AGIs $50k-75k, 111.6% for AGIs $75k-100k, 337.2% for AGIs $100k-200k)
Total itemized deductions: $27,450 (reported on 6.0% of returns)
Here:
$27,450
State:
$39,517
(% of AGI for various income ranges: 35.6% for AGIs below $25k, 114.3% for AGIs $25k-50k, 417.2% for AGIs $50k-75k, 816.5% for AGIs $75k-100k, 1668.3% for AGIs $100k-200k, 13376.7% for AGIs over 200k)
Charity contributions: $3,887 (reported on 4.5% of returns)
Here:
$3,887
State:
$12,598
(% of AGI for various income ranges: 1.6% for AGIs below $25k, 11.7% for AGIs $25k-50k, 36.2% for AGIs $50k-75k, 80.2% for AGIs $75k-100k, 235.1% for AGIs $100k-200k, 1490.0% for AGIs over 200k)
Taxes paid: $7,633 (reported on 5.9% of returns)
93033:
$7,633
State:
$8,807
(% of AGI for various income ranges: 7.2% for AGIs below $25k, 29.0% for AGIs $25k-50k, 114.7% for AGIs $50k-75k, 255.6% for AGIs $75k-100k, 505.5% for AGIs $100k-200k, 2176.7% for AGIs over 200k)
Earned income credit: $2,258 (reported on 20.1% of returns)
Here:
$2,258
State:
$2,074
(% of AGI for various income ranges: 119.1% for AGIs below $25k, 86.3% for AGIs $25k-50k, 1.8% for AGIs $50k-75k)
Percentage of individuals using paid preparers for their 2020 taxes: 92.1%
Here:
92%
State:
92%
(% for various income ranges: 91.2% for AGIs below $25k, 92.3% for AGIs $25k-50k, 93.0% for AGIs $50k-75k, 92.7% for AGIs $75k-100k, 93.8% for AGIs $100k-200k, 93.3% for AGIs over 200k)
Averages for the 2012 tax year for zip code 93033, filed in 2013:
Average Adjusted Gross Income (AGI) in 2012: $31,872 (Individual Income Tax Returns)
Here:
$31,872
State:
$72,726
Salary/wage: $29,729 (reported on 91.7% of returns)
Here:
$29,729
State:
$59,079
(% of AGI for various income ranges: 86.9% for AGIs below $25k, 90.4% for AGIs $25k-50k, 84.8% for AGIs $50k-75k, 83.0% for AGIs $75k-100k, 78.5% for AGIs $100k-200k, 34.6% for AGIs over 200k)
Taxable interest for individuals: $314 (reported on 16.2% of returns)
This zip code:
$314
California:
$2,146
(% of AGI for various income ranges: 0.1% for AGIs below $25k, 0.1% for AGIs $25k-50k, 0.2% for AGIs $50k-75k, 0.2% for AGIs $75k-100k, 0.2% for AGIs $100k-200k, 0.3% for AGIs over 200k)
Ordinary dividends: $1,699 (reported on 3.0% of returns)
Here:
$1,699
State:
$9,308
(% of AGI for various income ranges: 0.1% for AGIs $50k-75k, 0.2% for AGIs $75k-100k, 0.5% for AGIs $100k-200k, 1.1% for AGIs over 200k)
Net capital gain/loss in AGI: +$2,411 (reported on 1.9% of returns)
Here:
+$2,411
State:
+$30,460
(% of AGI for various income ranges: 0.1% for AGIs $50k-75k, 0.2% for AGIs $100k-200k, 5.1% for AGIs over 200k)
Profit/loss from business: +$9,132 (reported on 8.7% of returns)
Here:
+$9,132
State:
+$17,064
(% of AGI for various income ranges: 5.2% for AGIs below $25k, 2.1% for AGIs $25k-50k, 1.5% for AGIs $50k-75k, 1.2% for AGIs $75k-100k, 1.4% for AGIs $100k-200k)
Taxable individual retirement arrangement distribution: $10,881 (reported on 2.4% of returns)
93033:
$10,881
California:
$19,557
(% of AGI for various income ranges: 0.4% for AGIs below $25k, 0.4% for AGIs $25k-50k, 1.2% for AGIs $50k-75k, 1.7% for AGIs $75k-100k, 2.2% for AGIs $100k-200k)
Total itemized deductions: $20,186 (31% of AGI, reported on 15.7% of returns)
Here:
$20,186
State:
$34,004
Here:
31.3% of AGI
State:
22.7% of AGI
(% of AGI for various income ranges: 3.5% for AGIs below $25k, 7.4% for AGIs $25k-50k, 14.0% for AGIs $50k-75k, 16.8% for AGIs $75k-100k, 17.4% for AGIs $100k-200k, 19.4% for AGIs over 200k)
Charity contributions: $1,750 (reported on 12.1% of returns)
Here:
$1,750
State:
$4,659
(% of AGI for various income ranges: 0.1% for AGIs below $25k, 0.4% for AGIs $25k-50k, 0.9% for AGIs $50k-75k, 1.3% for AGIs $75k-100k, 1.7% for AGIs $100k-200k, 1.2% for AGIs over 200k)
Taxes paid: $5,346 (reported on 15.6% of returns)
93033:
$5,346
State:
$14,448
(% of AGI for various income ranges: 0.7% for AGIs below $25k, 1.7% for AGIs $25k-50k, 3.4% for AGIs $50k-75k, 4.7% for AGIs $75k-100k, 5.8% for AGIs $100k-200k, 7.9% for AGIs over 200k)
Earned income credit: $2,407 (reported on 23.6% of returns)
Here:
$2,407
State:
$2,286
(% of AGI for various income ranges: 5.5% for AGIs below $25k, 1.4% for AGIs $25k-50k)
Percentage of individuals using paid preparers for their 2012 taxes: 80.5%
Here:
81%
State:
64%
(% for various income ranges: 80.8% for AGIs below $25k, 81.2% for AGIs $25k-50k, 80.1% for AGIs $50k-75k, 75.7% for AGIs $75k-100k, 75.0% for AGIs $100k-200k, 83.3% for AGIs over 200k)
Averages for the 2004 tax year for zip code 93033, filed in 2005:
Average Adjusted Gross Income (AGI) in 2004: $30,509 (Individual Income Tax Returns)
Here:
$30,509
State:
$58,600
Salary/wage: $28,326 (reported on 92.0% of returns)
Here:
$28,326
State:
$49,455
(% of AGI for various income ranges: 98.2% for AGIs below $10k, 88.1% for AGIs $10k-25k, 89.7% for AGIs $25k-50k, 87.8% for AGIs $50k-75k, 85.4% for AGIs $75k-100k, 57.7% for AGIs over 100k)
Taxable interest for individuals: $503 (reported on 26.2% of returns)
This zip code:
$503
California:
$2,365
(% of AGI for various income ranges: 1.2% for AGIs below $10k, 0.3% for AGIs $10k-25k, 0.3% for AGIs $25k-50k, 0.5% for AGIs $50k-75k, 0.4% for AGIs $75k-100k, 0.9% for AGIs over 100k)
Taxable dividends: $1,650 (reported on 5.2% of returns)
Here:
$1,650
State:
$4,746
(% of AGI for various income ranges: 0.5% for AGIs below $10k, 0.1% for AGIs $10k-25k, 0.1% for AGIs $25k-50k, 0.3% for AGIs $50k-75k, 0.3% for AGIs $75k-100k, 1.2% for AGIs over 100k)
Net capital gain/loss: +$6,395 (reported on 3.9% of returns)
Here:
+$6,395
State:
+$23,418
(% of AGI for various income ranges: -0.3% for AGIs below $10k, -0.0% for AGIs $10k-25k, 0.0% for AGIs $25k-50k, 0.2% for AGIs $50k-75k, 0.4% for AGIs $75k-100k, 7.2% for AGIs over 100k)
Profit/loss from business: +$7,602 (reported on 9.2% of returns)
Here:
+$7,602
State:
+$16,826
(% of AGI for various income ranges: 4.3% for AGIs below $10k, 3.7% for AGIs $10k-25k, 2.3% for AGIs $25k-50k, 1.4% for AGIs $50k-75k, 1.7% for AGIs $75k-100k, 1.3% for AGIs over 100k)
Profit/loss from farming: +$19,593 (reported on 0.1% of returns)
Here:
+$19,593
State:
-$7,562
IRA payment deduction: $2,726 (reported on 1.0% of returns)
93033:
$2,726
California:
$3,192
(% of AGI for various income ranges: 0.1% for AGIs below $10k, 0.0% for AGIs $10k-25k, 0.1% for AGIs $25k-50k, 0.1% for AGIs $50k-75k, 0.1% for AGIs $75k-100k, 0.1% for AGIs over 100k)
Self-employed pension: $4,867 (reported on 0.1% of returns)
Here:
$4,867
California:
$17,688
Total itemized deductions: $20,099 (35% of AGI, reported on 23.8% of returns)
Here:
$20,099
State:
$28,113
Here:
35.4% of AGI
State:
25.3% of AGI
(% of AGI for various income ranges: 7.7% for AGIs below $10k, 6.6% for AGIs $10k-25k, 15.7% for AGIs $25k-50k, 20.2% for AGIs $50k-75k, 21.2% for AGIs $75k-100k, 21.9% for AGIs over 100k)
Charity contributions deductions: $1,970 (3% of AGI, reported on 20.3% of returns)
Here:
$1,970
State:
$3,923
Here:
3.3% of AGI
State:
3.3% of AGI
(% of AGI for various income ranges: 0.2% for AGIs below $10k, 0.4% for AGIs $10k-25k, 1.0% for AGIs $25k-50k, 1.7% for AGIs $50k-75k, 2.1% for AGIs $75k-100k, 3.0% for AGIs over 100k)
Total tax: $3,183 (reported on 56.0% of returns)
93033:
$3,183
State:
$10,761
(% of AGI for various income ranges: 2.2% for AGIs below $10k, 2.5% for AGIs $10k-25k, 4.2% for AGIs $25k-50k, 6.4% for AGIs $50k-75k, 8.7% for AGIs $75k-100k, 15.2% for AGIs over 100k)
Earned income credit: $1,903 (reported on 25.7% of returns)
Here:
$1,903
State:
$1,763
Percentage of individuals using paid preparers for their 2004 taxes: 79.3%
Here:
79%
State:
66%
(% for various income ranges: 72.4% for AGIs below $10k, 82.5% for AGIs $10k-25k, 80.3% for AGIs $25k-50k, 78.5% for AGIs $50k-75k, 71.7% for AGIs $75k-100k, 75.6% for AGIs over 100k)
Likely homosexual households (counted as self-reported same-sex unmarried-partner households)
Lesbian couples: 0.0% of all households
Gay men: 0.1% of all households
Household received Food Stamps/SNAP in the past 12 months: 3,549 Household did not receive Food Stamps/SNAP in the past 12 months: 13,888
Women who had a birth in the past 12 months: 917 (503 now married, 417 unmarried) Women who did not have a birth in the past 12 months: 19,991 (7,105 now married, 12,920 unmarried)
Housing units in zip code 93033 with a mortgage: 5,955 (283 second mortgage, 220 both second mortgage and home equity loan) Houses without a mortgage: 53
Median monthly owner costs for units with a mortgage: $2,234 Median monthly owner costs for units without a mortgage: $582
Residents with income below the poverty level in 2022:
This zip code:
12.6%
Whole state:
12.2%
Residents with income below 50% of the poverty level in 2022:
This zip code:
7.9%
Whole state:
6.2%
Median number of rooms in houses and condos:
Here:
5.8
State:
6.0
Median number of rooms in apartments:
Here:
4.3
State:
3.9
Notable locations in this zip code not listed on our city pages
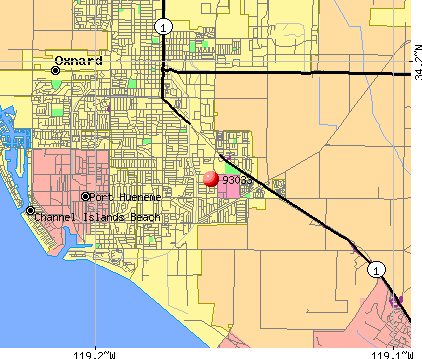
Shopping Centers: College Park Shopping Center (1), Centerpoint Mall Shopping Center (2), Pleasant Valley Shopping Center (3), Hueneme Bay Shopping Center (4). Display/hide their locations on the map
Churches in zip code 93033 include: Oxnard First Assembly of God Church (A), Assembly of God Evangelistic Center (B), Calvary Baptist Church (C), Church at the Crossroads Baptist Church (D), Community Bible Mission (E), Garden City Acres Church (F), Iglesia del Nazareno (G), Kingdom Hall of Jehovahs Witnesses (H), Korean United Methodist Church (I). Display/hide their locations on the map
Parks in zip code 93033 include: Johnson Creek Park (1), Pleasant Valley Park (2), Southwinds Park (3), Beck Park (4), College Estates Park (5), Durley Park (6), Elm Park (7), Petit Park (8). Display/hide their locations on the map
11,175 married couples with children.
5,132 single-parent households (1,683 men, 3,449 women).
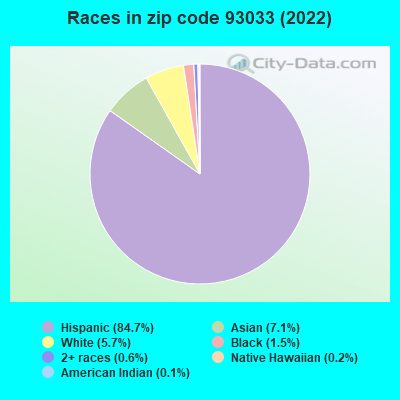
21.4% of residents of 93033 zip code speak English at home.
69.8% of residents speak Spanish at home (52% very well, 12% well, 19% not well, 17% not at all).
0.3% of residents speak other Indo-European language at home (76% very well, 7% well, 3% not well, 14% not at all).
5.8% of residents speak Asian or Pacific Island language at home (54% very well, 33% well, 11% not well, 3% not at all).
2.9% of residents speak other language at home (33% very well, 1% well, 7% not well, 58% not at all).
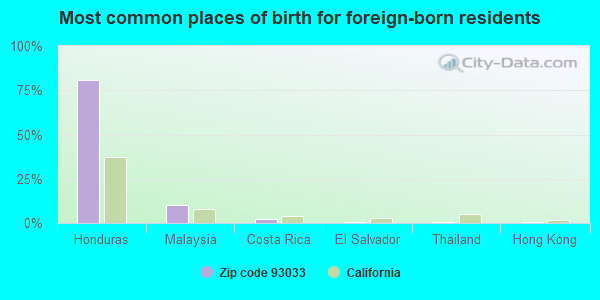
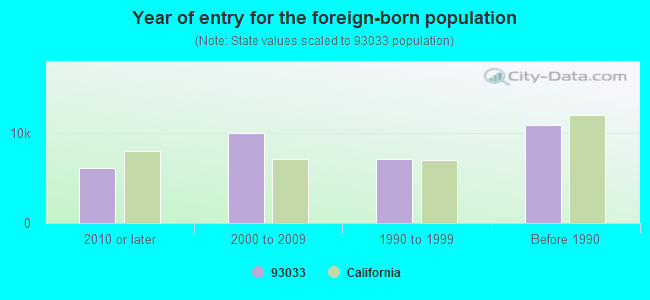
Foreign born population: 33,009 (40.3%) (40.0% of them are naturalized citizens)
Major facilities with environmental interests located in this zip code:
KAISER ALUMINUM & CHEMICAL CORPORATION (1001 MCWANE BOULEVARD in OXNARD, CA)
STATE MASTER (California - Hazardous Waste Tracking) - HAZARDOU WASTE PROGRAM (Integrated Compliance Information System) - ICIS-09-2001-0038, FORMAL ENFORCEMENT ACTION COMPLIANCE ACTIVITY (Tracking inspections of insecticide, fungicide, and rodenticide, and toxic substances) CRITERIA AND HAZARDOUS AIR POLLUTANT INVENTORY (Inventory of air pollution sources) Large Quantity Generators, more that 1000 kg of hazardous waste/month (Resource Conservation and Recovery Act (tracking hazardous waste)) TRI REPORTER (Tracking of toxic chemicals releasing facilities) Business SIC classification: NONFERROUS FORGINGS Business NAICS classification: NONFERROUS FORGING. Organizations: ALUMINUM PRECISION PRODUCTS INC (CONTACT/OPERATOR)
Alternative names: ALUMINUM PRECISION PRODS. INC., KAISER ALUMINUM & CHEMICAL#
AQUATRONICS INC (1620 BEACON PLACE in OXNARD, CA)
(Integrated Compliance Information System) - ICIS-09-2000-0405, FORMAL ENFORCEMENT ACTION, ICIS-09-2002-0122, ICIS-09-2003-0138, COMPLIANCE ACTIVITY (Tracking inspections of insecticide, fungicide, and rodenticide, and toxic substances) STATE MASTER (New Jersey environmental info) - NJEMS-001700, PESTICIDES - MANUFACTURE Business SIC classification: INDUSTRIAL ORGANIC CHEMICALS; PLASTICS PRODUCTS; NONDURABLE GOODS Alternative names: UNIVERSAL SYSTEMS INC
HALACO ENGINEERING INCORPORATED (6200 PERKINS RD. in OXNARD, CA)
SUPERFUND (Superfund database) (Integrated Compliance Information System) - ICIS-09-1995-0042, FORMAL ENFORCEMENT ACTION, ICIS-09-1980-0016, COMPLIANCE ACTIVITY (Tracking inspections of insecticide, fungicide, and rodenticide, and toxic substances) CRITERIA AND HAZARDOUS AIR POLLUTANT INVENTORY (Inventory of air pollution sources) TRI REPORTER (Tracking of toxic chemicals releasing facilities) Business SIC classification: SECONDARY SMELTING AND REFINING OF NONFERROUS METALS; ALUMINUM FOUNDRIES; NONFERROUS FOUNDRIES, EXCEPT ALUMINUM AND COPPER; REFUSE SYSTEMS Business NAICS classification: SOLID WASTE LANDFILL. Alternative names: HALACO ENGINEERING CO
CHANNEL ISLANDS HIGH SCHOOL (1400 RAIDERS WAY in OXNARD, CA)
(National Center for Education Statistics) - STATE ID-5631742 Large Quantity Generators, more that 1000 kg of hazardous waste/month (Resource Conservation and Recovery Act (tracking hazardous waste)) - notification Organizations: OXNARD UNION H S DISTRICT (CONTACT/OWNER)
, OXNARD UNION HIGH (SCHOOL DISTRICT)
CHEVRON STATION NO 92991 (2901 SAVIERS RD in OXNARD, CA)
STATE MASTER (California - Hazardous Waste Tracking) - HAZARDOU WASTE PROGRAM CRITERIA AND HAZARDOUS AIR POLLUTANT INVENTORY (Inventory of air pollution sources) Small Quantity Generators, between 100 kg and 1000 kg of hazardous waste/month (Resource Conservation and Recovery Act (tracking hazardous waste)) - notification Business SIC classification: GASOLINE SERVICE STATIONS Organizations: CHEVRON PRODUCTS CO (CONTACT/OWNER)
HONDO SPARE PARTS WAREHOUSE (5901 ARCTURAS RD in OXNARD, CA)
STATE MASTER (California - Hazardous Waste Tracking) - HAZARDOU WASTE PROGRAM Small Quantity Generators, between 100 kg and 1000 kg of hazardous waste/month (Resource Conservation and Recovery Act (tracking hazardous waste)) - notification Organizations: OFFSHORE FACILITIES (CONTACT/OWNER)
Alternative names: EXXON MOBIL PRDCTN CO PORT HUENEME PARTS
CHEVRON STATION NO 208020 (1900 ROSE AVE in OXNARD, CA)
STATE MASTER (California - Hazardous Waste Tracking) - HAZARDOU WASTE PROGRAM Small Quantity Generators, between 100 kg and 1000 kg of hazardous waste/month (Resource Conservation and Recovery Act (tracking hazardous waste)) - notification Organizations: CHEVRON PRODUCTS CO (CONTACT/OWNER)
CATALYTIC SOLUTIONS INC (1700 FISKE PL in OXNARD, CA)
STATE MASTER (California - Hazardous Waste Tracking) - HAZARDOU WASTE PROGRAM Small Quantity Generators, between 100 kg and 1000 kg of hazardous waste/month (Resource Conservation and Recovery Act (tracking hazardous waste)) - notification
GREEN (E. O.) JUNIOR HIGH (3739 S. C ST. in OXNARD, CA)
(National Center for Education Statistics) - STATE ID-6055040 Organizations: HUENEME ELEMENTARY (SCHOOL DISTRICT)
HARRINGTON ELEMENTARY (2501 S. GISLER AVE. in OXNARD, CA)
(National Center for Education Statistics) - STATE ID-6055297 Organizations: OXNARD ELEMENTARY (SCHOOL DISTRICT)
HATHAWAY (JULIEN) ELEMENTARY (405 E. DOLLIE ST. in OXNARD, CA)
(National Center for Education Statistics) - STATE ID-6055081 Organizations: HUENEME ELEMENTARY (SCHOOL DISTRICT)
HAYCOX (ART) ELEMENTARY (5400 PERKINS ROAD in OXNARD, CA)
(National Center for Education Statistics) - STATE ID-6055024 Organizations: HUENEME ELEMENTARY (SCHOOL DISTRICT)
HAYDOCK (RICHARD B.) INTERMEDIATE (647 WEST HILL ST in OXNARD, CA)
(National Center for Education Statistics) - STATE ID-6055305 Organizations: OXNARD ELEMENTARY (SCHOOL DISTRICT)
Housing units lacking complete plumbing facilities: 0.1% Housing units lacking complete kitchen facilities: 1.8%
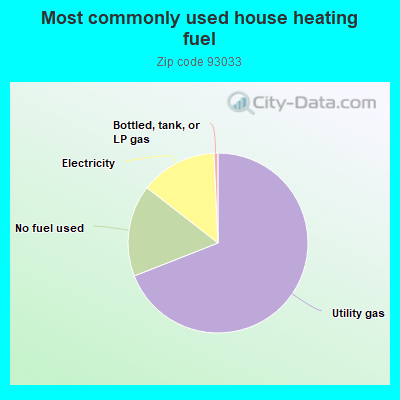
68.7%Utility gas
16.4%No fuel used
13.7%Electricity
0.7%Bottled, tank, or LP gas
Population in 1990: 66,043. Population change in the 1990s: +11,742 (+17.8%).
Place of birth for U.S.-born residents:
This state: 44,545
Northeast: 553
Midwest: 834
South: 1,265
West: 738
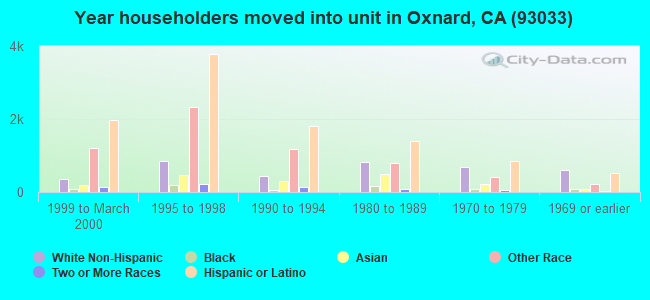
58% of the 93033 zip code residents lived in the same house 5 years ago. Out of people who lived in different houses, 85% lived in this county. Out of people who lived in different counties, 50% lived in California.
96% of the 93033 zip code residents lived in the same house 1 year ago. Out of people who lived in different houses, 80% moved from this county. Out of people who lived in different houses, 21% moved from different county within same state. Out of people who lived in different houses, 2% moved from different state. Out of people who lived in different houses, 4% moved from abroad.
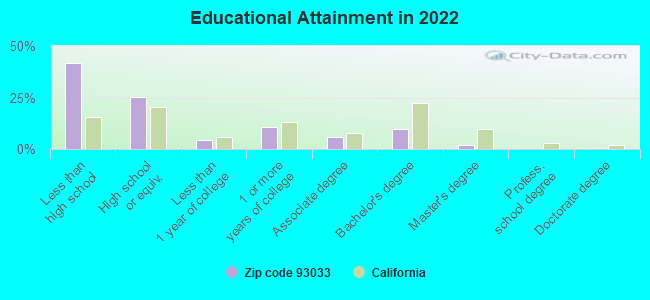
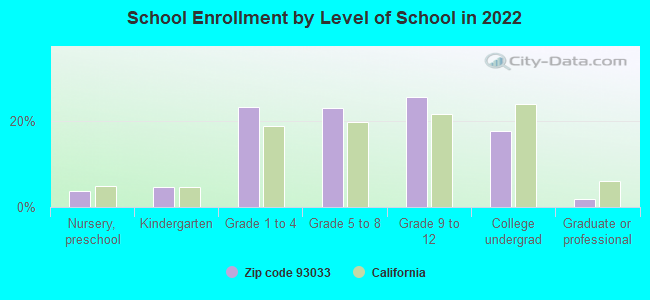
Private vs. public school enrollment:
Students in private schools in grades 1 to 8 (elementary and middle school): 120
Here:
1.1%
California:
10.5%
Students in private schools in grades 9 to 12 (high school): 86
Here:
1.5%
California:
8.5%
Students in private undergraduate colleges: 262
Here:
6.5%
California:
15.9%
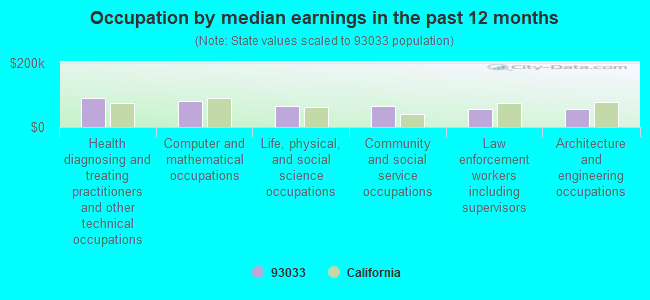
Occupation by median earnings in the past 12 months ($)
91,089Health diagnosing and treating practitioners and other technical occupations
82,179Computer and mathematical occupations
66,525Life, physical, and social science occupations
65,359Community and social service occupations
56,867Law enforcement workers including supervisors
56,370Architecture and engineering occupations
Companies with biggest federal contracts located in this zip code (OXNARD, CA):
SYSTEMS APPLICATION & TECHNOLO (2230 STATHAM BLVD , SUITE; small business) : $97,206,323 in 613 contractsfrom 1999 to 2006
Contracts for Maintenance, Repair and Rebuilding of Equipment -- Communication, Detection, and Coherent Radiation Equipment, Simulation, Data Collection Services, Program Evaluation Services, and moreby Navy, Office of Personnel Management, Army, NASA, and others Signed by year:2000: $6,812,285; 2001: $13,626,448; 2002: $12,001,453; 2003: $15,420,536; 2004: $15,963,970; 2005: $22,847,859; 2006: $7,936,541.
Biggest contracts:
$8,832,783 with Navy for Maintenance, Repair and Rebuilding of Equipment -- Communication, Detection, and Coherent Radiation Equipment. Signed on 2001-09-29. Completion date: 2004-09-30.
$4,474,351 with Navy for Simulation. Signed on 2005-10-01. Completion date: 2006-09-30.
$1,962,228, same as above.Signed on 2005-02-09. Completion date: 2005-01-31.
$1,614,000 with Office of Personnel Management for Data Collection Services. Taking place in MD. Signed on 2005-04-25. Completion date: 2005-09-30.
SAALEX CORPORATION (1721 PACIFIC AVE STE 180; small business) : $3,844,313 in 43 contractsfrom 2005 to 2006
Contracts for Engineering and Technical Services, Radar Equipment, Except Airborne by Navy, Army Signed by year:2000: $0; 2001: $0; 2002: $0; 2003: $0; 2004: $0; 2005: $2,290,666; 2006: $1,553,647.
Biggest contracts:
$400,000 with Navy for Engineering and Technical Services. Signed on 2005-04-01. Completion date: 2006-02-22.
$349,719, same as above.Signed on 2005-05-25. Completion date: 2006-02-22.
$200,000, same as above.Signed on 2006-04-27. Completion date: 2006-09-13.
$198,700, same as above.Signed on 2006-02-14. Completion date: 2006-02-22.
DAVILYN CORPORATION (1300 PACIFIC AVE; small business) : $2,563,677 in 157 contractsfrom 2000 to 2006
Contracts for Shipboard Alarm and Signal Systems, Converters, Electrical, Nonrotating, Miscellaneous Alarm, Signal and Security Detection Systems, Relays and Solenoids, and moreby Navy, Defense Logistics Agency, Army, Air Force, and others Signed by year:2000: $247,664; 2001: $480,644; 2002: $338,828; 2003: $184,056; 2004: $477,586; 2005: $618,802; 2006: $216,097.
Biggest contracts:
$90,000 with Navy for Shipboard Alarm and Signal Systems. Signed on 2005-01-13. Completion date: 2005-03-16.
$76,800 with Defense Logistics Agency for Converters, Electrical, Nonrotating. Signed on 2004-05-13. Completion date: 2004-06-02.
$75,000 with Defense Logistics Agency for Miscellaneous Alarm, Signal and Security Detection Systems. Signed on 2003-10-08. Completion date: 2003-11-13.
$70,000 with Defense Logistics Agency for Relays and Solenoids. Signed on 2004-01-28. Completion date: 2004-09-28.
H E JULIEN AND ASSOCIATES, IN (710 W HUENEME ROAD; small business) : $2,521,611 in 19 contractsfrom 1999 to 2002
Contracts for Landscaping/Groundskeeping Services by Navy Signed by year:2000: $871,505; 2001: $640,130; 2002: $40,971; 2003: $0; 2004: $0; 2005: $0; 2006: $0.
Biggest contracts:
$969,005 with Navy for Landscaping/Groundskeeping Services. Signed on 1999-10-01. Completion date: 2003-07-31.
$496,352, same as above.Signed on 2000-08-01. Completion date: 2003-07-31.
$271,080, same as above.Signed on 2000-12-04. Completion date: 2002-07-31.
$259,906, same as above.Signed on 2001-07-31. Completion date: 2003-07-31.
DELTA MICROWAVE, INC (1301 VANGUARD DR; small business) : $1,223,320 in 24 contractsfrom 2000 to 2006
Contracts for Antennas, Waveguides, and Related Equipment, Filters and Networks, Electrical and Electronic assemblies, Boards, Cards, and Associated Hardware, Radio and Television Communication Equipment, Except Airborne, and moreby Navy, Defense Logistics Agency, Air Force Signed by year:2000: $325,124; 2001: $0; 2002: $150,135; 2003: $113,689; 2004: $440,960; 2005: $145,070; 2006: $48,342.
Biggest contracts:
$171,380 with Navy for Antennas, Waveguides, and Related Equipment. Signed on 2000-03-09. Completion date: 2001-02-02.
$99,905 with Navy for Filters and Networks. Signed on 2004-03-22. Completion date: 2004-07-30.
$98,400 with Navy for Electrical and Electronic assemblies, Boards, Cards, and Associated Hardware. Signed on 2004-11-13. Completion date: 2004-12-31.
$98,400 with Navy for Radio and Television Communication Equipment, Except Airborne. Signed on 2004-09-09. Completion date: 2004-12-30.
CHANNEL ISLANDS MOTEL (1001 E CHANNEL ISLNDS BLVD; small business) : $1,123,540 in 47 contractsfrom 2003 to 2006
Contracts for Lodging - Hotel/Motel by Army Signed by year:2000: $0; 2001: $0; 2002: $0; 2003: $485,760; 2004: $634,480; 2005: $900; 2006: $2,400.
Biggest contracts:
$30,940 with Army for Lodging - Hotel/Motel. Signed on 2004-11-12. Completion date: 2004-10-15.
$29,480, same as above.Signed on 2004-03-30. Completion date: 2004-02-07.
$29,120, same as above.Signed on 2004-05-01. Completion date: 2004-03-26.
$29,120, same as above.Signed on 2004-09-12. Completion date: 2004-08-17.
RM JANITORIAL, INC (540 N LINDEN DR; small business) : $696,770 in 23 contractsfrom 2001 to 2006
Contracts for Custodial Janitorial Services by Army Signed by year:2000: $0; 2001: $1,440; 2002: $101,327; 2003: $162,361; 2004: $192,026; 2005: $240,146; 2006: -$530.
Biggest contracts:
$206,821 with Army for Custodial Janitorial Services. Signed on 2005-07-11. Completion date: 2008-08-14.
$164,450, same as above.Signed on 2004-07-21. Completion date: 2008-08-14.
$76,526, same as above.Signed on 2003-03-13. Completion date: 2003-03-24.
$51,481, same as above.Signed on 2002-09-28. Completion date: 2002-09-05.
ASTROLITE ALLOYS (1201 VANGUARD DRIVE; small business) : $522,983 in 23 contractsfrom 2000 to 2005
Contracts for Miscellaneous Welding, Soldering, and Brazing Supplies and Accessories, by Defense Logistics Agency, NASA, Air Force, Navy, and others Signed by year:2000: $154,304; 2001: $275,188; 2002: $0; 2003: $0; 2004: $64,519; 2005: $28,972; 2006: $0.
Biggest contracts:
$249,373 with Defense Logistics Agency for Miscellaneous Welding, Soldering, and Brazing Supplies and Accessories. Signed on 2001-02-16. Completion date: 2001-03-18.
$48,533, same as above.Signed on 2000-07-18. Completion date: 2000-11-05.
$42,560, same as above.Signed on 2000-08-06. Completion date: 2000-10-06.
$34,709, same as above.Signed on 2000-05-17. Completion date: 2000-08-29.
AMERICAN AIRFRAME, INC (1201 VANGUARD DRIVE; small business) : $486,921 in 14 contractsfrom 2001 to 2006
Contracts for Maintenance, Repair and Rebuilding of Equipment -- Aircraft Components and Accessories, Airframe Structural Components, Aircraft Landing Gear Components, Hardware, Weapon System by United States Coast Guard (disused code: now 7008), Defense Logistics Agency Signed by year:2000: $0; 2001: $449,496; 2002: $0; 2003: $0; 2004: $18,337; 2005: $11,956; 2006: $7,132.
Biggest contracts:
$87,000 with United States Coast Guard (disused code: now 7008) for Maintenance, Repair and Rebuilding of Equipment -- Aircraft Components and Accessories. Signed on 2001-09-15. Completion date: 2002-02-15.
$80,841 with Defense Logistics Agency for Airframe Structural Components. Signed on 2001-10-30. Completion date: 2002-12-04.
$55,215, same as above.Signed on 2001-07-26. Completion date: 2002-07-31.
$52,220, same as above.Signed on 2001-05-08. Completion date: 2002-01-13.
COUNTY EQUIPMENT SERVICES (4910 S G ST; small business) : $376,192 in 8 contractsfrom 2002 to 2006
Contracts for Generators and Generators Sets, Electrical, Maintenance, Repair or Alteration of Real Property -- Other Utilities, Other ADP and Telecommunications Services (includes data storage on tapes, compact disks, etc.), Compressors and Vacuum Pumps, and moreby U.S. Army Corps of Engineers - civil program financing only, Navy, Army, Defense Information Systems Agency, and others Signed by year:2000: $0; 2001: $0; 2002: $50,000; 2003: $198,547; 2004: $7,220; 2005: $19,963; 2006: $100,462.
Biggest contracts:
$93,968 with U.S. Army Corps of Engineers - civil program financing only for Generators and Generators Sets, Electrical. Signed on 2003-01-14. Completion date: 2003-04-26.
$92,468, same as above.Signed on 2003-03-25. Completion date: 2002-12-24.
$61,675 with Navy for Maintenance, Repair or Alteration of Real Property -- Other Utilities. Signed on 2006-04-28. Completion date: 2006-08-30.
$50,000 with U.S. Army Corps of Engineers - civil program financing only for Generators and Generators Sets, Electrical. Signed on 2002-09-26. Completion date: 2002-12-24.
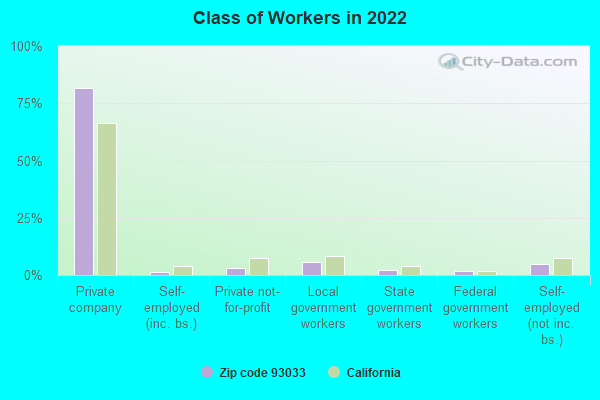
Top industries in this zip code by the number of employees in 2005:
Professional, Scientific, and Technical Services: Research and Development in the Physical, Engineering, and Life Sciences (100-249: 1, 10-19: 1, 1-4: 2)
Other Services (except Public Administration): All Other Automotive Repair and Maintenance (100-249: 1, 1-4: 1)
Wholesale Trade: Electrical and Electronic Appliance, Television, and Radio Set Merchant Wholesalers (100-249: 1, 1-4: 1)
People in group quarters in 2010:
288 people in nursing facilities/skilled-nursing facilities
283 people in group homes intended for adults
34 people in workers' group living quarters and job corps centers
26 people in residential treatment centers for adults
26 people in other noninstitutional facilities
4 people in group homes for juveniles (non-correctional)
People in group quarters in 2000:
379 people in other group homes
344 people in other noninstitutional group quarters
272 people in homes for the mentally retarded
99 people in nursing homes
95 people in homes for the mentally ill
29 people in religious group quarters
28 people in homes or halfway houses for drug/alcohol abuse
26 people in agriculture workers' dormitories on farms
10 people in residential treatment centers for emotionally disturbed children
8 people in other nonhousehold living situations
Fatal accident statistics in 2014:
Fatal accident count: 3
Vehicles involved in fatal accidents: 4
Fatal accidents caused by drunken drivers: 3
Fatalities: 3
Persons involved in fatal accidents: 9
Pedestrians involved in fatal accidents: 1
Fatal accident statistics in 2013:
Fatal accident count: 7
Vehicles involved in fatal accidents: 11
Fatal accidents caused by drunken drivers: 1
Fatalities: 8
Persons involved in fatal accidents: 19
Pedestrians involved in fatal accidents: 3
Home Mortgage Disclosure Act Aggregated Statistics For Year 2009 (Based on 17 full and 8 partial tracts)
A) FHA, FSA/RHS & VA Home Purchase Loans
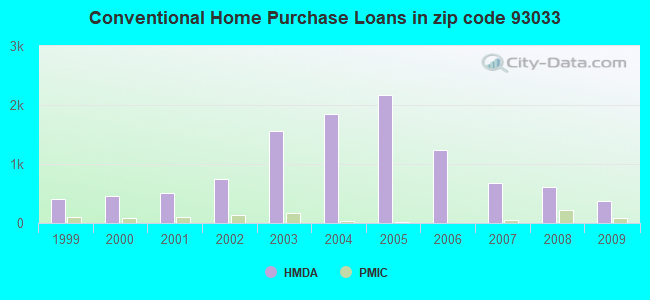
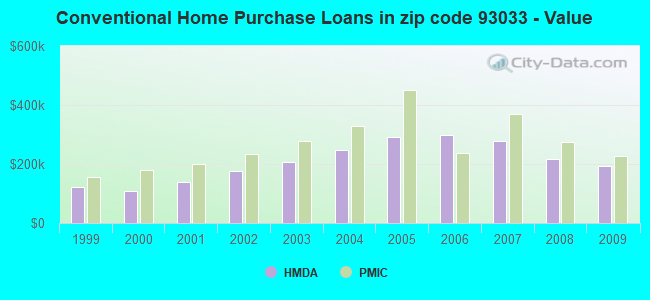
B) Conventional Home Purchase Loans
C) Refinancings
D) Home Improvement Loans
E) Loans on Dwellings For 5+ Families
F) Non-occupant Loans on < 5 Family Dwellings (A B C & D)
G) Loans On Manufactured Home Dwelling (A B C & D)
Number
Average Value
Number
Average Value
Number
Average Value
Number
Average Value
Number
Average Value
Number
Average Value
Number
Average Value
LOANS ORIGINATED
593
$241,650
376
$192,486
627
$224,365
32
$159,424
4
$475,452
186
$186,720
16
$76,362
APPLICATIONS APPROVED, NOT ACCEPTED
63
$244,382
56
$204,376
87
$215,542
3
$81,303
0
$0
25
$203,020
5
$58,170
APPLICATIONS DENIED
163
$243,388
139
$173,921
330
$235,586
34
$118,912
0
$0
79
$191,705
49
$61,647
APPLICATIONS WITHDRAWN
116
$238,105
75
$198,655
197
$252,878
13
$104,849
0
$0
51
$206,032
4
$49,502
FILES CLOSED FOR INCOMPLETENESS
31
$220,570
25
$185,356
55
$231,083
2
$410,665
0
$0
8
$130,060
5
$51,942
Aggregated Statistics For Year 2008 (Based on 17 full and 8 partial tracts)
A) FHA, FSA/RHS & VA Home Purchase Loans
B) Conventional Home Purchase Loans
C) Refinancings
D) Home Improvement Loans
E) Loans on Dwellings For 5+ Families
F) Non-occupant Loans on < 5 Family Dwellings (A B C & D)
G) Loans On Manufactured Home Dwelling (A B C & D)
Number
Average Value
Number
Average Value
Number
Average Value
Number
Average Value
Number
Average Value
Number
Average Value
Number
Average Value
LOANS ORIGINATED
314
$258,849
606
$215,554
469
$232,913
70
$130,024
4
$1,530,230
155
$193,781
51
$64,477
APPLICATIONS APPROVED, NOT ACCEPTED
35
$259,158
114
$211,418
125
$272,731
10
$175,032
2
$494,900
36
$239,729
26
$82,886
APPLICATIONS DENIED
106
$267,976
330
$250,147
653
$304,401
116
$143,469
9
$825,996
99
$268,594
52
$84,680
APPLICATIONS WITHDRAWN
87
$252,063
165
$222,590
210
$281,366
30
$182,223
0
$0
61
$216,693
9
$75,423
FILES CLOSED FOR INCOMPLETENESS
16
$294,559
34
$308,220
78
$297,256
12
$174,129
0
$0
12
$245,280
1
$38,000
Aggregated Statistics For Year 2007 (Based on 17 full and 8 partial tracts)
A) FHA, FSA/RHS & VA Home Purchase Loans
B) Conventional Home Purchase Loans
C) Refinancings
D) Home Improvement Loans
E) Loans on Dwellings For 5+ Families
F) Non-occupant Loans on < 5 Family Dwellings (A B C & D)
G) Loans On Manufactured Home Dwelling (A B C & D)
Number
Average Value
Number
Average Value
Number
Average Value
Number
Average Value
Number
Average Value
Number
Average Value
Number
Average Value
LOANS ORIGINATED
2
$176,050
682
$279,047
1,884
$316,607
254
$189,680
26
$1,898,075
270
$321,712
110
$74,920
APPLICATIONS APPROVED, NOT ACCEPTED
1
$197,880
225
$266,700
604
$321,598
68
$196,348
0
$0
76
$336,449
30
$85,806
APPLICATIONS DENIED
3
$298,393
581
$297,102
1,677
$361,019
203
$212,650
6
$830,098
168
$353,375
80
$81,249
APPLICATIONS WITHDRAWN
0
$0
156
$321,104
633
$361,406
52
$219,169
4
$942,380
59
$333,934
9
$79,372
FILES CLOSED FOR INCOMPLETENESS
0
$0
45
$348,187
216
$377,523
32
$273,508
0
$0
34
$343,649
4
$84,502
Aggregated Statistics For Year 2006 (Based on 17 full and 8 partial tracts)
A) FHA, FSA/RHS & VA Home Purchase Loans
B) Conventional Home Purchase Loans
C) Refinancings
D) Home Improvement Loans
E) Loans on Dwellings For 5+ Families
F) Non-occupant Loans on < 5 Family Dwellings (A B C & D)
G) Loans On Manufactured Home Dwelling (A B C & D)
Number
Average Value
Number
Average Value
Number
Average Value
Number
Average Value
Number
Average Value
Number
Average Value
Number
Average Value
LOANS ORIGINATED
1
$138,350
1,244
$297,996
2,941
$323,641
485
$230,878
20
$1,304,819
320
$339,758
108
$79,800
APPLICATIONS APPROVED, NOT ACCEPTED
0
$0
281
$270,488
733
$335,427
66
$247,103
2
$1,224,630
64
$368,135
47
$83,465
APPLICATIONS DENIED
1
$83,920
685
$301,362
1,573
$351,235
286
$217,514
0
$0
139
$394,989
99
$101,143
APPLICATIONS WITHDRAWN
0
$0
429
$309,456
1,206
$348,312
128
$222,672
2
$53,450
82
$380,608
27
$80,663
FILES CLOSED FOR INCOMPLETENESS
0
$0
37
$241,486
278
$361,333
20
$251,505
0
$0
20
$319,476
10
$111,265
Aggregated Statistics For Year 2005 (Based on 17 full and 8 partial tracts)
A) FHA, FSA/RHS & VA Home Purchase Loans
B) Conventional Home Purchase Loans
C) Refinancings
D) Home Improvement Loans
E) Loans on Dwellings For 5+ Families
F) Non-occupant Loans on < 5 Family Dwellings (A B C & D)
G) Loans On Manufactured Home Dwelling (A B C & D)
Number
Average Value
Number
Average Value
Number
Average Value
Number
Average Value
Number
Average Value
Number
Average Value
Number
Average Value
LOANS ORIGINATED
3
$277,010
2,171
$292,285
3,480
$298,888
503
$235,221
28
$1,766,692
466
$339,904
111
$79,127
APPLICATIONS APPROVED, NOT ACCEPTED
0
$0
435
$264,144
609
$292,038
86
$183,823
2
$399,960
59
$250,008
33
$98,897
APPLICATIONS DENIED
1
$286,000
697
$290,561
1,413
$317,457
299
$192,010
3
$287,100
170
$386,936
77
$82,235
APPLICATIONS WITHDRAWN
1
$216,000
493
$281,390
1,253
$293,548
168
$231,190
9
$679,673
87
$291,009
49
$99,751
FILES CLOSED FOR INCOMPLETENESS
0
$0
78
$320,004
496
$300,360
17
$228,955
0
$0
10
$304,593
2
$48,165
Aggregated Statistics For Year 2004 (Based on 17 full and 8 partial tracts)
A) FHA, FSA/RHS & VA Home Purchase Loans
B) Conventional Home Purchase Loans
C) Refinancings
D) Home Improvement Loans
E) Loans on Dwellings For 5+ Families
F) Non-occupant Loans on < 5 Family Dwellings (A B C & D)
G) Loans On Manufactured Home Dwelling (A B C & D)
Number
Average Value
Number
Average Value
Number
Average Value
Number
Average Value
Number
Average Value
Number
Average Value
Number
Average Value
LOANS ORIGINATED
11
$245,854
1,850
$246,994
3,853
$245,181
503
$183,663
46
$1,275,192
414
$240,486
117
$65,604
APPLICATIONS APPROVED, NOT ACCEPTED
4
$204,322
294
$243,302
741
$237,834
84
$157,893
0
$0
47
$233,379
34
$63,801
APPLICATIONS DENIED
3
$260,440
510
$240,096
1,349
$240,301
316
$122,529
1
$485,000
97
$240,602
58
$72,566
APPLICATIONS WITHDRAWN
8
$240,915
390
$231,738
1,315
$231,553
180
$130,117
2
$328,840
105
$214,519
56
$71,869
FILES CLOSED FOR INCOMPLETENESS
0
$0
61
$237,001
374
$256,709
21
$111,922
0
$0
16
$259,011
9
$62,014
Aggregated Statistics For Year 2003 (Based on 17 full and 8 partial tracts)
A) FHA, FSA/RHS & VA Home Purchase Loans
B) Conventional Home Purchase Loans
C) Refinancings
D) Home Improvement Loans
E) Loans on Dwellings For 5+ Families
F) Non-occupant Loans on < 5 Family Dwellings (A B C & D)
Number
Average Value
Number
Average Value
Number
Average Value
Number
Average Value
Number
Average Value
Number
Average Value
LOANS ORIGINATED
79
$184,539
1,560
$205,976
5,507
$182,579
125
$51,488
33
$1,107,509
556
$180,213
APPLICATIONS APPROVED, NOT ACCEPTED
6
$194,780
312
$211,798
832
$187,687
49
$49,417
2
$450,360
93
$190,046
APPLICATIONS DENIED
7
$208,366
447
$180,097
1,361
$185,186
123
$51,114
3
$381,973
109
$194,111
APPLICATIONS WITHDRAWN
7
$214,389
278
$188,450
1,385
$190,231
68
$48,429
2
$6,997,900
68
$171,544
FILES CLOSED FOR INCOMPLETENESS
0
$0
54
$218,730
221
$192,431
6
$33,990
0
$0
14
$219,904
Aggregated Statistics For Year 2002 (Based on 9 full and 4 partial tracts)
A) FHA, FSA/RHS & VA Home Purchase Loans
B) Conventional Home Purchase Loans
C) Refinancings
D) Home Improvement Loans
E) Loans on Dwellings For 5+ Families
F) Non-occupant Loans on < 5 Family Dwellings (A B C & D)
Number
Average Value
Number
Average Value
Number
Average Value
Number
Average Value
Number
Average Value
Number
Average Value
LOANS ORIGINATED
171
$184,185
746
$176,862
2,160
$164,101
102
$37,668
37
$792,979
189
$163,867
APPLICATIONS APPROVED, NOT ACCEPTED
10
$197,541
70
$175,223
356
$159,790
18
$37,342
0
$0
27
$159,162
APPLICATIONS DENIED
17
$180,154
192
$141,230
615
$154,119
105
$23,817
4
$1,184,295
48
$161,252
APPLICATIONS WITHDRAWN
28
$173,410
131
$163,231
615
$168,799
53
$34,022
0
$0
37
$162,722
FILES CLOSED FOR INCOMPLETENESS
2
$174,425
33
$194,215
128
$150,567
0
$0
0
$0
12
$146,012
Aggregated Statistics For Year 2001 (Based on 9 full and 4 partial tracts)
A) FHA, FSA/RHS & VA Home Purchase Loans
B) Conventional Home Purchase Loans
C) Refinancings
D) Home Improvement Loans
E) Loans on Dwellings For 5+ Families
F) Non-occupant Loans on < 5 Family Dwellings (A B C & D)
Number
Average Value
Number
Average Value
Number
Average Value
Number
Average Value
Number
Average Value
Number
Average Value
LOANS ORIGINATED
237
$176,519
514
$140,236
1,569
$148,339
104
$36,678
34
$983,355
198
$149,170
APPLICATIONS APPROVED, NOT ACCEPTED
8
$190,942
56
$146,193
292
$149,167
15
$29,001
0
$0
24
$157,967
APPLICATIONS DENIED
15
$170,358
164
$112,706
608
$132,812
125
$24,522
5
$2,146,036
43
$124,759
APPLICATIONS WITHDRAWN
47
$211,581
81
$112,233
625
$148,317
41
$31,803
4
$296,940
36
$153,116
FILES CLOSED FOR INCOMPLETENESS
8
$174,790
17
$123,674
120
$149,839
3
$77,290
7
$1,735,480
14
$143,426
Aggregated Statistics For Year 2000 (Based on 9 full and 4 partial tracts)
A) FHA, FSA/RHS & VA Home Purchase Loans
B) Conventional Home Purchase Loans
C) Refinancings
D) Home Improvement Loans
E) Loans on Dwellings For 5+ Families
F) Non-occupant Loans on < 5 Family Dwellings (A B C & D)
Number
Average Value
Number
Average Value
Number
Average Value
Number
Average Value
Number
Average Value
Number
Average Value
LOANS ORIGINATED
339
$155,854
461
$109,779
526
$122,165
81
$23,321
17
$497,524
104
$139,524
APPLICATIONS APPROVED, NOT ACCEPTED
11
$160,811
72
$85,949
89
$115,986
30
$20,003
0
$0
11
$113,153
APPLICATIONS DENIED
16
$186,528
148
$103,814
386
$112,965
103
$28,958
2
$286,915
44
$122,776
APPLICATIONS WITHDRAWN
46
$134,262
71
$116,017
215
$111,025
25
$21,867
2
$469,860
17
$118,056
FILES CLOSED FOR INCOMPLETENESS
3
$203,333
26
$143,525
73
$130,673
3
$14,990
1
$3,685,500
12
$127,588
Aggregated Statistics For Year 1999 (Based on 9 full and 5 partial tracts)
A) FHA, FSA/RHS & VA Home Purchase Loans
B) Conventional Home Purchase Loans
C) Refinancings
D) Home Improvement Loans
E) Loans on Dwellings For 5+ Families
F) Non-occupant Loans on < 5 Family Dwellings (A B C & D)
2007 - 2018 National Fire Incident Reporting System (NFIRS) incidents
Based on the data from the years 2007 - 2018 the average number of fire incidents per year is 87. The highest number of reported fires - 255 took place in 2017, and the least - 6 in 2012. The data has an increasing trend.
When looking into fire subcategories, the most incidents belonged to: Outside Fires (50.7%), and Structure Fires (32.2%).
Fire incident types reported to NFIRS in Zip Code 93033


+$19,593
-$7,562
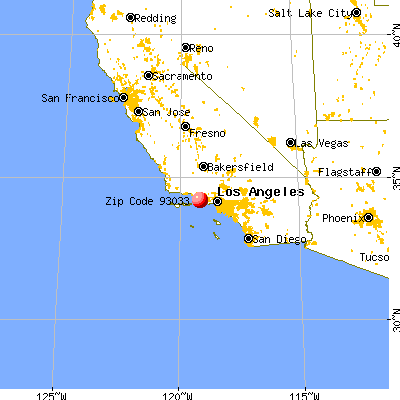
 Nearest zip codes: 93041, 93030, 93043, 93010, 93035, 93036.


 Based on the data from the years 2007 - 2018 the average number of fire incidents per year is 87. The highest number of reported fires - 255 took place in 2017, and the least - 6 in 2012. The data has an increasing trend.
 When looking into fire subcategories, the most incidents belonged to: Outside Fires (50.7%), and Structure Fires (32.2%).