Redwood neighborhood in Oxnard, California (CA), 93033 detailed profile
Settings
X

Business Search - 14 Million verified businesses
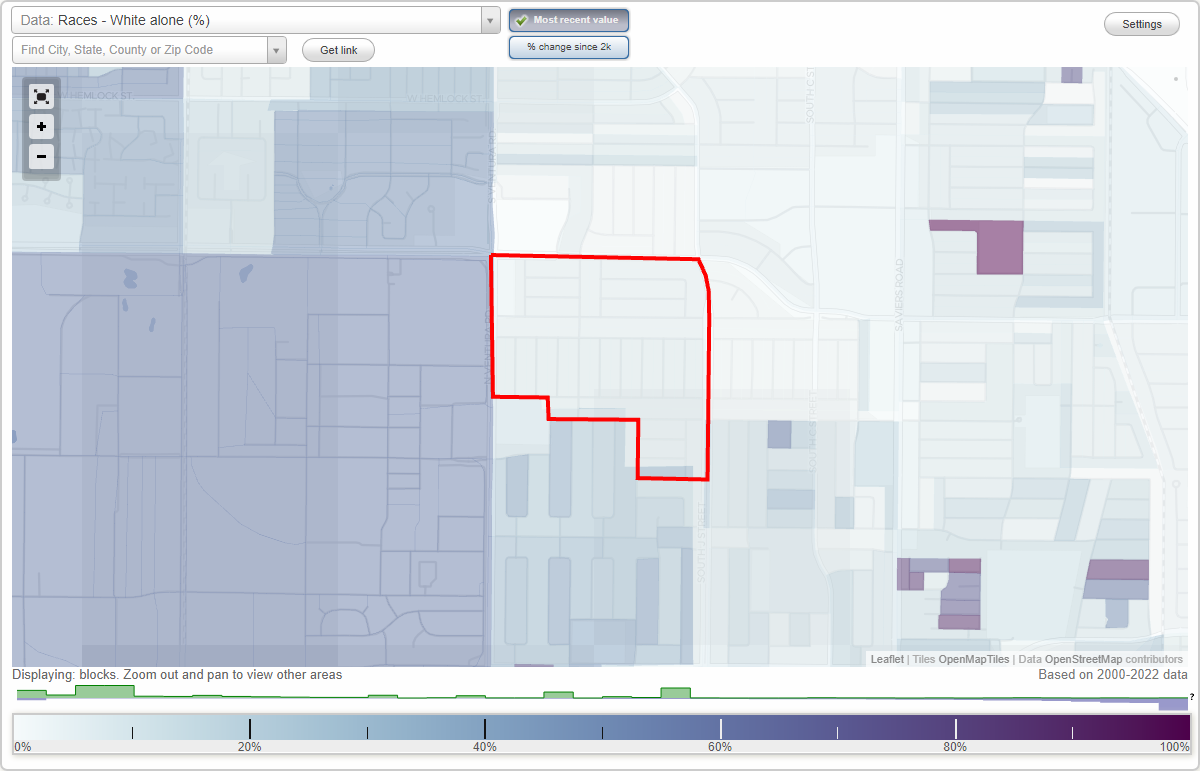
Area: 0.228 square miles
Population: 2,879
Population density:
| Redwood: | 12,621 people per square mile |
| Oxnard: | 7,918 people per square mile |

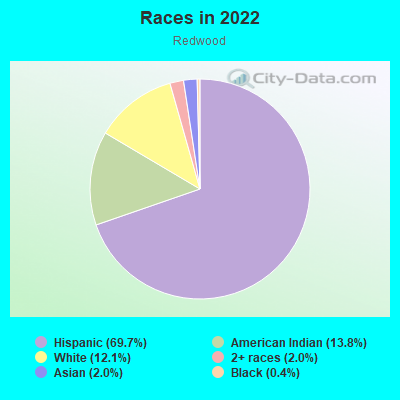
- 2,32769.7%Hispanic or Latino
- 46213.8%American Indian
- 40312.1%White
- 662.0%Asian
- 672.0%Two or more races
- 150.4%Black
Median household income in 2022:
| Redwood: | $91,379 |
| Oxnard: | $84,941 |
Distribution of median household income
![Distribution of median household income]()
- 145Less than $10,000
- 328$10,000 to $19,999
- 118$20,000 to $29,999
- 30$30,000 to $39,999
- 69$40,000 to $49,999
- 92$50,000 to $59,999
- 140$60,000 to $74,999
- 70$75,000 to $99,999
- 48$100,000 to $124,999
- 15$125,000 to $149,999
- 265$150,000 to $199,999
- 70$200,000 or more

Distribution of owner-occupied house/condo value
![Distribution of owner-occupied house/condo value]()
- 162Less than $50,000
- 42$50,000 to $99,999
- 135$100,000 to $149,999
- 4$150,000 to $199,999
- 3$200,000 to $249,999
- 31$300,000 to $399,999
- 168$400,000 to $499,999
- 190$500,000 to $749,999
- 223$750,000 to $999,999
- 7$1,000,000 or more

Distribution of rent paid by renters
![Distribution of rent paid by renters]()
- 40$300 to $399
- 18$500 to $599
- 14$700 to $799
- 97$900 to $999
- 47$1,000 to $1,249
- 50$1,250 to $1,499
- 81$1,500 to $1,999
- 96$2,000 or more

Median rent in 2022:
| Redwood: | $1,869 |
| Oxnard: | $1,876 |
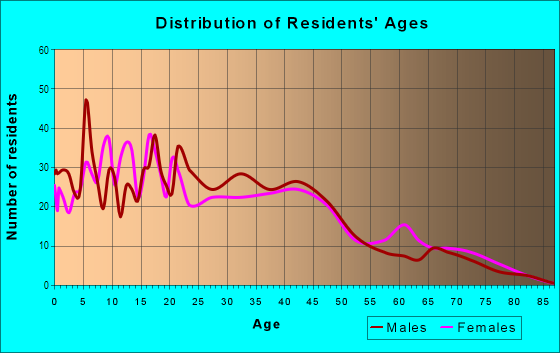
| Males: | 1,620 |
| Females: | 1,259 |
Males:
| This neighborhood: | 29.7 years |
| Whole city: | 35.1 years |
| This neighborhood: | 31.4 years |
| Whole city: | 34.3 years |
Average household size:
| Redwood: | 5.0 people |
| Oxnard: | 3.6 people |
Percentage of family households:
| Redwood: | 75.0% |
| Oxnard: | 51.5% |
| Here: | 45.7% |
| Oxnard: | 47.9% |
Percentage of married-couple families with children (among all households):
| Redwood: | 25.2% |
| Oxnard: | 16.4% |
Percentage of single-mother households (among all households):
| Redwood: | 1.4% |
| Oxnard: | 8.1% |
Percentage of never married males 15 years old and over:
Percentage of never married females 15 years old and over:
| Redwood: | 31.6% |
| Oxnard: | 22.9% |
Percentage of never married females 15 years old and over:
| Redwood: | 17.4% |
| city: | 20.1% |
Percentage of people that speak English not well or not at all:
| Redwood: | 15.0% |
| Oxnard: | 20.2% |
Percentage of people born in this state:
Percentage of people born in another U.S. state:
Percentage of native residents but born outside the U.S.:
Percentage of foreign born residents:
| Here: | 59.5% |
| Oxnard: | 58.8% |
Percentage of people born in another U.S. state:
| Redwood: | 10.6% |
| Oxnard: | 6.5% |
Percentage of native residents but born outside the U.S.:
| Here: | 1.9% |
| city: | 1.4% |
Percentage of foreign born residents:
| Here: | 28.0% |
| Oxnard: | 33.3% |
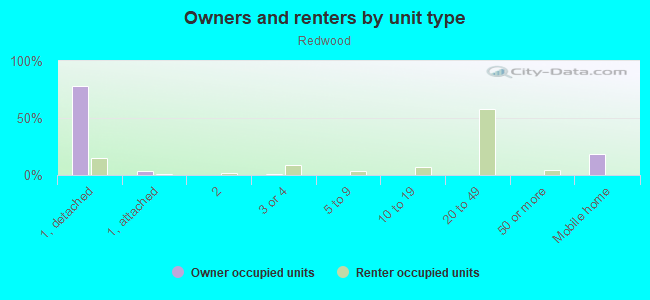
Owner-occupied
Renter-occupied

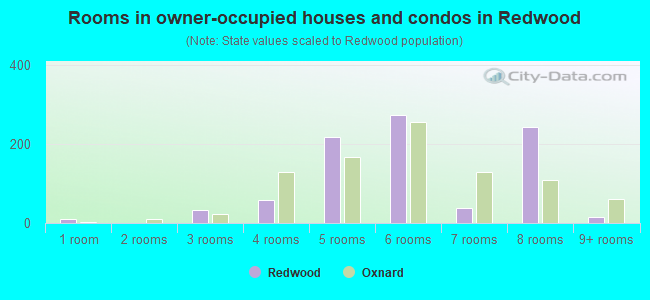
- Rooms in owner-occupied houses and condos in Redwood
- 101 room
- 02 rooms
- 343 rooms
- 594 rooms
- 2185 rooms
- 2746 rooms
- 377 rooms
- 2438 rooms
- 159+ rooms
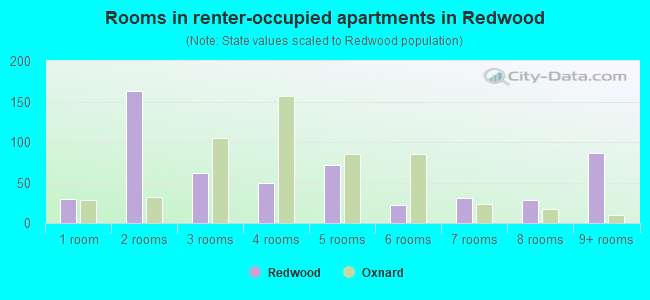
- Rooms in renter-occupied apartments in Redwood
- 301 room
- 1632 rooms
- 623 rooms
- 494 rooms
- 715 rooms
- 226 rooms
- 317 rooms
- 288 rooms
- 869+ rooms
Owner-occupied
Renter-occupied
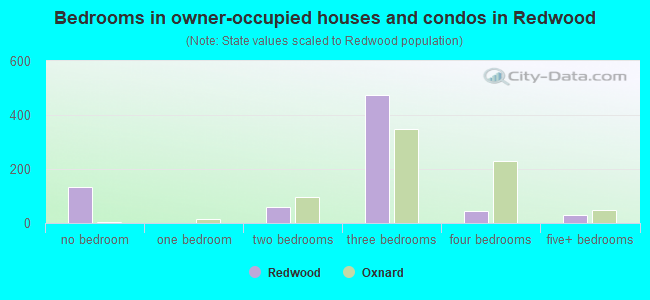
- Bedrooms in owner-occupied houses and condos in Redwood
- 134no bedroom
- 01 bedroom
- 582 bedrooms
- 4743 bedrooms
- 444 bedrooms
- 295+ bedrooms
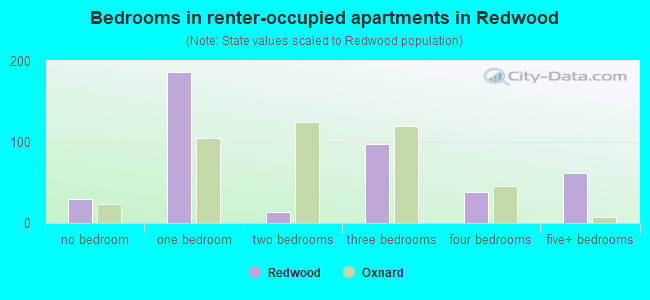
- Bedrooms in renter-occupied apartments in Redwood
- 30no bedroom
- 1861 bedroom
- 142 bedrooms
- 983 bedrooms
- 384 bedrooms
- 625+ bedrooms
Average number of cars or other vehicles available in houses/condos:
Average number of cars or other vehicles available in apartments:
| This neighborhood: | 2.9 |
| Oxnard: | 2.5 |
Average number of cars or other vehicles available in apartments:
| Here: | 2.6 |
| city: | 1.9 |
Percentage of units with a mortgage:
| Redwood: | 82.0% |
| Oxnard: | 65.5% |
Average estimated value of detached houses in 2022 (94.1% of all units):
| Redwood: | $497,738 |
| Oxnard: | $645,968 |
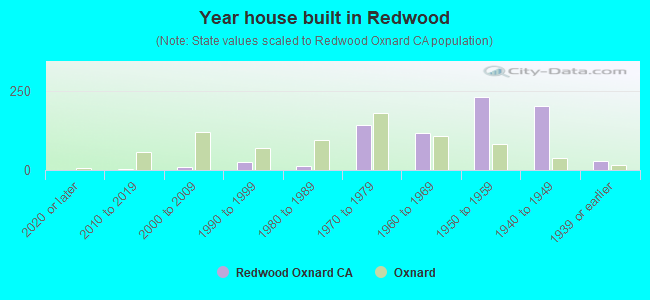
- Year house built in Redwood
- 02020 or later
- 42010 to 2019
- 102000 to 2009
- 261990 to 1999
- 121980 to 1989
- 1421970 to 1979
- 1191960 to 1969
- 2311950 to 1959
- 2021940 to 1949
- 281939 or earlier
City-data.com crime index for city in 2020 (higher means more crime):
| City: | 220.0 |
| U.S. average: | 219.5 |
Travel time to work (commute)
![Travel time to work (commute)]()
- 11Less than 5 minutes
- 1085 to 9 minutes
- 3610 to 14 minutes
- 17715 to 19 minutes
- 11620 to 24 minutes
- 42225 to 29 minutes
- 10130 to 34 minutes
- 1335 to 39 minutes
- 1340 to 44 minutes
- 5245 to 59 minutes
- 3860 to 89 minutes
- 4290 or more minutes

Means of transportation to work
![Means of transportation to work]()
- 91.4%1,283Drove a car alone
- 31.6%444Carpooled
- 0.9%12Bus
- 0.2%3Taxi
- 1.6%22Motorcycle
- 1.4%19Bicycle
- 15.0%211Walked
- 1.0%14Other means
- 2.6%37Worked at home

Time leaving home to go to work
![Time leaving home to go to work]()
- 11512:00 a.m. to 4:59 a.m.
- 315:00 a.m. to 5:29 a.m.
- 815:30 a.m. to 5:59 a.m.
- 1756:00 a.m. to 6:29 a.m.
- 576:30 a.m. to 6:59 a.m.
- 1577:00 a.m. to 7:29 a.m.
- 1217:30 a.m. to 7:59 a.m.
- 408:00 a.m. to 8:29 a.m.
- 1238:30 a.m. to 8:59 a.m.
- 499:00 a.m. to 9:59 a.m.
- 2310:00 a.m. to 10:59 a.m.
- 4811:00 a.m. to 11:59 a.m.
- 5012:00 p.m. to 3:59 p.m.
- 264:00 p.m. to 11:59 p.m.

Occupations of males:
- Percentage of males in management occupations (except farmers):
Here: 11.7% city: 6.2%
- Percentage of males in architecture and engineering occupations:
Here: 1.1% city: 3.1%
- Percentage of males in service occupations:
Here: 14.1% city: 16.9%
- Percentage of males in sales and office occupations:
Here: 26.1% city: 11.7%
- Percentage of males in farming, fishing, and forestry occupations:
Here: 7.4% city: 14.1%
- Percentage of males in construction, extraction, and maintenance occupations:
Here: 4.9% city: 9.8%
- Percentage of males in production occupations:
Here: 9.6% city: 9.6%
- Percentage of males in transportation occupations:
Here: 3.2% city: 6.5%
- Percentage of males in material moving occupations:
Here: 5.9% city: 6.3%
Occupations of females:
- Percentage of females in management occupations (except farmers):
Here: 6.4% city: 6.3%
- Percentage of females in business and financial operations occupations:
Here: 37.6% city: 5.3%
- Percentage of females in life, physical, and social science occupations:
Here: 1.3% city: 0.7%
- Percentage of females in education, training, and library occupations:
Here: 2.1% city: 4.9%
- Percentage of females in service occupations:
Here: 3.3% city: 23.6%
- Percentage of females in sales and office occupations:
Here: 34.2% city: 27.3%
- Percentage of females in farming, fishing, and forestry occupations:
Here: 1.7% city: 8.0%
- Percentage of females in production occupations:
Here: 6.2% city: 6.8%
- Percentage of females in material moving occupations:
Here: 6.2% city: 3.7%
Percentage of people 16-64 in Armed Forces:
| Redwood: | 1.1% |
| Oxnard: | 0.7% |
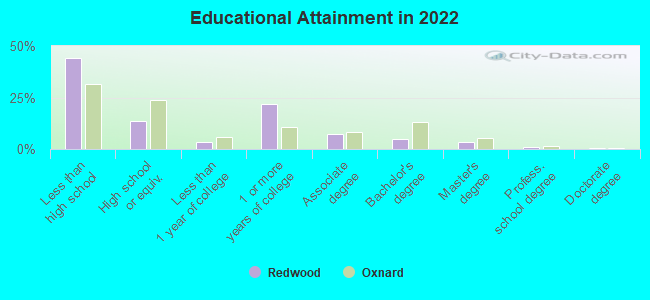
Education in this neighborhood (subdivision or community):
- Percentage of people 3 years and older in K-12 schools:
Redwood: 16.2% Oxnard: 21.0%
- Percentage of people 3 years and older in undergraduate colleges:
Redwood: 5.9% Oxnard: 5.2%
- Percentage of people 3 years and older in grad. or professional schools:
Redwood: 4.2% Oxnard: 0.8%
- Percentage of students K-12 enrolled in private schools:
Redwood: 1.8% Oxnard: 4.0%
Percentage of population below poverty level:
| Redwood: | 7.8% |
| Oxnard: | 12.8% |
Median year owner moved in (as recorded in 2022):
Median year renter moved in (as recorded in 2022):
| Redwood: | 1996 |
| Oxnard: | 2006 |
Median year renter moved in (as recorded in 2022):
| Redwood: | 2010 |
| Oxnard: | 2019 |
Percentage of married-couple families with both working:
| Redwood: | 155.1% |
| Oxnard: | 71.8% |
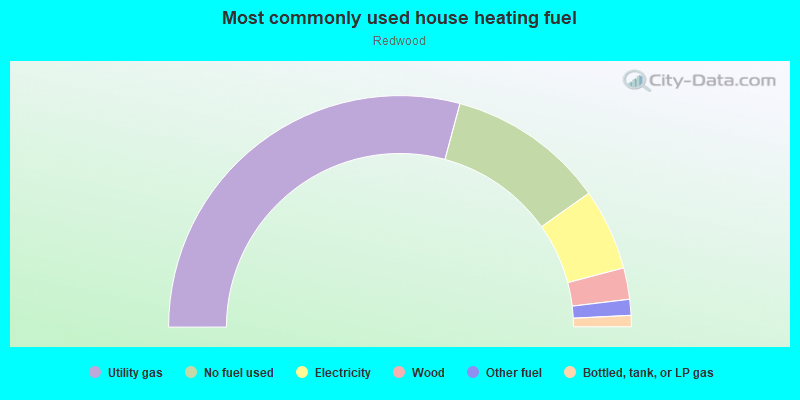
- 58.3%Utility gas
- 22.0%No fuel used
- 11.4%Electricity
- 4.4%Wood
- 2.2%Other fuel
- 1.6%Bottled, tank, or LP gas
Roads and streets:
Spruce St
Length: 0.59 miles
Direction: E-W
Address range: 800 to 1447
Direction: E-W
Address range: 800 to 1447
Teakwood St
Length: 0.59 miles
Direction: E-W
Address range: 800 to 1469
Direction: E-W
Address range: 800 to 1469
W Redwood St
Length: 0.58 miles
Direction: E-W
Address range: 801 to 1434
Direction: E-W
Address range: 801 to 1434
J St
Length: 0.42 miles
Direction: N-S
Address range: 2796 to 3521
Direction: N-S
Address range: 2796 to 3521
W Poplar St
Length: 0.41 miles
Direction: E-W
Address range: 800 to 1399
Direction: E-W
Address range: 800 to 1399
W Olive St
Length: 0.41 miles
Directions: E-W, SE-NW
Address range: 800 to 1399
Directions: E-W, SE-NW
Address range: 800 to 1399
Bryce Canyon Ave
Length: 0.39 miles
Direction: E-W
Address range: 645 to 1099
Direction: E-W
Address range: 645 to 1099
Jackson St
Length: 0.38 miles
Directions: N-S, SE-NW
Address range: 2700 to 5516
Directions: N-S, SE-NW
Address range: 2700 to 5516
S M St
Length: 0.29 miles
Direction: N-S
Address range: 2700 to 3199
Direction: N-S
Address range: 2700 to 3199
Lassen St
Length: 0.26 miles
Direction: N-S
Address range: 2652 to 3199
Direction: N-S
Address range: 2652 to 3199
S N St
Length: 0.24 miles
Direction: N-S
Address range: 2700 to 3199
Direction: N-S
Address range: 2700 to 3199
S L St
Length: 0.15 miles
Direction: N-S
Address range: 3000 to 3199
Direction: N-S
Address range: 3000 to 3199
Kern St
Length: 0.15 miles
Direction: N-S
Address range: 3000 to 3199
Direction: N-S
Address range: 3000 to 3199
Monterey St
Length: 0.15 miles
Direction: N-S
Address range: 3000 to 3199
Direction: N-S
Address range: 3000 to 3199
Napa St
Length: 0.15 miles
Direction: N-S
Address range: 3000 to 3199
Direction: N-S
Address range: 3000 to 3199
S K St
Length: 0.15 miles
Direction: N-S
Address range: 3000 to 3199
Direction: N-S
Address range: 3000 to 3199
S J St
Length: 0.10 miles
Directions: N-S, SE-NW, SW-NE
Address range: 2656 to 2953
Directions: N-S, SE-NW, SW-NE
Address range: 2656 to 2953
Polaris Way
Length: 0.06 miles
Direction: E-W
Address range: 862 to 899
Direction: E-W
Address range: 862 to 899
M St
Length: 0.05 miles
Direction: N-S
Address range: 3150 to 3199
Direction: N-S
Address range: 3150 to 3199