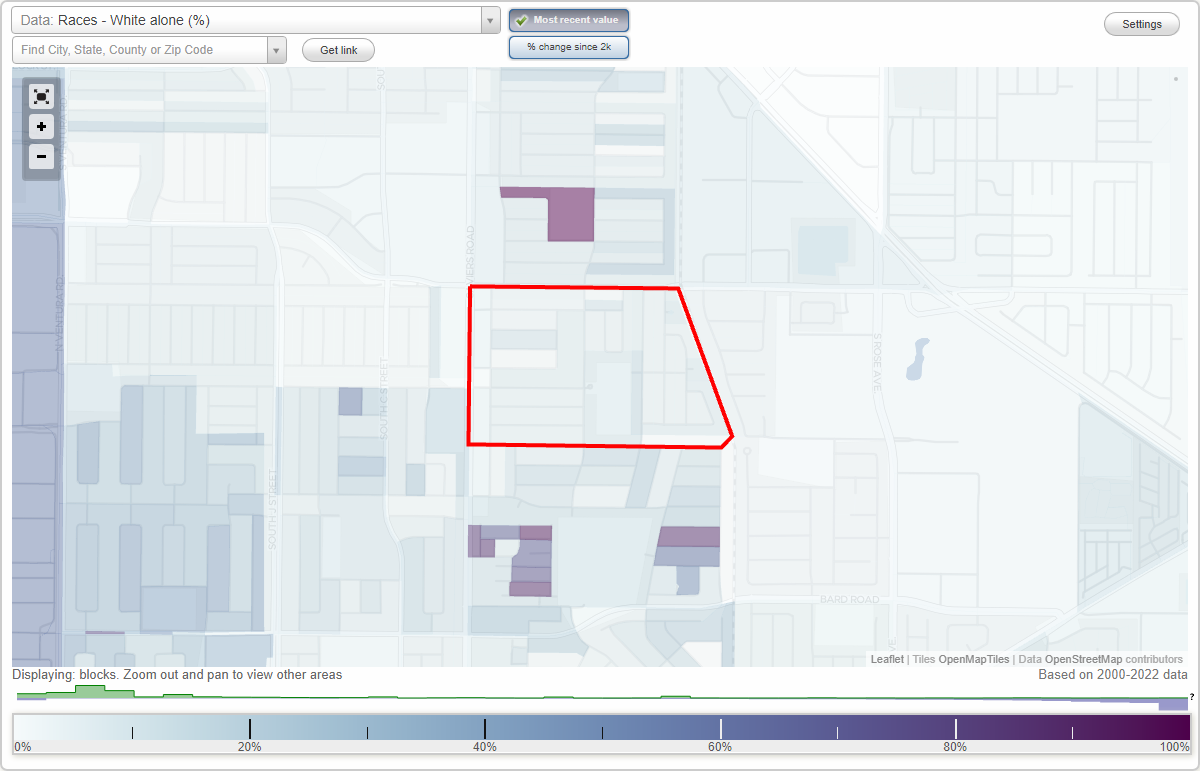
Blackstock North neighborhood in Oxnard, California (CA), 93033 detailed profile
Settings
X

Business Search - 14 Million verified businesses
Area: 0.226 square miles
Population: 3,072
Population density:
| Blackstock North: | 13,596 people per square mile |
| Oxnard: | 7,918 people per square mile |

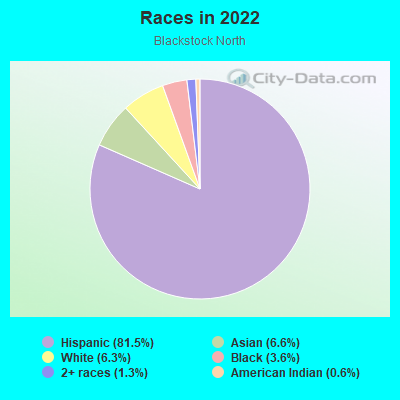
- 2,58181.5%Hispanic or Latino
- 2086.6%Asian
- 2016.3%White
- 1153.6%Black
- 411.3%Two or more races
- 200.6%American Indian
Median household income in 2022:
| Blackstock North: | $90,392 |
| Oxnard: | $84,941 |
Distribution of median household income
![Distribution of median household income]()
- 22Less than $10,000
- 72$10,000 to $19,999
- 141$20,000 to $29,999
- 57$30,000 to $39,999
- 73$40,000 to $49,999
- 73$50,000 to $59,999
- 36$60,000 to $74,999
- 98$75,000 to $99,999
- 30$100,000 to $124,999
- 105$125,000 to $149,999
- 19$150,000 to $199,999
- 86$200,000 or more

Distribution of owner-occupied house/condo value
![Distribution of owner-occupied house/condo value]()
- 19Less than $50,000
- 53$50,000 to $99,999
- 16$100,000 to $149,999
- 6$200,000 to $249,999
- 20$250,000 to $299,999
- 17$300,000 to $399,999
- 130$400,000 to $499,999
- 243$500,000 to $749,999
- 62$750,000 to $999,999

Distribution of rent paid by renters
![Distribution of rent paid by renters]()
- 40$300 to $399
- 56$400 to $499
- 71$900 to $999
- 25$1,000 to $1,249
- 79$1,250 to $1,499
- 56$1,500 to $1,999
- 73$2,000 or more

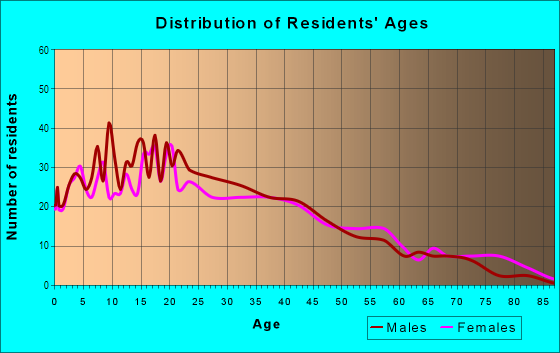
| Males: | 1,621 |
| Females: | 1,450 |
Males:
| This neighborhood: | 31.6 years |
| Whole city: | 35.1 years |
| This neighborhood: | 30.0 years |
| Whole city: | 34.3 years |
Average household size:
| Blackstock North: | 5.3 people |
| Oxnard: | 3.6 people |
Percentage of family households:
| Blackstock North: | 55.2% |
| Oxnard: | 51.5% |
| Here: | 56.6% |
| Oxnard: | 47.9% |
Percentage of married-couple families with children (among all households):
| Blackstock North: | 11.4% |
| Oxnard: | 16.4% |
Percentage of single-mother households (among all households):
| Blackstock North: | 15.1% |
| Oxnard: | 8.1% |
Percentage of never married males 15 years old and over:
Percentage of never married females 15 years old and over:
| Blackstock North: | 21.1% |
| Oxnard: | 22.9% |
Percentage of never married females 15 years old and over:
| Blackstock North: | 17.4% |
| city: | 20.1% |
Percentage of people that speak English not well or not at all:
| Blackstock North: | 31.7% |
| Oxnard: | 20.2% |
Percentage of people born in this state:
Percentage of people born in another U.S. state:
Percentage of native residents but born outside the U.S.:
Percentage of foreign born residents:
| Here: | 54.1% |
| Oxnard: | 58.8% |
Percentage of people born in another U.S. state:
| Blackstock North: | 5.8% |
| Oxnard: | 6.5% |
Percentage of native residents but born outside the U.S.:
| Here: | 1.1% |
| city: | 1.4% |
Percentage of foreign born residents:
| Here: | 39.0% |
| Oxnard: | 33.3% |
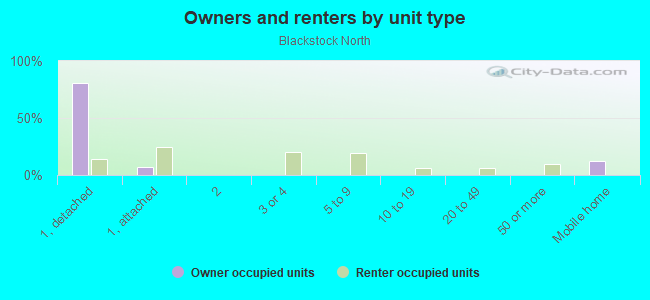
Owner-occupied
Renter-occupied

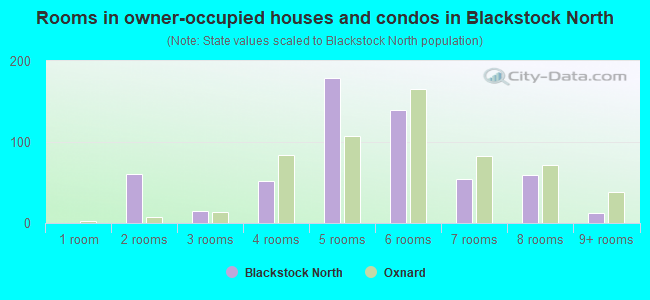
- Rooms in owner-occupied houses and condos in Blackstock North
- 01 room
- 612 rooms
- 153 rooms
- 524 rooms
- 1795 rooms
- 1406 rooms
- 547 rooms
- 598 rooms
- 129+ rooms
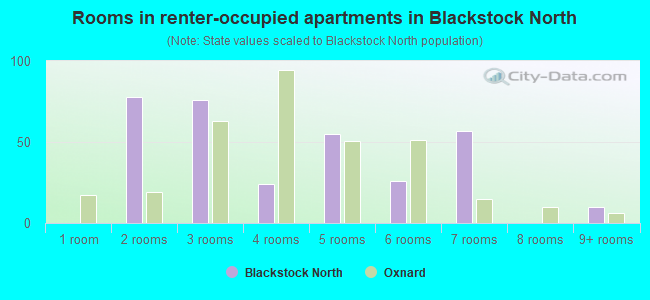
- Rooms in renter-occupied apartments in Blackstock North
- 01 room
- 782 rooms
- 763 rooms
- 244 rooms
- 555 rooms
- 266 rooms
- 577 rooms
- 08 rooms
- 109+ rooms
Owner-occupied
Renter-occupied
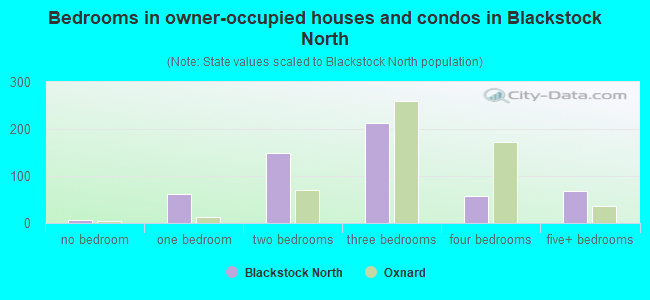
- Bedrooms in owner-occupied houses and condos in Blackstock North
- 6no bedroom
- 611 bedroom
- 1502 bedrooms
- 2123 bedrooms
- 574 bedrooms
- 695+ bedrooms
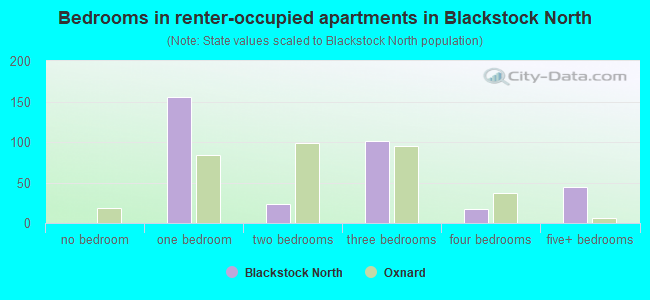
- Bedrooms in renter-occupied apartments in Blackstock North
- 0no bedroom
- 1551 bedroom
- 232 bedrooms
- 1013 bedrooms
- 174 bedrooms
- 445+ bedrooms
Average number of cars or other vehicles available in houses/condos:
Average number of cars or other vehicles available in apartments:
| This neighborhood: | 2.5 |
| Oxnard: | 2.5 |
Average number of cars or other vehicles available in apartments:
| Here: | 3.9 |
| city: | 1.9 |
Percentage of units with a mortgage:
| Blackstock North: | 65.7% |
| Oxnard: | 65.5% |
Average estimated value of detached houses in 2022 (79.5% of all units):
| Blackstock North: | $502,342 |
| Oxnard: | $645,968 |
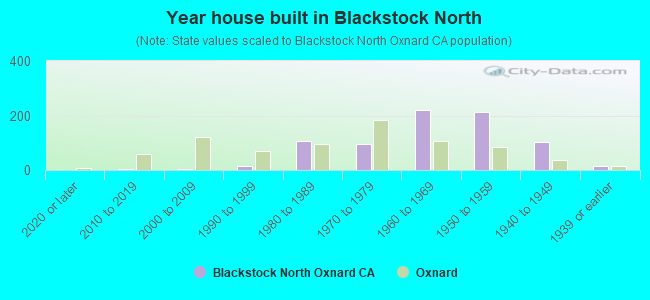
- Year house built in Blackstock North
- 02020 or later
- 42010 to 2019
- 42000 to 2009
- 151990 to 1999
- 1081980 to 1989
- 951970 to 1979
- 2191960 to 1969
- 2131950 to 1959
- 1041940 to 1949
- 161939 or earlier
City-data.com crime index for city in 2020 (higher means more crime):
| City: | 220.0 |
| U.S. average: | 219.5 |
Travel time to work (commute)
![Travel time to work (commute)]()
- 2Less than 5 minutes
- 555 to 9 minutes
- 7410 to 14 minutes
- 6515 to 19 minutes
- 5220 to 24 minutes
- 65625 to 29 minutes
- 9830 to 34 minutes
- 335 to 39 minutes
- 440 to 44 minutes
- 5045 to 59 minutes
- 760 to 89 minutes
- 1890 or more minutes

Means of transportation to work
![Means of transportation to work]()
- 83.8%1,330Drove a car alone
- 7.8%124Carpooled
- 3.5%55Bus
- 0.6%9Bicycle
- 3.2%51Walked
- 0.7%11Other means
- 4.7%74Worked at home

Time leaving home to go to work
![Time leaving home to go to work]()
- 3012:00 a.m. to 4:59 a.m.
- 615:00 a.m. to 5:29 a.m.
- 1125:30 a.m. to 5:59 a.m.
- 2086:00 a.m. to 6:29 a.m.
- 806:30 a.m. to 6:59 a.m.
- 1677:00 a.m. to 7:29 a.m.
- 997:30 a.m. to 7:59 a.m.
- 1088:00 a.m. to 8:29 a.m.
- 158:30 a.m. to 8:59 a.m.
- 259:00 a.m. to 9:59 a.m.
- 3110:00 a.m. to 10:59 a.m.
- 2512:00 p.m. to 3:59 p.m.
- 1114:00 p.m. to 11:59 p.m.

Occupations of males:
- Percentage of males in management occupations (except farmers):
Here: 2.6% city: 6.2%
- Percentage of males in computer and mathematical occupations:
Here: 4.4% city: 2.4%
- Percentage of males in healthcare practitioners and technical occupations:
Here: 1.9% city: 1.3%
- Percentage of males in service occupations:
Here: 12.7% city: 16.9%
- Percentage of males in sales and office occupations:
Here: 12.6% city: 11.7%
- Percentage of males in farming, fishing, and forestry occupations:
Here: 4.9% city: 14.1%
- Percentage of males in construction, extraction, and maintenance occupations:
Here: 25.6% city: 9.8%
- Percentage of males in production occupations:
Here: 10.6% city: 9.6%
- Percentage of males in transportation occupations:
Here: 3.0% city: 6.5%
- Percentage of males in material moving occupations:
Here: 12.5% city: 6.3%
Occupations of females:
- Percentage of females in management occupations (except farmers):
Here: 4.6% city: 6.3%
- Percentage of females in business and financial operations occupations:
Here: 14.9% city: 5.3%
- Percentage of females in life, physical, and social science occupations:
Here: 2.0% city: 0.7%
- Percentage of females in education, training, and library occupations:
Here: 2.6% city: 4.9%
- Percentage of females in healthcare practitioners and technical occupations:
Here: 5.6% city: 5.9%
- Percentage of females in service occupations:
Here: 19.0% city: 23.6%
- Percentage of females in sales and office occupations:
Here: 29.1% city: 27.3%
- Percentage of females in farming, fishing, and forestry occupations:
Here: 6.6% city: 8.0%
- Percentage of females in production occupations:
Here: 12.9% city: 6.8%
- Percentage of females in material moving occupations:
Here: 4.7% city: 3.7%
Percentage of people 16-64 in Armed Forces:
| Blackstock North: | 0.0% |
| Oxnard: | 0.7% |
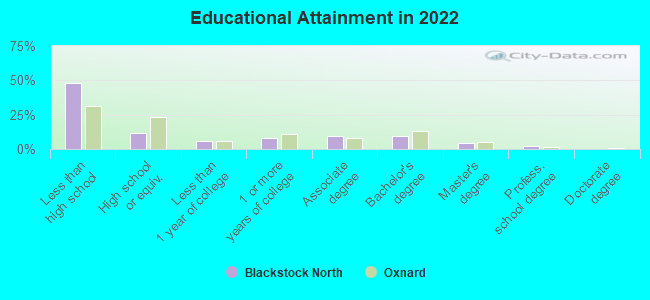
Education in this neighborhood (subdivision or community):
- Percentage of people 3 years and older in K-12 schools:
Blackstock North: 14.3% Oxnard: 21.0%
- Percentage of people 3 years and older in undergraduate colleges:
Blackstock North: 7.6% Oxnard: 5.2%
- Percentage of people 3 years and older in grad. or professional schools:
Blackstock North: 1.2% Oxnard: 0.8%
- Percentage of students K-12 enrolled in private schools:
Blackstock North: 0.0% Oxnard: 4.0%
Percentage of population below poverty level:
| Blackstock North: | 15.0% |
| Oxnard: | 12.8% |
Median year owner moved in (as recorded in 2022):
| Blackstock North: | 1999 |
| Oxnard: | 2006 |
Percentage of married-couple families with both working:
| Blackstock North: | 90.6% |
| Oxnard: | 71.8% |
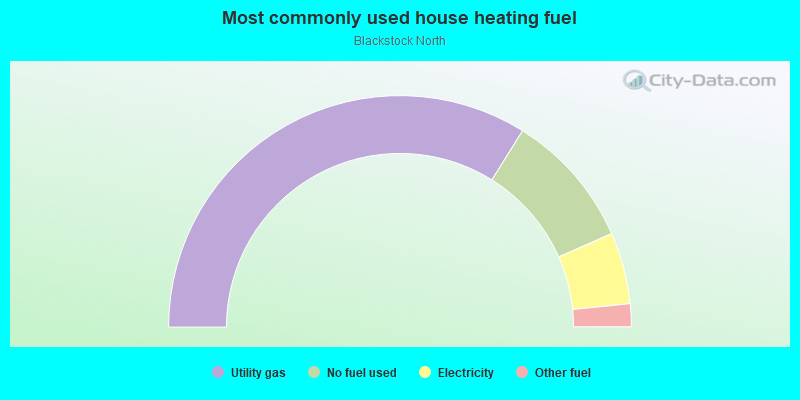
- 67.8%Utility gas
- 19.0%No fuel used
- 10.0%Electricity
- 3.2%Other fuel
Roads and streets:
la Canada Ave
Length: 0.68 miles
Direction: E-W
Address range: 100 to 899
Direction: E-W
Address range: 100 to 899
Lark St
Length: 0.39 miles
Direction: E-W
Address range: 101 to 599
Direction: E-W
Address range: 101 to 599
Cloyne St
Length: 0.36 miles
Direction: N-S
Address range: 2054 to 2299
Direction: N-S
Address range: 2054 to 2299
Samuel Ave
Length: 0.35 miles
Direction: N-S
Address range: 2200 to 3549
Direction: N-S
Address range: 2200 to 3549
Hughes Dr
Length: 0.34 miles
Directions: E-W, N-S
Address range: 100 to 2199
Directions: E-W, N-S
Address range: 100 to 2199
Thomas Ave
Length: 0.31 miles
Direction: E-W
Address range: 101 to 599
Direction: E-W
Address range: 101 to 599
Paula St
Length: 0.30 miles
Direction: N-S
Address range: 2910 to 3399
Direction: N-S
Address range: 2910 to 3399
Mc Millan Ave
Length: 0.28 miles
Direction: E-W
Address range: 100 to 299
Direction: E-W
Address range: 100 to 299
James Ave
Length: 0.28 miles
Direction: E-W
Address range: 100 to 299
Direction: E-W
Address range: 100 to 299
Circle Dr
Length: 0.27 miles
Directions: E-W, N-S, SE-NW, SW-NE
Address range: 2954 to 3299
Directions: E-W, N-S, SE-NW, SW-NE
Address range: 2954 to 3299
Clinton St
Length: 0.27 miles
Directions: E-W, N-S, SE-NW
Address range: 3000 to 3399
Directions: E-W, N-S, SE-NW
Address range: 3000 to 3399
Fournier St
Length: 0.23 miles
Direction: N-S
Address range: 3101 to 3499
Direction: N-S
Address range: 3101 to 3499
Tamarac St
Length: 0.21 miles
Directions: E-W, SW-NE
Address range: 600 to 899
Directions: E-W, SW-NE
Address range: 600 to 899
E Robert Ave
Length: 0.20 miles
Direction: E-W
Address range: 100 to 299
Direction: E-W
Address range: 100 to 299
Frank Ave
Length: 0.20 miles
Direction: E-W
Address range: 100 to 299
Direction: E-W
Address range: 100 to 299
Sequoia St
Length: 0.16 miles
Direction: E-W
Address range: 700 to 799
Direction: E-W
Address range: 700 to 799
Sycamore St
Length: 0.13 miles
Directions: E-W, N-S, SE-NW, SW-NE
Address range: 3200 to 3399
Directions: E-W, N-S, SE-NW, SW-NE
Address range: 3200 to 3399
Paula Creek
Length: 0.05 miles
Directions: E-W, N-S, SE-NW, SW-NE
Address range: 2936 to 2963
Directions: E-W, N-S, SE-NW, SW-NE
Address range: 2936 to 2963
Clinton Creek
Length: 0.04 miles
Directions: E-W, N-S, SE-NW, SW-NE
Directions: E-W, N-S, SE-NW, SW-NE
Paula Cir
Length: 0.01 miles
Direction: E-W
Address range: 2900 to 2999
Direction: E-W
Address range: 2900 to 2999