College Park neighborhood in Oxnard, California (CA), 93033 detailed profile
Settings
X

Business Search - 14 Million verified businesses
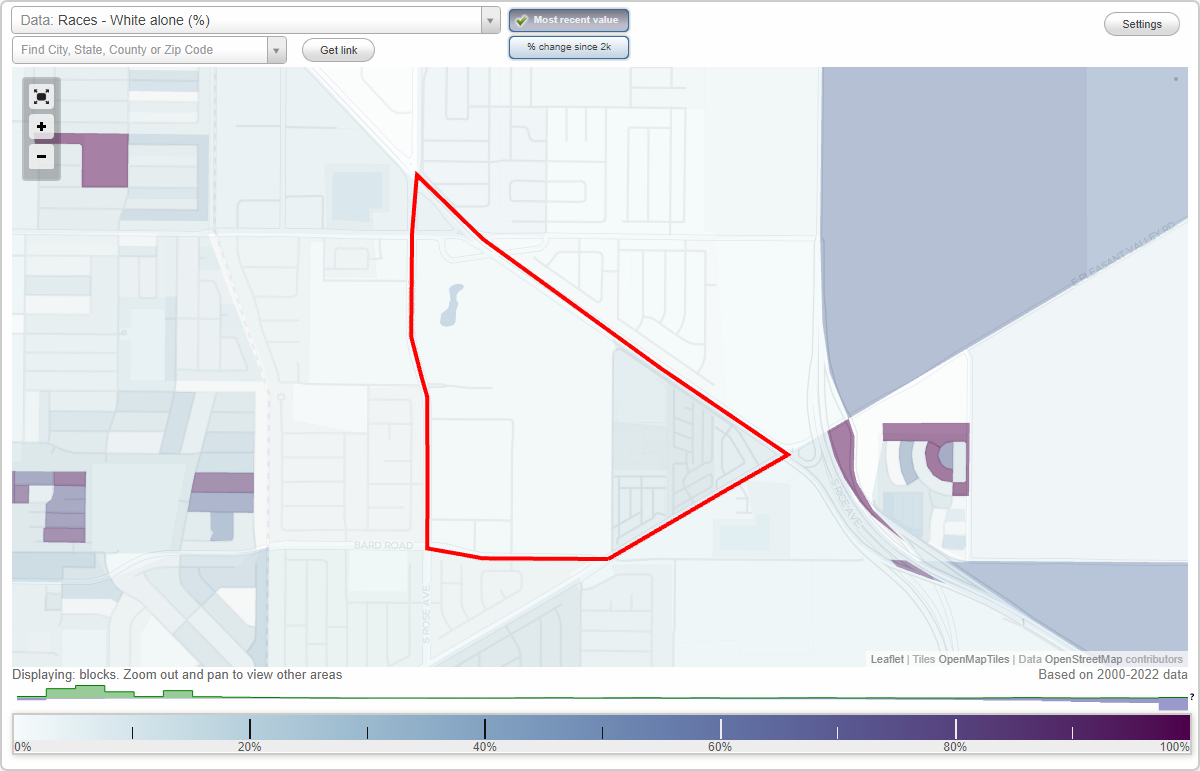
Area: 0.460 square miles
Population: 5,368
Population density:
| College Park: | 11,662 people per square mile |
| Oxnard: | 7,918 people per square mile |

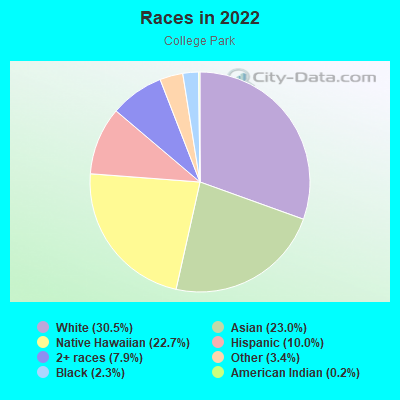
- 4,61586.0%Hispanic or Latino
- 63911.9%White
- 851.6%Asian
- 280.5%Black
Median household income in 2022:
| College Park: | $69,833 |
| Oxnard: | $84,941 |
Distribution of median household income
![Distribution of median household income]()
- 32Less than $10,000
- 13$10,000 to $19,999
- 161$20,000 to $29,999
- 108$30,000 to $39,999
- 271$40,000 to $49,999
- 57$50,000 to $59,999
- 38$60,000 to $74,999
- 233$75,000 to $99,999
- 271$100,000 to $124,999
- 117$125,000 to $149,999
- 54$200,000 or more

Distribution of owner-occupied house/condo value
![Distribution of owner-occupied house/condo value]()
- 16Less than $50,000
- 161$50,000 to $99,999
- 394$100,000 to $149,999
- 293$150,000 to $199,999
- 38$200,000 to $249,999
- 51$1,000,000 or more

Distribution of rent paid by renters
![Distribution of rent paid by renters]()
- 16$700 to $799
- 29$1,000 to $1,249
- 117$1,250 to $1,499
- 205$1,500 to $1,999
- 19$2,000 or more

Median rent in 2022:
| College Park: | $1,577 |
| Oxnard: | $1,876 |
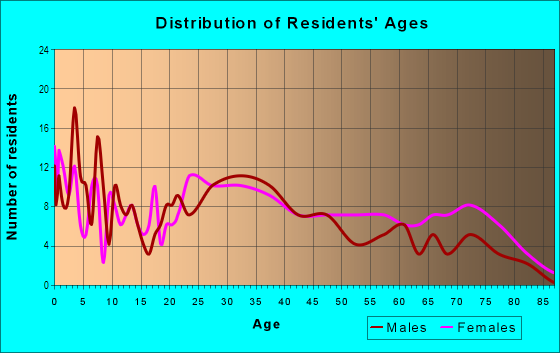
| Males: | 2,836 |
| Females: | 2,531 |
Males:
| This neighborhood: | 38.2 years |
| Whole city: | 35.1 years |
| This neighborhood: | 36.5 years |
| Whole city: | 34.3 years |
Average household size:
| College Park: | 4.0 people |
| Oxnard: | 3.6 people |
Percentage of family households:
| College Park: | 65.7% |
| Oxnard: | 51.5% |
| Here: | 52.7% |
| Oxnard: | 47.9% |
Percentage of married-couple families with children (among all households):
| College Park: | 11.7% |
| Oxnard: | 16.4% |
Percentage of single-mother households (among all households):
| College Park: | 10.4% |
| Oxnard: | 8.1% |
Percentage of never married males 15 years old and over:
Percentage of never married females 15 years old and over:
| College Park: | 24.0% |
| Oxnard: | 22.9% |
Percentage of never married females 15 years old and over:
| College Park: | 19.3% |
| city: | 20.1% |
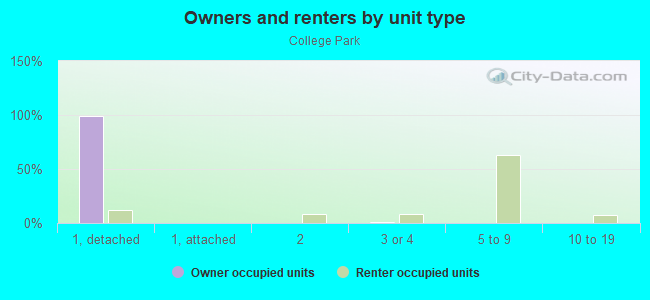
Owner-occupied
Renter-occupied

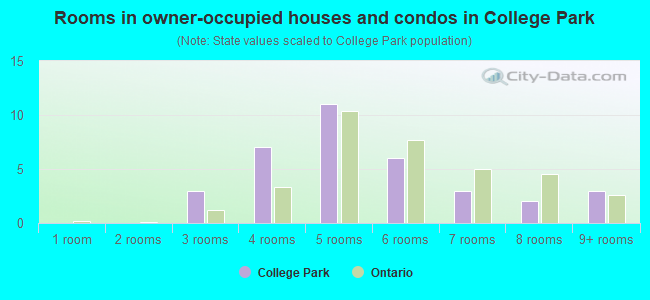
- Rooms in owner-occupied houses and condos in College Park
- 01 room
- 02 rooms
- 813 rooms
- 3654 rooms
- 2105 rooms
- 1546 rooms
- 597 rooms
- 318 rooms
- 479+ rooms
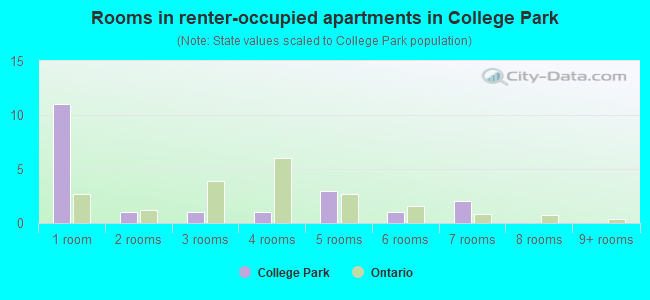
- Rooms in renter-occupied apartments in College Park
- 01 room
- 02 rooms
- 223 rooms
- 2104 rooms
- 405 rooms
- 566 rooms
- 697 rooms
- 08 rooms
- 09+ rooms
Owner-occupied
Renter-occupied
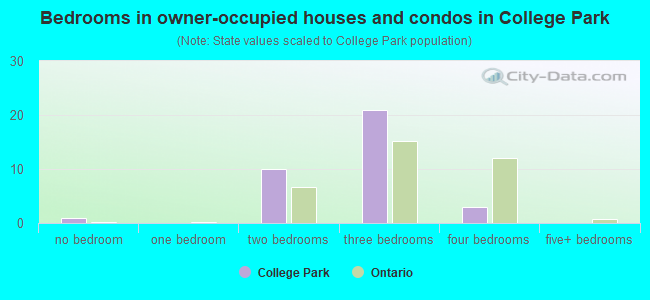
- Bedrooms in owner-occupied houses and condos in College Park
- 0no bedroom
- 531 bedroom
- 3302 bedrooms
- 5353 bedrooms
- 314 bedrooms
- 05+ bedrooms
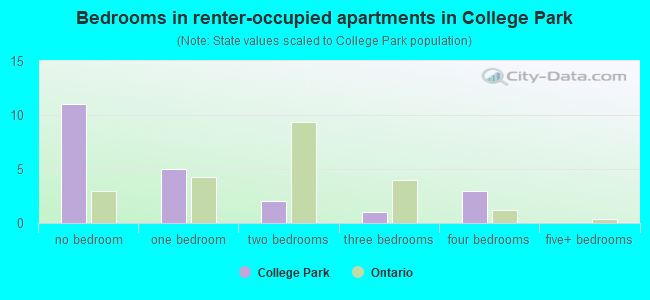
- Bedrooms in renter-occupied apartments in College Park
- 0no bedroom
- 221 bedroom
- 1572 bedrooms
- 1513 bedrooms
- 284 bedrooms
- 405+ bedrooms
Average number of cars or other vehicles available in houses/condos:
Average number of cars or other vehicles available in apartments:
| This neighborhood: | 2.2 |
| Oxnard: | 2.5 |
Average number of cars or other vehicles available in apartments:
| Here: | 2.0 |
| city: | 1.9 |
Percentage of units with a mortgage:
| College Park: | 19.5% |
| Oxnard: | 65.5% |
Housing prices:
- Average estimated value of detached houses in 2022 (17.5% of all units):
College Park: $1,496,023 Oxnard: $645,968
- Average estimated value of mobile home in 2022 (81.0% of all units):
College Park: $129,969 Oxnard: $168,523
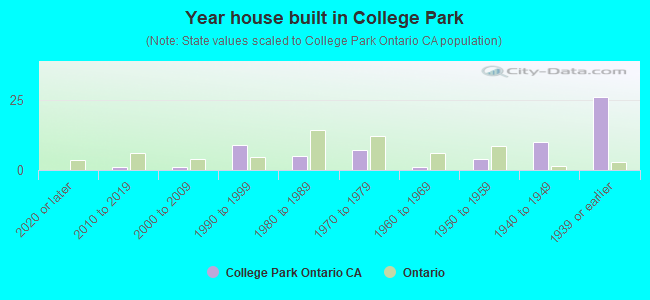
- Year house built in College Park
- 02020 or later
- 02010 to 2019
- 282000 to 2009
- 1731990 to 1999
- 2801980 to 1989
- 7581970 to 1979
- 781960 to 1969
- 151950 to 1959
- 1411940 to 1949
- 151939 or earlier
City-data.com crime index for city in 2020 (higher means more crime):
| City: | 220.0 |
| U.S. average: | 219.5 |
Means of transportation to work
![Means of transportation to work]()
- 74.0%1,728Drove a car alone
- 25.2%588Carpooled
- 0.8%18Worked at home

Occupations of males:
- Percentage of males in management occupations (except farmers):
Here: 1.4% city: 6.2%
- Percentage of males in business and financial operations occupations:
Here: 4.9% city: 2.6%
- Percentage of males in service occupations:
Here: 6.3% city: 16.9%
- Percentage of males in sales and office occupations:
Here: 2.1% city: 11.7%
- Percentage of males in farming, fishing, and forestry occupations:
Here: 26.2% city: 14.1%
- Percentage of males in construction, extraction, and maintenance occupations:
Here: 21.7% city: 9.8%
- Percentage of males in production occupations:
Here: 10.0% city: 9.6%
- Percentage of males in transportation occupations:
Here: 22.7% city: 6.5%
- Percentage of males in material moving occupations:
Here: 3.0% city: 6.3%
Occupations of females:
- Percentage of females in management occupations (except farmers):
Here: 2.4% city: 6.3%
- Percentage of females in business and financial operations occupations:
Here: 1.3% city: 5.3%
- Percentage of females in life, physical, and social science occupations:
Here: 1.1% city: 0.7%
- Percentage of females in education, training, and library occupations:
Here: 6.9% city: 4.9%
- Percentage of females in service occupations:
Here: 31.5% city: 23.6%
- Percentage of females in sales and office occupations:
Here: 31.5% city: 27.3%
- Percentage of females in farming, fishing, and forestry occupations:
Here: 10.7% city: 8.0%
- Percentage of females in production occupations:
Here: 8.0% city: 6.8%
- Percentage of females in material moving occupations:
Here: 6.7% city: 3.7%
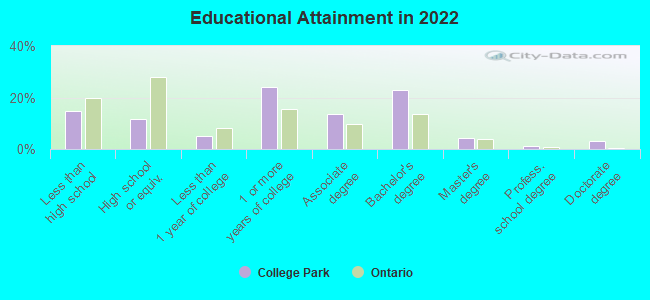
Education in this neighborhood (subdivision or community):
- Percentage of people 3 years and older in K-12 schools:
College Park: 31.1% Oxnard: 21.0%
- Percentage of people 3 years and older in undergraduate colleges:
College Park: 1.9% Oxnard: 5.2%
- Percentage of people 3 years and older in grad. or professional schools:
College Park: 0.0% Oxnard: 0.8%
- Percentage of students K-12 enrolled in private schools:
College Park: 0.0% Oxnard: 4.0%
Median year owner moved in (as recorded in 2022):
Median year renter moved in (as recorded in 2022):
| College Park: | 2006 |
| Oxnard: | 2006 |
Median year renter moved in (as recorded in 2022):
| College Park: | 2015 |
| Oxnard: | 2019 |
Percentage of married-couple families with both working:
| College Park: | 90.3% |
| Oxnard: | 71.8% |
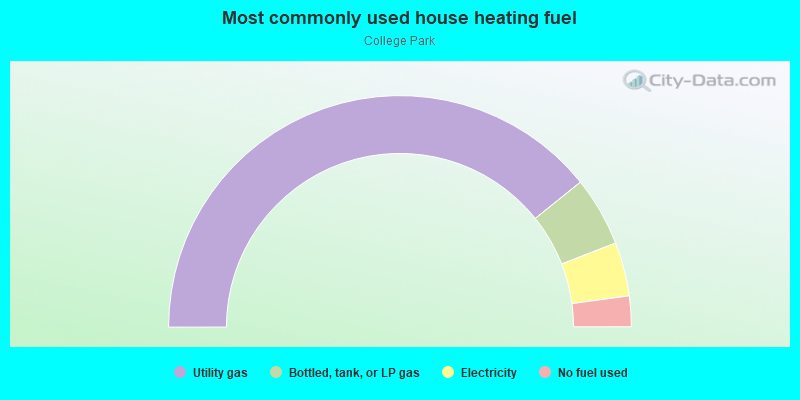
- 60.6%Utility gas
- 21.7%No fuel used
- 13.0%Electricity
- 3.8%Bottled, tank, or LP gas
- 0.9%Solar energy
Highways in this neighborhood:
Pacific Coast Hwy (State Rte 1, S Oxnard Blvd)
Length: 1.36 miles
Direction: SE-NW
Direction: SE-NW
Roads and streets:
Olds Rd
Length: 1.53 miles
Directions: E-W, N-S, SE-NW, SW-NE
Address range: 3400 to 4199
Directions: E-W, N-S, SE-NW, SW-NE
Address range: 3400 to 4199
Butler Rd
Length: 0.58 miles
Directions: E-W, SE-NW
Address range: 2201 to 3499
Directions: E-W, SE-NW
Address range: 2201 to 3499
E Pleasant Valley Rd
Length: 0.57 miles
Direction: SW-NE
Address range: 2109 to 2399
Direction: SW-NE
Address range: 2109 to 2399
Simpson Dr
Length: 0.34 miles
Directions: N-S, SE-NW
Directions: N-S, SE-NW
Orange Grove Ave
Length: 0.28 miles
Directions: N-S, SE-NW, SW-NE
Address range: 3600 to 3899
Directions: N-S, SE-NW, SW-NE
Address range: 3600 to 3899
Pear Ave
Length: 0.22 miles
Directions: E-W, N-S, SW-NE
Address range: 1210 to 1298
Directions: E-W, N-S, SW-NE
Address range: 1210 to 1298
Bard Rd
Length: 0.21 miles
Direction: E-W
Direction: E-W
Tree Ln
Length: 0.20 miles
Directions: E-W, N-S
Address range: 1200 to 1299
Directions: E-W, N-S
Address range: 1200 to 1299
Oxnard Blvd Acc
Length: 0.19 miles
Directions: E-W, N-S, SE-NW
Directions: E-W, N-S, SE-NW
Mockingbird Ln
Length: 0.19 miles
Direction: N-S
Address range: 2104 to 4199
Direction: N-S
Address range: 2104 to 4199
Thrush Ave
Length: 0.16 miles
Direction: E-W
Address range: 1900 to 2199
Direction: E-W
Address range: 1900 to 2199
Lime Ave
Length: 0.16 miles
Directions: N-S, SW-NE
Address range: 1500 to 1699
Directions: N-S, SW-NE
Address range: 1500 to 1699
Robin Ave
Length: 0.15 miles
Directions: E-W, SW-NE
Address range: 2100 to 2199
Directions: E-W, SW-NE
Address range: 2100 to 2199
Thrush
Length: 0.15 miles
Direction: E-W
Address range: 2100 to 2199
Direction: E-W
Address range: 2100 to 2199
Avocado Ln
Length: 0.15 miles
Direction: N-S
Address range: 3600 to 3699
Direction: N-S
Address range: 3600 to 3699
Lemon Ave
Length: 0.14 miles
Directions: E-W, N-S, SW-NE
Address range: 3600 to 3799
Directions: E-W, N-S, SW-NE
Address range: 3600 to 3799
Cardinal Ave
Length: 0.14 miles
Direction: E-W
Address range: 2100 to 2199
Direction: E-W
Address range: 2100 to 2199
Gary Dr
Length: 0.13 miles
Direction: E-W
Direction: E-W
Cherry Ave
Length: 0.12 miles
Directions: E-W, SW-NE
Address range: 1500 to 1699
Directions: E-W, SW-NE
Address range: 1500 to 1699
Bluebird Ln
Length: 0.12 miles
Direction: N-S
Address range: 3900 to 4199
Direction: N-S
Address range: 3900 to 4199
E Channel Islands Blvd
Length: 0.11 miles
Direction: E-W
Address range: 1787 to 1899
Direction: E-W
Address range: 1787 to 1899
S Campus Rd
Length: 0.11 miles
Direction: E-W
Direction: E-W
Bluejay Ave
Length: 0.10 miles
Direction: SW-NE
Address range: 2100 to 2199
Direction: SW-NE
Address range: 2100 to 2199
Oriole Ln
Length: 0.09 miles
Direction: N-S
Address range: 3900 to 4099
Direction: N-S
Address range: 3900 to 4099
Raven Ln
Length: 0.07 miles
Direction: N-S
Address range: 4000 to 4099
Direction: N-S
Address range: 4000 to 4099
Canary Ln
Length: 0.07 miles
Direction: N-S
Address range: 4000 to 4099
Direction: N-S
Address range: 4000 to 4099
Peach Ave
Length: 0.06 miles
Direction: E-W
Address range: 1400 to 1499
Direction: E-W
Address range: 1400 to 1499
Persimmon Ave
Length: 0.06 miles
Direction: E-W
Address range: 1400 to 1499
Direction: E-W
Address range: 1400 to 1499
Apricot Ln
Length: 0.03 miles
Direction: E-W
Address range: 1100 to 1499
Direction: E-W
Address range: 1100 to 1499