Ormond Beach neighborhood in Oxnard, California (CA), 93033 detailed profile
Settings
X

Business Search - 14 Million verified businesses
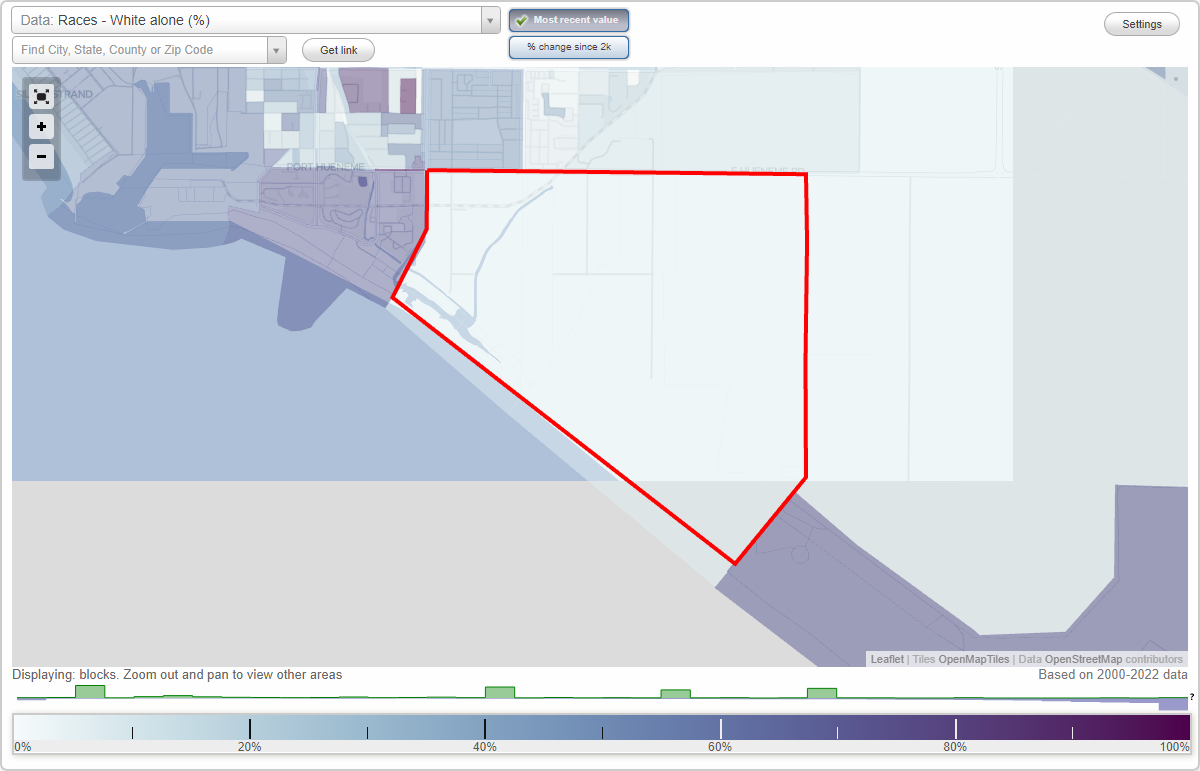
Area: 2.654 square miles
Population: 1,766
Population density:
| Ormond Beach: | 666 people per square mile |
| Oxnard: | 7,918 people per square mile |

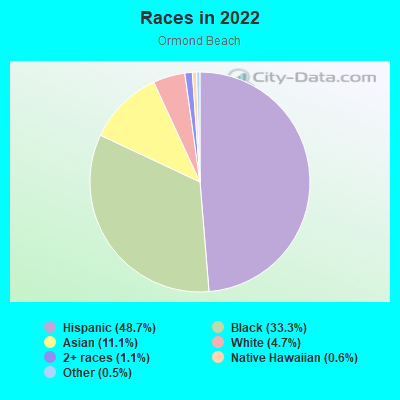
- 1,27048.7%Hispanic or Latino
- 86933.3%Black
- 28911.1%Asian
- 1224.7%White
- 301.1%Two or more races
- 160.6%Native Hawaiian and Other
Pacific Islander - 140.5%Some other race
Median household income in 2022:
| Ormond Beach: | $94,994 |
| Oxnard: | $84,941 |
Distribution of median household income
![Distribution of median household income]()
- 139Less than $10,000
- 63$10,000 to $19,999
- 251$20,000 to $29,999
- 100$30,000 to $39,999
- 19$40,000 to $49,999
- 29$50,000 to $59,999
- 43$60,000 to $74,999
- 93$75,000 to $99,999
- 124$100,000 to $124,999
- 80$125,000 to $149,999
- 68$150,000 to $199,999
- 198$200,000 or more

Distribution of owner-occupied house/condo value
![Distribution of owner-occupied house/condo value]()
- 11Less than $50,000
- 459$50,000 to $99,999
- 88$100,000 to $149,999
- 74$200,000 to $249,999
- 19$250,000 to $299,999
- 12$300,000 to $399,999
- 54$400,000 to $499,999
- 141$500,000 to $749,999
- 41$750,000 to $999,999
- 6$1,000,000 or more

Distribution of rent paid by renters
![Distribution of rent paid by renters]()
- 96Less than $100
- 33$200 to $299
- 32$300 to $399
- 323$400 to $499
- 212$500 to $599
- 228$600 to $699
- 180$700 to $799
- 118$800 to $899
- 21$1,000 to $1,249
- 711$1,250 to $1,499
- 64$1,500 to $1,999
- 458$2,000 or more

Median rent in 2022:
| Ormond Beach: | $1,755 |
| Oxnard: | $1,876 |
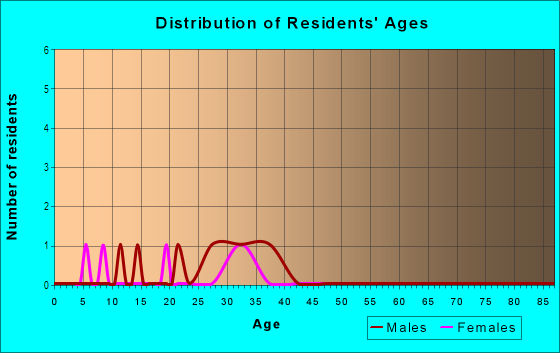
| Males: | 1,032 |
| Females: | 734 |
Males:
| This neighborhood: | 31.3 years |
| Whole city: | 35.1 years |
| This neighborhood: | 40.4 years |
| Whole city: | 34.3 years |
Average household size:
| Ormond Beach: | 33.9 people |
| Oxnard: | 3.6 people |
Percentage of family households:
| Ormond Beach: | 68.4% |
| Oxnard: | 51.5% |
| Here: | 49.4% |
| Oxnard: | 47.9% |
Percentage of married-couple families with children (among all households):
| Ormond Beach: | 17.9% |
| Oxnard: | 16.4% |
Percentage of single-mother households (among all households):
| Ormond Beach: | 7.6% |
| Oxnard: | 8.1% |
Percentage of never married males 15 years old and over:
Percentage of never married females 15 years old and over:
| Ormond Beach: | 33.5% |
| Oxnard: | 22.9% |
Percentage of never married females 15 years old and over:
| Ormond Beach: | 13.0% |
| city: | 20.1% |
Percentage of people that speak English not well or not at all:
| Ormond Beach: | 0.0% |
| Oxnard: | 20.2% |
Percentage of people born in this state:
Percentage of people born in another U.S. state:
Percentage of native residents but born outside the U.S.:
Percentage of foreign born residents:
| Here: | 51.7% |
| Oxnard: | 58.8% |
Percentage of people born in another U.S. state:
| Ormond Beach: | 9.1% |
| Oxnard: | 6.5% |
Percentage of native residents but born outside the U.S.:
| Here: | 1.9% |
| city: | 1.4% |
Percentage of foreign born residents:
| Here: | 37.3% |
| Oxnard: | 33.3% |
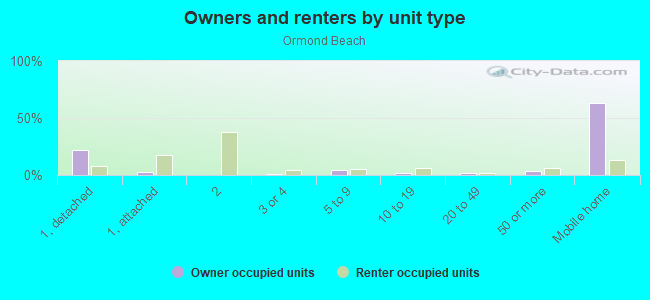
Owner-occupied
Renter-occupied

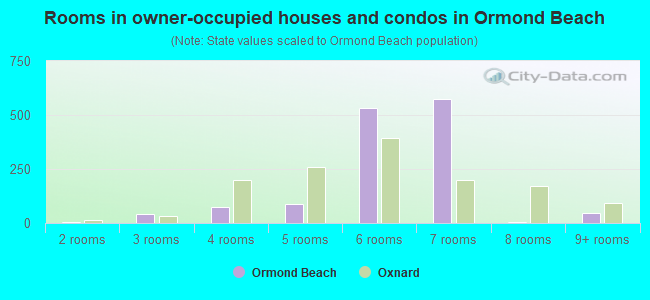
- Rooms in owner-occupied houses and condos in Ormond Beach
- 01 room
- 42 rooms
- 403 rooms
- 744 rooms
- 895 rooms
- 5336 rooms
- 5727 rooms
- 38 rooms
- 469+ rooms
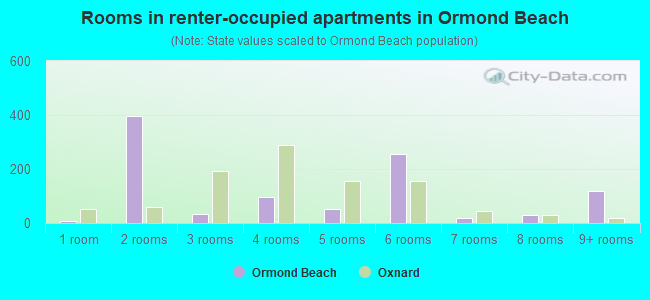
- Rooms in renter-occupied apartments in Ormond Beach
- 71 room
- 3952 rooms
- 353 rooms
- 964 rooms
- 515 rooms
- 2566 rooms
- 177 rooms
- 298 rooms
- 1189+ rooms
Owner-occupied
Renter-occupied
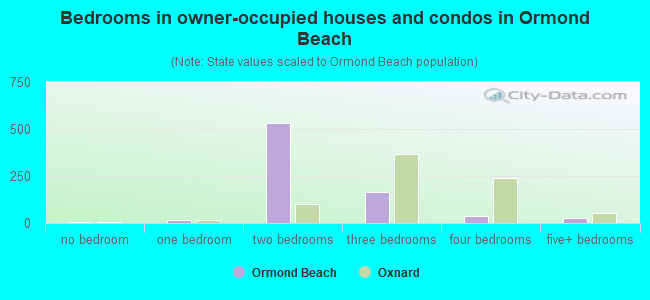
- Bedrooms in owner-occupied houses and condos in Ormond Beach
- 4no bedroom
- 171 bedroom
- 5332 bedrooms
- 1643 bedrooms
- 384 bedrooms
- 255+ bedrooms
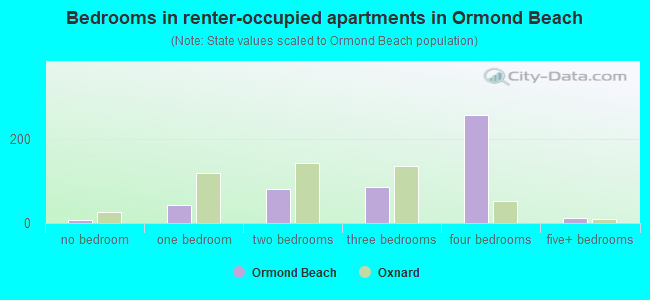
- Bedrooms in renter-occupied apartments in Ormond Beach
- 7no bedroom
- 421 bedroom
- 812 bedrooms
- 863 bedrooms
- 2564 bedrooms
- 135+ bedrooms
Average number of cars or other vehicles available in houses/condos:
Average number of cars or other vehicles available in apartments:
| This neighborhood: | 2.7 |
| Oxnard: | 2.5 |
Average number of cars or other vehicles available in apartments:
| Here: | 2.3 |
| city: | 1.9 |
Percentage of units with a mortgage:
| Ormond Beach: | 72.8% |
| Oxnard: | 65.5% |
Housing prices:
- Average estimated value of detached houses in 2022 (56.9% of all units):
Ormond Beach: $521,099 Oxnard: $645,968
- Average estimated value of townhouses or other attached units in 2022 (4.7% of all units):
This neighborhood: $347,411 city: $592,592
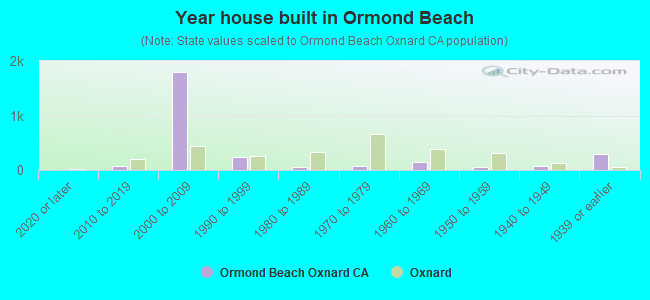
- Year house built in Ormond Beach
- 02020 or later
- 702010 to 2019
- 1,7972000 to 2009
- 2371990 to 1999
- 571980 to 1989
- 761970 to 1979
- 1481960 to 1969
- 461950 to 1959
- 661940 to 1949
- 2961939 or earlier
City-data.com crime index for city in 2020 (higher means more crime):
| City: | 220.0 |
| U.S. average: | 219.5 |
Travel time to work (commute)
![Travel time to work (commute)]()
- 16Less than 5 minutes
- 885 to 9 minutes
- 10910 to 14 minutes
- 18915 to 19 minutes
- 18420 to 24 minutes
- 84825 to 29 minutes
- 27930 to 34 minutes
- 7135 to 39 minutes
- 2740 to 44 minutes
- 1045 to 59 minutes
- 4760 to 89 minutes
- 4290 or more minutes

Means of transportation to work
![Means of transportation to work]()
- 92.1%961Drove a car alone
- 4.3%45Carpooled
- 26.5%276Bus
- 13.3%139Taxi
- 1.7%18Walked
- 4.1%43Other means
- 1.8%19Worked at home

Time leaving home to go to work
![Time leaving home to go to work]()
- 5912:00 a.m. to 4:59 a.m.
- 1545:00 a.m. to 5:29 a.m.
- 2785:30 a.m. to 5:59 a.m.
- 3116:00 a.m. to 6:29 a.m.
- 1886:30 a.m. to 6:59 a.m.
- 1497:00 a.m. to 7:29 a.m.
- 1477:30 a.m. to 7:59 a.m.
- 1938:00 a.m. to 8:29 a.m.
- 188:30 a.m. to 8:59 a.m.
- 879:00 a.m. to 9:59 a.m.
- 3410:00 a.m. to 10:59 a.m.
- 3111:00 a.m. to 11:59 a.m.
- 21512:00 p.m. to 3:59 p.m.
- 974:00 p.m. to 11:59 p.m.

Occupations of males:
- Percentage of males in management occupations (except farmers):
Here: 8.6% city: 6.2%
- Percentage of males in business and financial operations occupations:
Here: 1.4% city: 2.6%
- Percentage of males in computer and mathematical occupations:
Here: 2.9% city: 2.4%
- Percentage of males in architecture and engineering occupations:
Here: 3.2% city: 3.1%
- Percentage of males in education, training, and library occupations:
Here: 2.8% city: 1.7%
- Percentage of males in arts, design, entertainment, sports, and media occupations:
Here: 2.4% city: 1.1%
- Percentage of males in service occupations:
Here: 22.3% city: 16.9%
- Percentage of males in sales and office occupations:
Here: 5.5% city: 11.7%
- Percentage of males in farming, fishing, and forestry occupations:
Here: 9.1% city: 14.1%
- Percentage of males in construction, extraction, and maintenance occupations:
Here: 23.3% city: 9.8%
- Percentage of males in production occupations:
Here: 32.1% city: 9.6%
- Percentage of males in transportation occupations:
Here: 13.2% city: 6.5%
Occupations of females:
- Percentage of females in management occupations (except farmers):
Here: 9.5% city: 6.3%
- Percentage of females in business and financial operations occupations:
Here: 4.7% city: 5.3%
- Percentage of females in computer and mathematical occupations:
Here: 2.4% city: 0.9%
- Percentage of females in community and social services occupations:
Here: 3.9% city: 2.4%
- Percentage of females in education, training, and library occupations:
Here: 6.2% city: 4.9%
- Percentage of females in arts, design, entertainment, sports, and media occupations:
Here: 1.5% city: 1.5%
- Percentage of females in healthcare practitioners and technical occupations:
Here: 10.9% city: 5.9%
- Percentage of females in service occupations:
Here: 22.2% city: 23.6%
- Percentage of females in sales and office occupations:
Here: 17.4% city: 27.3%
- Percentage of females in farming, fishing, and forestry occupations:
Here: 6.0% city: 8.0%
- Percentage of females in production occupations:
Here: 22.4% city: 6.8%
- Percentage of females in transportation occupations:
Here: 2.3% city: 0.9%
- Percentage of females in material moving occupations:
Here: 2.4% city: 3.7%
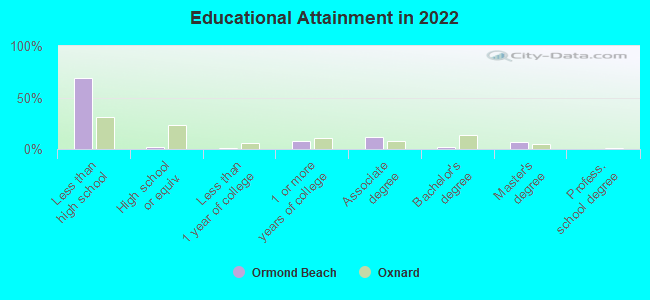
Education in this neighborhood (subdivision or community):
- Percentage of people 3 years and older in K-12 schools:
Ormond Beach: 86.2% Oxnard: 21.0%
- Percentage of people 3 years and older in undergraduate colleges:
Ormond Beach: 58.6% Oxnard: 5.2%
- Percentage of people 3 years and older in grad. or professional schools:
Ormond Beach: 2.2% Oxnard: 0.8%
- Percentage of students K-12 enrolled in private schools:
Ormond Beach: 41.5% Oxnard: 4.0%
Percentage of population below poverty level:
| Ormond Beach: | 15.9% |
| Oxnard: | 12.8% |
Median year owner moved in (as recorded in 2022):
Median year renter moved in (as recorded in 2022):
| Ormond Beach: | 2006 |
| Oxnard: | 2006 |
Median year renter moved in (as recorded in 2022):
| Ormond Beach: | 2008 |
| Oxnard: | 2019 |
Percentage of married-couple families with both working:
| Ormond Beach: | 519.5% |
| Oxnard: | 71.8% |
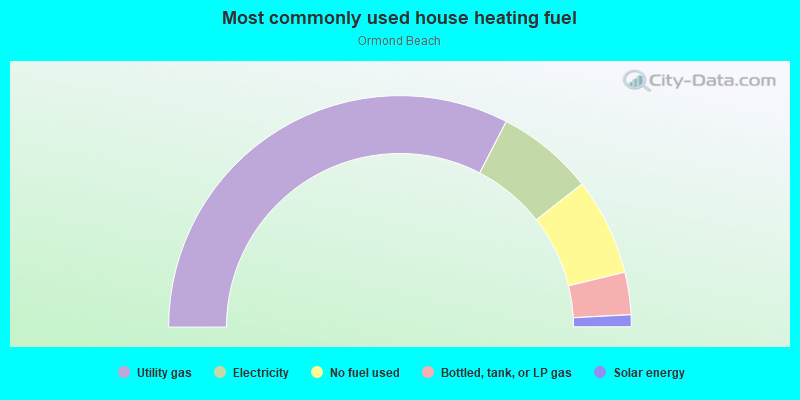
- 65.2%Utility gas
- 13.6%Electricity
- 13.6%No fuel used
- 5.9%Bottled, tank, or LP gas
- 1.7%Solar energy
Roads and streets:
Arnold Rd
Length: 1.03 miles
Directions: N-S, SW-NE
Address range: 6556 to 6899
Directions: N-S, SW-NE
Address range: 6556 to 6899
Ocean View Dr
Length: 0.84 miles
Direction: SE-NW
Direction: SE-NW
McWane Blvd
Length: 0.80 miles
Direction: E-W
Address range: 100 to 1099
Direction: E-W
Address range: 100 to 1099
Edison Dr
Length: 0.75 miles
Direction: N-S
Address range: 6100 to 6699
Direction: N-S
Address range: 6100 to 6699
Perkins Rd
Length: 0.61 miles
Directions: N-S, SW-NE
Address range: 5700 to 6299
Directions: N-S, SW-NE
Address range: 5700 to 6299
Magellan Ave
Length: 0.08 miles
Direction: E-W
Address range: 600 to 699
Direction: E-W
Address range: 600 to 699
Railroad features:
Ventura County Rlwy
Length: 2.21 miles
Directions: E-W, N-S, SE-NW, SW-NE
Directions: E-W, N-S, SE-NW, SW-NE
Other features:
Jeep Trl
Length: 1.10 miles
Directions: E-W, N-S, SW-NE
Directions: E-W, N-S, SW-NE