Pleasant Valley Village neighborhood in Oxnard, California (CA), 93033 detailed profile
Settings
X

Business Search - 14 Million verified businesses
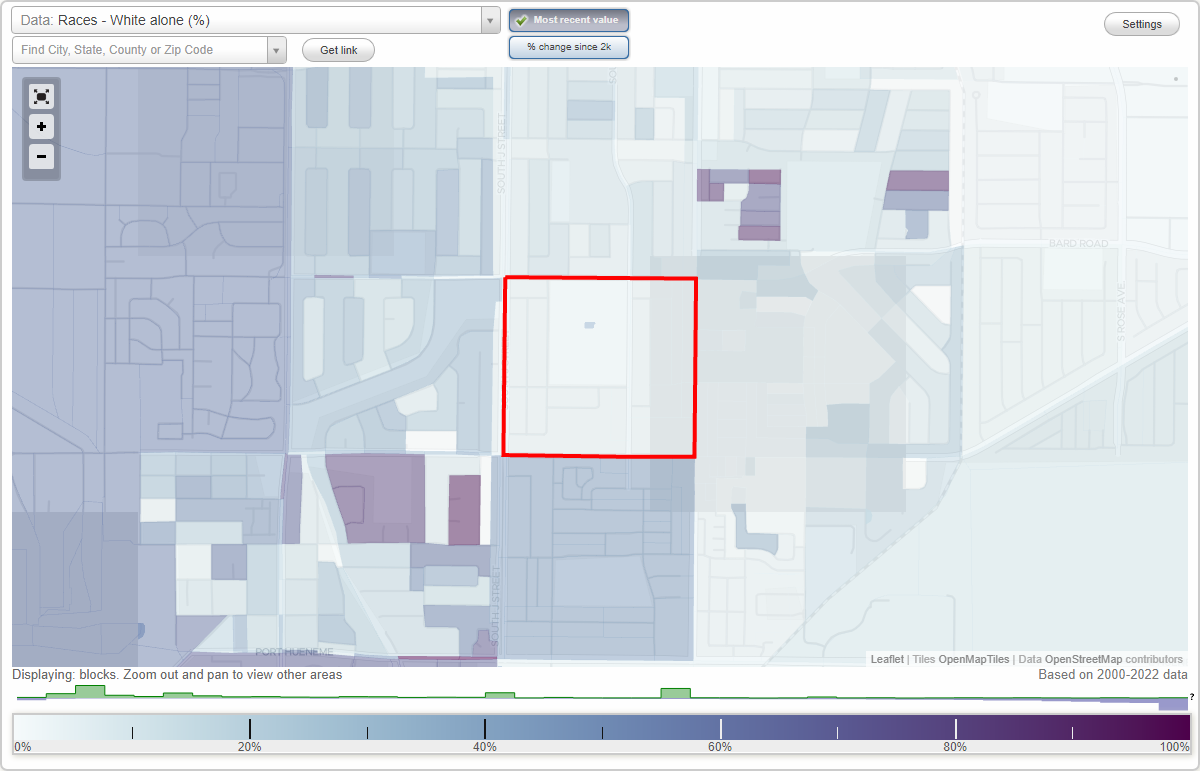
Area: 0.205 square miles
Population: 1,720
Population density:
| Pleasant Valley Village: | 8,389 people per square mile |
| Oxnard: | 7,918 people per square mile |

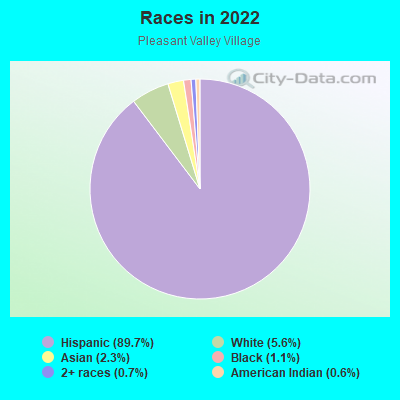
- 1,54089.7%Hispanic or Latino
- 965.6%White
- 392.3%Asian
- 191.1%Black
- 120.7%Two or more races
- 110.6%American Indian
Median household income in 2022:
| Pleasant Valley Village: | $86,563 |
| Oxnard: | $84,941 |
Distribution of median household income
![Distribution of median household income]()
- 4Less than $10,000
- 9$10,000 to $19,999
- 15$20,000 to $29,999
- 8$30,000 to $39,999
- 49$40,000 to $49,999
- 10$50,000 to $59,999
- 62$60,000 to $74,999
- 40$75,000 to $99,999
- 34$100,000 to $124,999
- 27$125,000 to $149,999
- 36$150,000 to $199,999
- 47$200,000 or more

Distribution of owner-occupied house/condo value
![Distribution of owner-occupied house/condo value]()
- 4Less than $50,000
- 7$50,000 to $99,999
- 4$100,000 to $149,999
- 15$300,000 to $399,999
- 59$400,000 to $499,999
- 104$500,000 to $749,999
- 6$750,000 to $999,999

Distribution of rent paid by renters
![Distribution of rent paid by renters]()
- 6$300 to $399
- 3$900 to $999
- 10$1,000 to $1,249
- 7$1,250 to $1,499
- 51$1,500 to $1,999
- 62$2,000 or more

Median rent in 2022:
| Pleasant Valley Village: | $1,935 |
| Oxnard: | $1,876 |
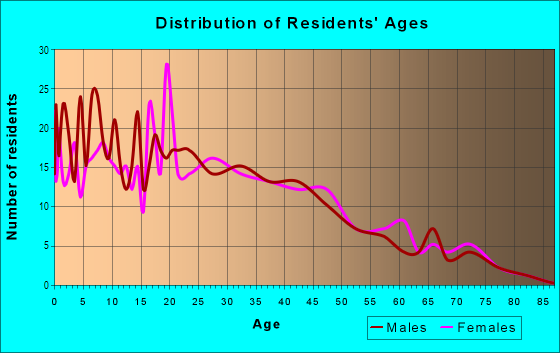
| Males: | 877 |
| Females: | 842 |
Males:
| This neighborhood: | 30.6 years |
| Whole city: | 35.1 years |
| This neighborhood: | 30.5 years |
| Whole city: | 34.3 years |
Average household size:
| Pleasant Valley Village: | 5.2 people |
| Oxnard: | 3.6 people |
Percentage of family households:
| Pleasant Valley Village: | 63.9% |
| Oxnard: | 51.5% |
| Here: | 64.0% |
| Oxnard: | 47.9% |
Percentage of married-couple families with children (among all households):
| Pleasant Valley Village: | 16.7% |
| Oxnard: | 16.4% |
Percentage of single-mother households (among all households):
| Pleasant Valley Village: | 2.6% |
| Oxnard: | 8.1% |
Percentage of never married males 15 years old and over:
Percentage of never married females 15 years old and over:
| Pleasant Valley Village: | 23.4% |
| Oxnard: | 22.9% |
Percentage of never married females 15 years old and over:
| Pleasant Valley Village: | 18.5% |
| city: | 20.1% |
Percentage of people that speak English not well or not at all:
| Pleasant Valley Village: | 0.0% |
| Oxnard: | 20.2% |
Percentage of people born in this state:
Percentage of people born in another U.S. state:
Percentage of native residents but born outside the U.S.:
Percentage of foreign born residents:
| Here: | 57.1% |
| Oxnard: | 58.8% |
Percentage of people born in another U.S. state:
| Pleasant Valley Village: | 3.1% |
| Oxnard: | 6.5% |
Percentage of native residents but born outside the U.S.:
| Here: | 1.6% |
| city: | 1.4% |
Percentage of foreign born residents:
| Here: | 38.2% |
| Oxnard: | 33.3% |
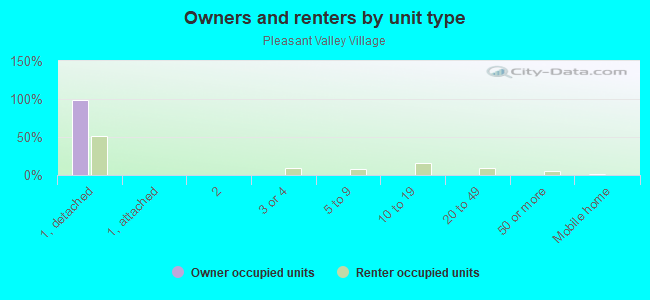
Owner-occupied
Renter-occupied

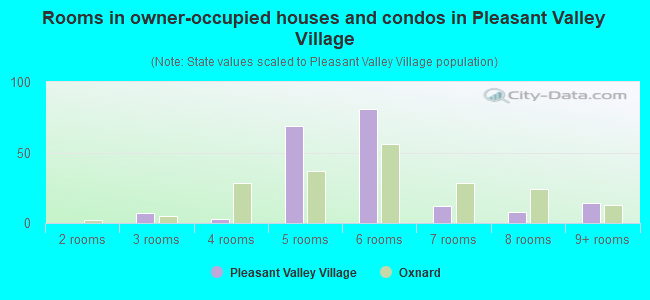
- Rooms in owner-occupied houses and condos in Pleasant Valley Village
- 01 room
- 02 rooms
- 73 rooms
- 34 rooms
- 695 rooms
- 816 rooms
- 127 rooms
- 88 rooms
- 149+ rooms
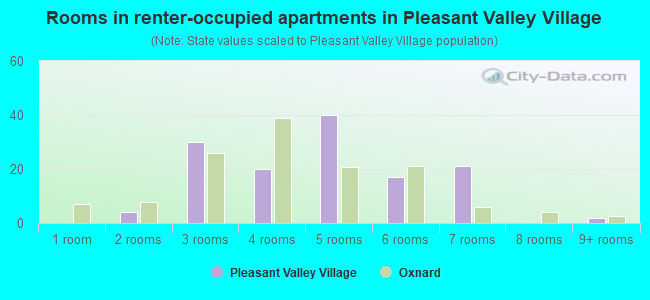
- Rooms in renter-occupied apartments in Pleasant Valley Village
- 01 room
- 42 rooms
- 303 rooms
- 204 rooms
- 405 rooms
- 176 rooms
- 217 rooms
- 08 rooms
- 29+ rooms
Owner-occupied
Renter-occupied
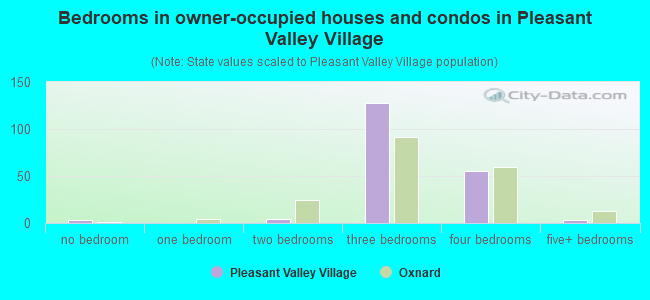
- Bedrooms in owner-occupied houses and condos in Pleasant Valley Village
- 3no bedroom
- 01 bedroom
- 42 bedrooms
- 1283 bedrooms
- 554 bedrooms
- 35+ bedrooms
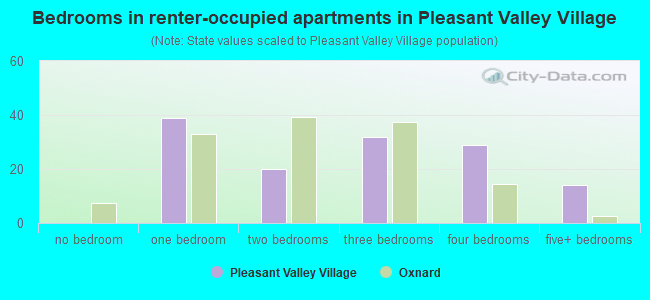
- Bedrooms in renter-occupied apartments in Pleasant Valley Village
- 0no bedroom
- 391 bedroom
- 202 bedrooms
- 323 bedrooms
- 294 bedrooms
- 145+ bedrooms
Average number of cars or other vehicles available in houses/condos:
Average number of cars or other vehicles available in apartments:
| This neighborhood: | 2.7 |
| Oxnard: | 2.5 |
Average number of cars or other vehicles available in apartments:
| Here: | 2.4 |
| city: | 1.9 |
Percentage of units with a mortgage:
| Pleasant Valley Village: | 47.7% |
| Oxnard: | 65.5% |
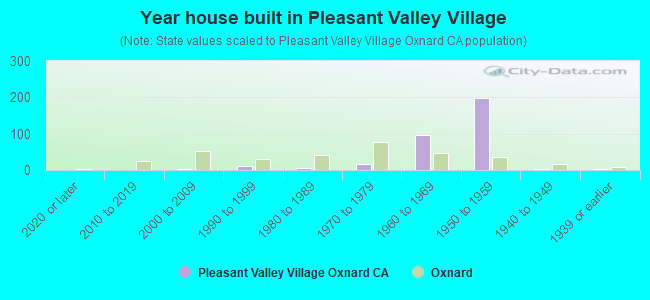
- Year house built in Pleasant Valley Village
- 02020 or later
- 02010 to 2019
- 22000 to 2009
- 121990 to 1999
- 51980 to 1989
- 161970 to 1979
- 971960 to 1969
- 1971950 to 1959
- 31940 to 1949
- 21939 or earlier
City-data.com crime index for city in 2020 (higher means more crime):
| City: | 220.0 |
| U.S. average: | 219.5 |
Travel time to work (commute)
![Travel time to work (commute)]()
- 365 to 9 minutes
- 2110 to 14 minutes
- 5915 to 19 minutes
- 5720 to 24 minutes
- 51725 to 29 minutes
- 10030 to 34 minutes
- 135 to 39 minutes
- 1540 to 44 minutes
- 1845 to 59 minutes
- 360 to 89 minutes
- 1090 or more minutes

Means of transportation to work
![Means of transportation to work]()
- 77.3%670Drove a car alone
- 17.9%155Carpooled
- 0.8%7Bus
- 0.6%5Bicycle
- 0.6%5Walked
- 0.1%1Other means
- 2.4%21Worked at home

Time leaving home to go to work
![Time leaving home to go to work]()
- 3512:00 a.m. to 4:59 a.m.
- 625:00 a.m. to 5:29 a.m.
- 1255:30 a.m. to 5:59 a.m.
- 1986:00 a.m. to 6:29 a.m.
- 1106:30 a.m. to 6:59 a.m.
- 797:00 a.m. to 7:29 a.m.
- 747:30 a.m. to 7:59 a.m.
- 578:00 a.m. to 8:29 a.m.
- 249:00 a.m. to 9:59 a.m.
- 410:00 a.m. to 10:59 a.m.
- 5912:00 p.m. to 3:59 p.m.
- 134:00 p.m. to 11:59 p.m.

Occupations of males:
- Percentage of males in management occupations (except farmers):
Here: 2.6% city: 6.2%
- Percentage of males in business and financial operations occupations:
Here: 2.2% city: 2.6%
- Percentage of males in computer and mathematical occupations:
Here: 1.0% city: 2.4%
- Percentage of males in architecture and engineering occupations:
Here: 2.5% city: 3.1%
- Percentage of males in community and social services occupations:
Here: 1.3% city: 0.8%
- Percentage of males in arts, design, entertainment, sports, and media occupations:
Here: 2.2% city: 1.1%
- Percentage of males in service occupations:
Here: 15.7% city: 16.9%
- Percentage of males in sales and office occupations:
Here: 9.3% city: 11.7%
- Percentage of males in farming, fishing, and forestry occupations:
Here: 16.9% city: 14.1%
- Percentage of males in construction, extraction, and maintenance occupations:
Here: 10.1% city: 9.8%
- Percentage of males in production occupations:
Here: 7.3% city: 9.6%
- Percentage of males in transportation occupations:
Here: 7.0% city: 6.5%
- Percentage of males in material moving occupations:
Here: 14.7% city: 6.3%
Occupations of females:
- Percentage of females in business and financial operations occupations:
Here: 3.2% city: 5.3%
- Percentage of females in computer and mathematical occupations:
Here: 1.7% city: 0.9%
- Percentage of females in community and social services occupations:
Here: 1.1% city: 2.4%
- Percentage of females in education, training, and library occupations:
Here: 1.9% city: 4.9%
- Percentage of females in arts, design, entertainment, sports, and media occupations:
Here: 1.5% city: 1.5%
- Percentage of females in healthcare practitioners and technical occupations:
Here: 4.8% city: 5.9%
- Percentage of females in service occupations:
Here: 25.6% city: 23.6%
- Percentage of females in sales and office occupations:
Here: 27.5% city: 27.3%
- Percentage of females in farming, fishing, and forestry occupations:
Here: 13.9% city: 8.0%
- Percentage of females in production occupations:
Here: 11.0% city: 6.8%
- Percentage of females in material moving occupations:
Here: 6.9% city: 3.7%
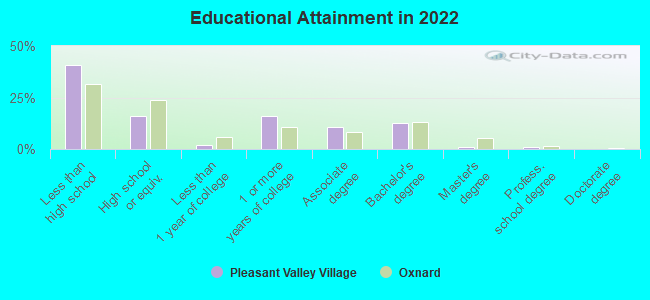
Education in this neighborhood (subdivision or community):
- Percentage of people 3 years and older in K-12 schools:
Pleasant Valley Village: 21.3% Oxnard: 21.0%
- Percentage of people 3 years and older in undergraduate colleges:
Pleasant Valley Village: 6.2% Oxnard: 5.2%
- Percentage of people 3 years and older in grad. or professional schools:
Pleasant Valley Village: 0.9% Oxnard: 0.8%
- Percentage of students K-12 enrolled in private schools:
Pleasant Valley Village: 0.0% Oxnard: 4.0%
Percentage of population below poverty level:
| Pleasant Valley Village: | 7.0% |
| Oxnard: | 12.8% |
Median year owner moved in (as recorded in 2022):
Median year renter moved in (as recorded in 2022):
| Pleasant Valley Village: | 1998 |
| Oxnard: | 2006 |
Median year renter moved in (as recorded in 2022):
| Pleasant Valley Village: | 2015 |
| Oxnard: | 2019 |
Percentage of married-couple families with both working:
| Pleasant Valley Village: | 65.9% |
| Oxnard: | 71.8% |
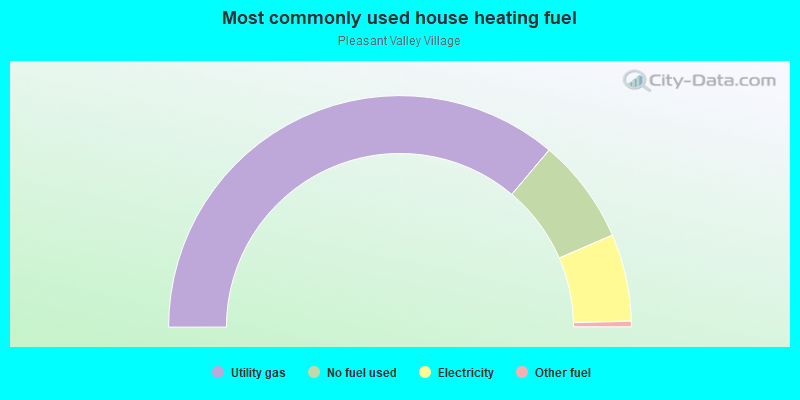
- 72.3%Utility gas
- 14.7%No fuel used
- 12.2%Electricity
- 0.8%Other fuel
Roads and streets:
W Pleasant Valley Rd
Length: 0.56 miles
Direction: E-W
Address range: 1 to 763
Direction: E-W
Address range: 1 to 763
S C St
Length: 0.39 miles
Direction: N-S
Address range: 4400 to 5099
Direction: N-S
Address range: 4400 to 5099
J St
Length: 0.39 miles
Direction: N-S
Address range: 4400 to 5040
Direction: N-S
Address range: 4400 to 5040
Van Ness Ave
Length: 0.36 miles
Direction: E-W
Address range: 300 to 799
Direction: E-W
Address range: 300 to 799
Saviers Rd
Length: 0.36 miles
Direction: N-S
Address range: 4300 to 5099
Direction: N-S
Address range: 4300 to 5099
S F St
Length: 0.34 miles
Directions: N-S, SW-NE
Address range: 4300 to 4999
Directions: N-S, SW-NE
Address range: 4300 to 4999
S G St
Length: 0.33 miles
Direction: N-S
Address range: 4400 to 5099
Direction: N-S
Address range: 4400 to 5099
S B St
Length: 0.26 miles
Direction: N-S
Address range: 4400 to 4899
Direction: N-S
Address range: 4400 to 4899
Brucker Rd
Length: 0.24 miles
Direction: E-W
Address range: 200 to 781
Direction: E-W
Address range: 200 to 781
S A St
Length: 0.21 miles
Direction: N-S
Address range: 4400 to 4799
Direction: N-S
Address range: 4400 to 4799
Sherwood Way
Length: 0.15 miles
Directions: E-W, SW-NE
Address range: 400 to 599
Directions: E-W, SW-NE
Address range: 400 to 599
W Dollie St
Length: 0.14 miles
Direction: E-W
Address range: 1 to 299
Direction: E-W
Address range: 1 to 299
Rosa St
Length: 0.13 miles
Direction: E-W
Address range: 200 to 399
Direction: E-W
Address range: 200 to 399
Sonoma Way
Length: 0.11 miles
Direction: E-W
Address range: 600 to 799
Direction: E-W
Address range: 600 to 799
del Oro Pl
Length: 0.05 miles
Directions: N-S, SW-NE
Address range: 4800 to 4899
Directions: N-S, SW-NE
Address range: 4800 to 4899