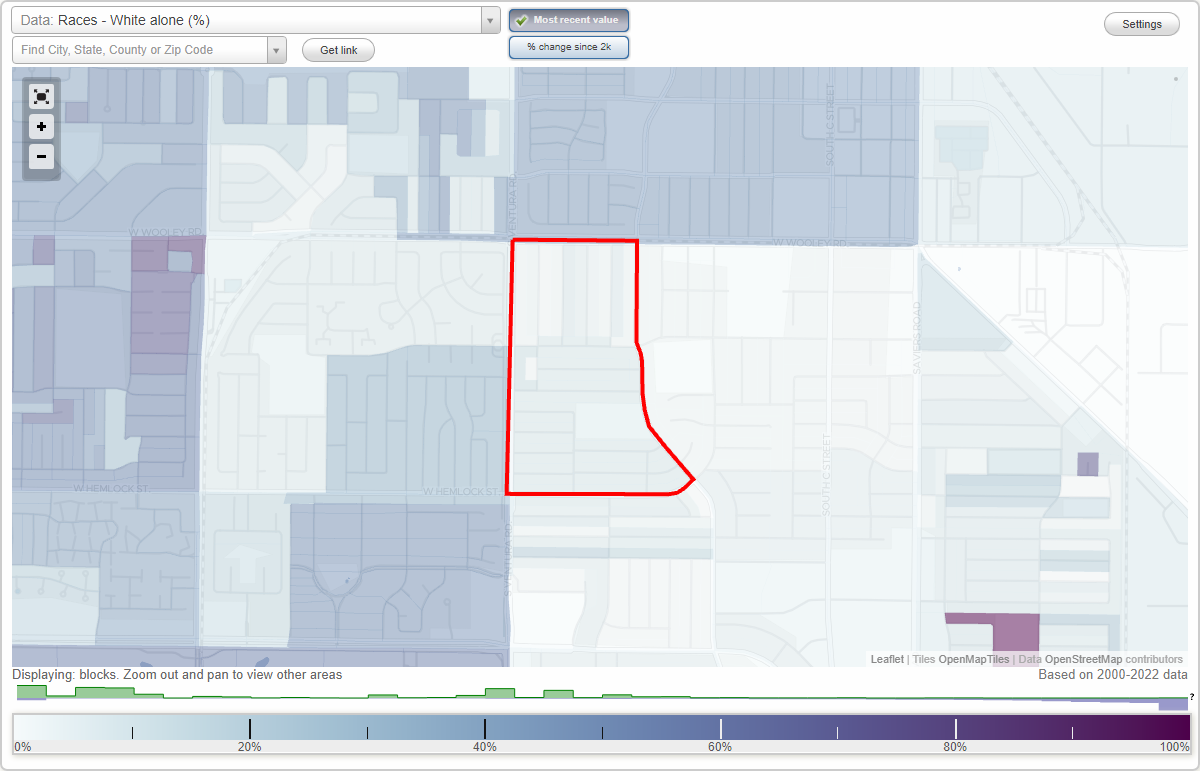
Bartolo Square North neighborhood in Oxnard, California (CA), 93033 detailed profile
Settings
X

Business Search - 14 Million verified businesses
Area: 0.212 square miles
Population: 1,264
Population density:
| Bartolo Square North: | 5,954 people per square mile |
| Oxnard: | 7,918 people per square mile |

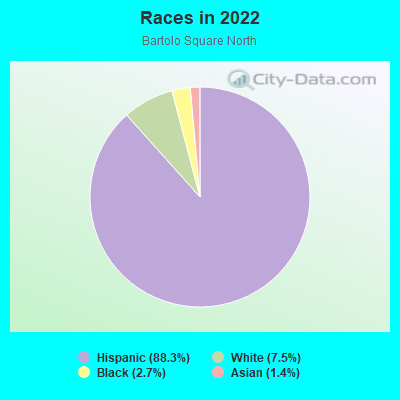
- 1,12988.3%Hispanic or Latino
- 967.5%White
- 352.7%Black
- 181.4%Asian
Median household income in 2022:
| Bartolo Square North: | $71,135 |
| Oxnard: | $84,941 |
Distribution of median household income
![Distribution of median household income]()
- 28Less than $10,000
- 12$10,000 to $19,999
- 78$20,000 to $29,999
- 45$30,000 to $39,999
- 17$40,000 to $49,999
- 20$50,000 to $59,999
- 61$60,000 to $74,999
- 39$75,000 to $99,999
- 14$100,000 to $124,999
- 25$125,000 to $149,999
- 48$150,000 to $199,999
- 8$200,000 or more

Distribution of owner-occupied house/condo value
![Distribution of owner-occupied house/condo value]()
- 8Less than $50,000
- 20$50,000 to $99,999
- 4$200,000 to $249,999
- 20$300,000 to $399,999
- 42$400,000 to $499,999
- 161$500,000 to $749,999
- 4$750,000 to $999,999

Distribution of rent paid by renters
![Distribution of rent paid by renters]()
- 12$500 to $599
- 28$700 to $799
- 23$1,250 to $1,499
- 89$1,500 to $1,999
- 70$2,000 or more

Median rent in 2022:
| Bartolo Square North: | $854 |
| Oxnard: | $1,876 |
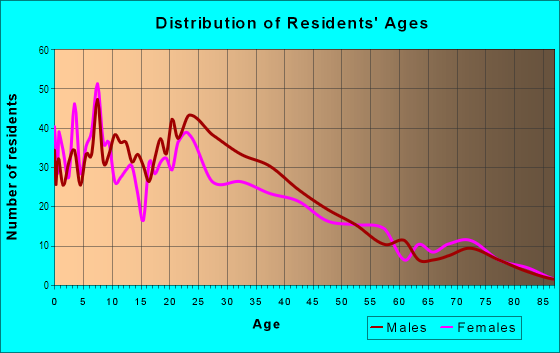
| Males: | 575 |
| Females: | 688 |
Males:
| This neighborhood: | 28.0 years |
| Whole city: | 35.1 years |
| This neighborhood: | 35.8 years |
| Whole city: | 34.3 years |
Average household size:
| Bartolo Square North: | 4.7 people |
| Oxnard: | 3.6 people |
Percentage of family households:
| Bartolo Square North: | 62.2% |
| Oxnard: | 51.5% |
| Here: | 49.7% |
| Oxnard: | 47.9% |
Percentage of married-couple families with children (among all households):
| Bartolo Square North: | 12.7% |
| Oxnard: | 16.4% |
Percentage of single-mother households (among all households):
| Bartolo Square North: | 10.2% |
| Oxnard: | 8.1% |
Percentage of never married males 15 years old and over:
Percentage of never married females 15 years old and over:
| Bartolo Square North: | 22.8% |
| Oxnard: | 22.9% |
Percentage of never married females 15 years old and over:
| Bartolo Square North: | 23.3% |
| city: | 20.1% |
Percentage of people that speak English not well or not at all:
| Bartolo Square North: | 21.5% |
| Oxnard: | 20.2% |
Percentage of people born in this state:
Percentage of people born in another U.S. state:
Percentage of native residents but born outside the U.S.:
Percentage of foreign born residents:
| Here: | 54.6% |
| Oxnard: | 58.8% |
Percentage of people born in another U.S. state:
| Bartolo Square North: | 1.6% |
| Oxnard: | 6.5% |
Percentage of native residents but born outside the U.S.:
| Here: | 2.7% |
| city: | 1.4% |
Percentage of foreign born residents:
| Here: | 41.2% |
| Oxnard: | 33.3% |
Owner-occupied
Renter-occupied

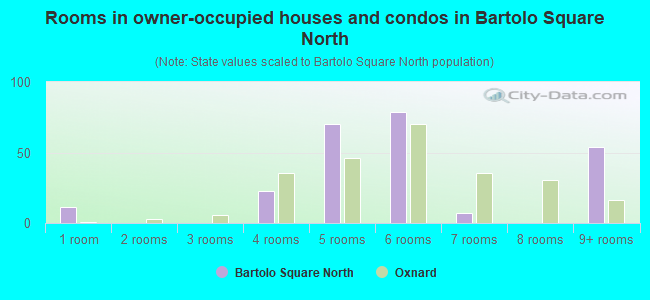
- Rooms in owner-occupied houses and condos in Bartolo Square North
- 111 room
- 02 rooms
- 03 rooms
- 234 rooms
- 705 rooms
- 796 rooms
- 77 rooms
- 08 rooms
- 549+ rooms
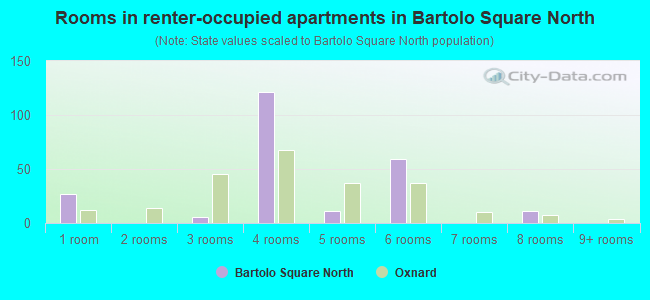
- Rooms in renter-occupied apartments in Bartolo Square North
- 271 room
- 02 rooms
- 63 rooms
- 1214 rooms
- 115 rooms
- 596 rooms
- 07 rooms
- 118 rooms
- 09+ rooms
Owner-occupied
Renter-occupied
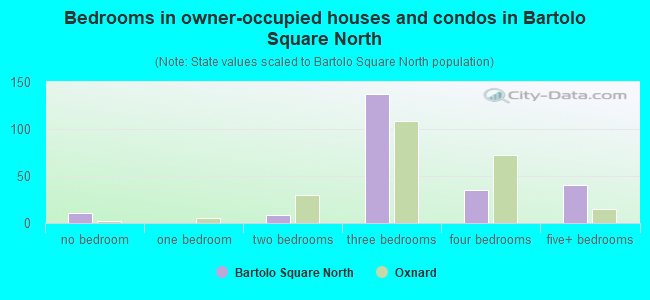
- Bedrooms in owner-occupied houses and condos in Bartolo Square North
- 11no bedroom
- 01 bedroom
- 92 bedrooms
- 1373 bedrooms
- 354 bedrooms
- 405+ bedrooms
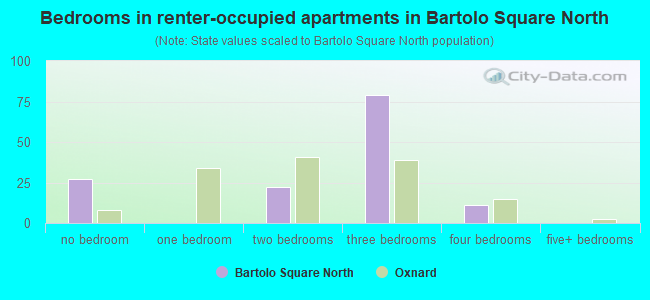
- Bedrooms in renter-occupied apartments in Bartolo Square North
- 27no bedroom
- 01 bedroom
- 222 bedrooms
- 793 bedrooms
- 114 bedrooms
- 05+ bedrooms
Average number of cars or other vehicles available in houses/condos:
Average number of cars or other vehicles available in apartments:
| This neighborhood: | 2.6 |
| Oxnard: | 2.5 |
Average number of cars or other vehicles available in apartments:
| Here: | 2.4 |
| city: | 1.9 |
Percentage of units with a mortgage:
| Bartolo Square North: | 51.4% |
| Oxnard: | 65.5% |
Average estimated value of detached houses in 2022 (87.1% of all units):
| Bartolo Square North: | $531,865 |
| Oxnard: | $645,968 |
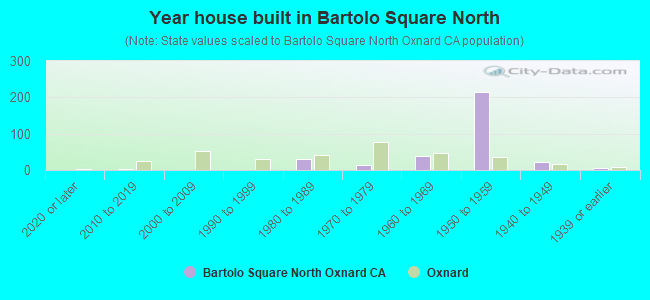
- Year house built in Bartolo Square North
- 02020 or later
- 42010 to 2019
- 02000 to 2009
- 11990 to 1999
- 301980 to 1989
- 151970 to 1979
- 381960 to 1969
- 2151950 to 1959
- 231940 to 1949
- 61939 or earlier
City-data.com crime index for city in 2020 (higher means more crime):
| City: | 220.0 |
| U.S. average: | 219.5 |
Travel time to work (commute)
![Travel time to work (commute)]()
- 20Less than 5 minutes
- 235 to 9 minutes
- 8710 to 14 minutes
- 10815 to 19 minutes
- 27920 to 24 minutes
- 1,00525 to 29 minutes
- 17730 to 34 minutes
- 6640 to 44 minutes
- 4945 to 59 minutes
- 3260 to 89 minutes
- 5690 or more minutes

Means of transportation to work
![Means of transportation to work]()
- 72.3%410Drove a car alone
- 20.5%116Carpooled
- 2.1%12Bus
- 0.5%3Bicycle
- 7.8%44Worked at home

Time leaving home to go to work
![Time leaving home to go to work]()
- 8412:00 a.m. to 4:59 a.m.
- 2285:00 a.m. to 5:29 a.m.
- 2015:30 a.m. to 5:59 a.m.
- 3426:00 a.m. to 6:29 a.m.
- 786:30 a.m. to 6:59 a.m.
- 2277:00 a.m. to 7:29 a.m.
- 527:30 a.m. to 7:59 a.m.
- 3138:00 a.m. to 8:29 a.m.
- 548:30 a.m. to 8:59 a.m.
- 729:00 a.m. to 9:59 a.m.
- 5910:00 a.m. to 10:59 a.m.
- 6011:00 a.m. to 11:59 a.m.
- 7412:00 p.m. to 3:59 p.m.
- 474:00 p.m. to 11:59 p.m.

Occupations of males:
- Percentage of males in management occupations (except farmers):
Here: 1.5% city: 6.2%
- Percentage of males in community and social services occupations:
Here: 3.4% city: 0.8%
- Percentage of males in education, training, and library occupations:
Here: 5.5% city: 1.7%
- Percentage of males in service occupations:
Here: 15.5% city: 16.9%
- Percentage of males in sales and office occupations:
Here: 17.2% city: 11.7%
- Percentage of males in farming, fishing, and forestry occupations:
Here: 3.5% city: 14.1%
- Percentage of males in construction, extraction, and maintenance occupations:
Here: 8.4% city: 9.8%
- Percentage of males in production occupations:
Here: 12.4% city: 9.6%
- Percentage of males in transportation occupations:
Here: 3.6% city: 6.5%
- Percentage of males in material moving occupations:
Here: 24.6% city: 6.3%
Occupations of females:
- Percentage of females in business and financial operations occupations:
Here: 4.6% city: 5.3%
- Percentage of females in community and social services occupations:
Here: 6.1% city: 2.4%
- Percentage of females in education, training, and library occupations:
Here: 1.6% city: 4.9%
- Percentage of females in healthcare practitioners and technical occupations:
Here: 1.5% city: 5.9%
- Percentage of females in service occupations:
Here: 19.4% city: 23.6%
- Percentage of females in sales and office occupations:
Here: 63.4% city: 27.3%
- Percentage of females in farming, fishing, and forestry occupations:
Here: 2.6% city: 8.0%
- Percentage of females in production occupations:
Here: 12.0% city: 6.8%
- Percentage of females in material moving occupations:
Here: 27.5% city: 3.7%
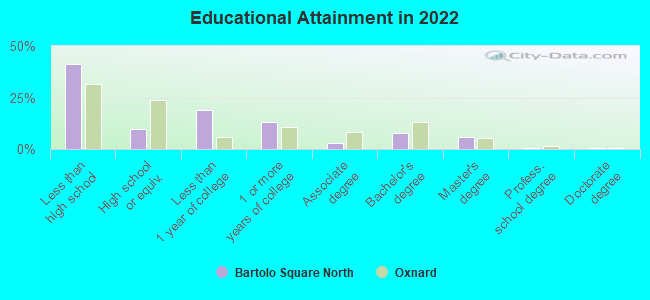
Education in this neighborhood (subdivision or community):
- Percentage of people 3 years and older in K-12 schools:
Bartolo Square North: 30.1% Oxnard: 21.0%
- Percentage of people 3 years and older in undergraduate colleges:
Bartolo Square North: 4.3% Oxnard: 5.2%
- Percentage of people 3 years and older in grad. or professional schools:
Bartolo Square North: 0.4% Oxnard: 0.8%
- Percentage of students K-12 enrolled in private schools:
Bartolo Square North: 1.7% Oxnard: 4.0%
Percentage of population below poverty level:
| Bartolo Square North: | 16.0% |
| Oxnard: | 12.8% |
Median year owner moved in (as recorded in 2022):
Median year renter moved in (as recorded in 2022):
| Bartolo Square North: | 1992 |
| Oxnard: | 2006 |
Median year renter moved in (as recorded in 2022):
| Bartolo Square North: | 2016 |
| Oxnard: | 2019 |
Percentage of married-couple families with both working:
| Bartolo Square North: | 38.7% |
| Oxnard: | 71.8% |
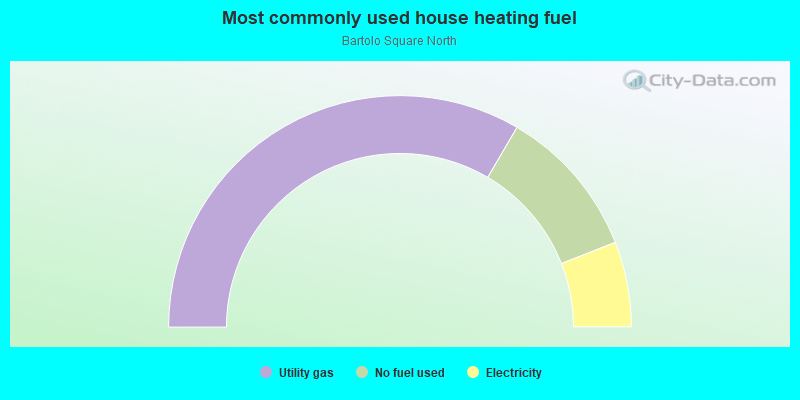
- 66.9%Utility gas
- 21.2%No fuel used
- 11.9%Electricity
Roads and streets:
S J St
Length: 0.64 miles
Directions: N-S, SE-NW
Address range: 1100 to 1899
Directions: N-S, SE-NW
Address range: 1100 to 1899
S N St
Length: 0.54 miles
Directions: N-S, SE-NW
Address range: 1100 to 1949
Directions: N-S, SE-NW
Address range: 1100 to 1949
W Guava St
Length: 0.50 miles
Directions: E-W, SW-NE
Address range: 900 to 1499
Directions: E-W, SW-NE
Address range: 900 to 1499
W Fir Ave
Length: 0.45 miles
Directions: E-W, SW-NE
Address range: 1000 to 1499
Directions: E-W, SW-NE
Address range: 1000 to 1499
W Cedar St
Length: 0.38 miles
Direction: E-W
Address range: 1100 to 1499
Direction: E-W
Address range: 1100 to 1499
Hill St
Length: 0.36 miles
Direction: E-W
Address range: 1100 to 1483
Direction: E-W
Address range: 1100 to 1483
W Wooley Rd
Length: 0.36 miles
Direction: E-W
Address range: 1100 to 1582
Direction: E-W
Address range: 1100 to 1582
S L St
Length: 0.33 miles
Direction: N-S
Address range: 1100 to 1949
Direction: N-S
Address range: 1100 to 1949
W Birch St
Length: 0.31 miles
Direction: E-W
Address range: 1100 to 1399
Direction: E-W
Address range: 1100 to 1399
S M St
Length: 0.25 miles
Direction: N-S
Address range: 115 to 1299
Direction: N-S
Address range: 115 to 1299
S K St
Length: 0.25 miles
Direction: N-S
Address range: 112 to 1299
Direction: N-S
Address range: 112 to 1299
W Elm St
Length: 0.18 miles
Direction: E-W
Address range: 1300 to 1499
Direction: E-W
Address range: 1300 to 1499
W Date St
Length: 0.18 miles
Directions: E-W, SE-NW
Address range: 1300 to 1499
Directions: E-W, SE-NW
Address range: 1300 to 1499
W Hemlock St
Length: 0.06 miles
Directions: E-W, SW-NE
Address range: 800 to 911
Directions: E-W, SW-NE
Address range: 800 to 911