Estimated zip code population in 2022: 26,067 Zip code population in 2010: 27,732 Zip code population in 2000: 25,321
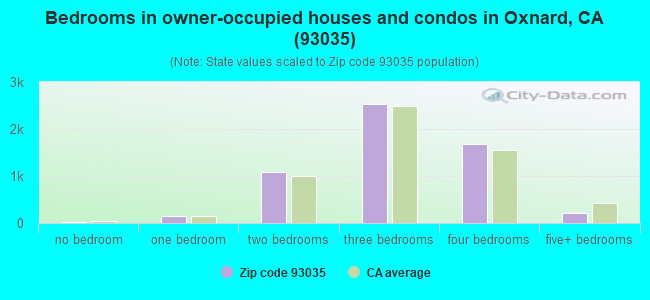
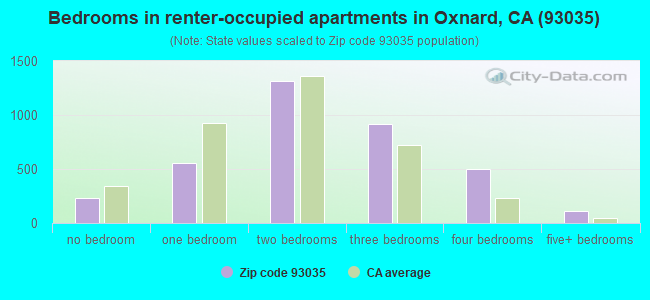
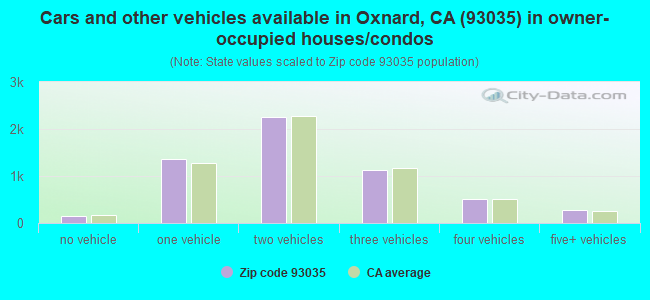
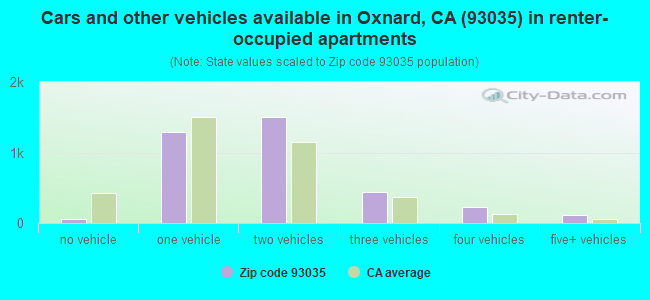
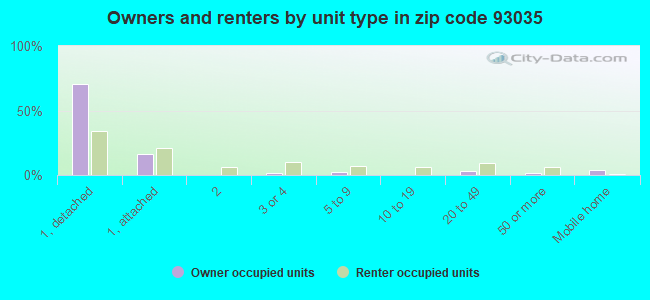
Houses and condos: 12,052 Renter-occupied apartments: 3,633
% of renters here:
39%
State:
44%
March 2022 cost of living index in zip code 93035: 92.9 (less than average, U.S. average is 100)
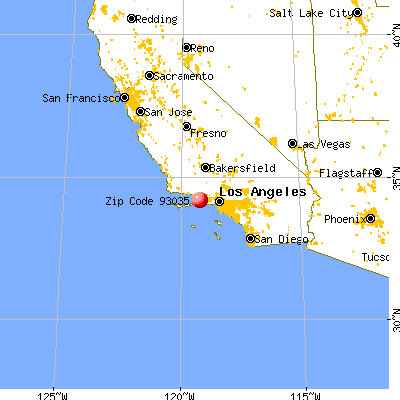
Land area: 4.1 sq. mi. Water area: 0.8 sq. mi.
Population density: 6,335 people per square mile
(high).
OSM Map
General Map
Google Map
MSN Map
OSM Map
General Map
Google Map
MSN Map
OSM Map
General Map
Google Map
MSN Map
OSM Map
General Map
Google Map
MSN Map
Please wait while loading the map...
Real estate property taxes paid for housing units in 2022:
This zip code:
0.7% ($5,448)
California:
0.7% ($4,831)
Median real estate property taxes paid for housing units with mortgages in 2022: $5,685 (0.8%) Median real estate property taxes paid for housing units with no mortgage in 2022: $4,937 (0.6%)
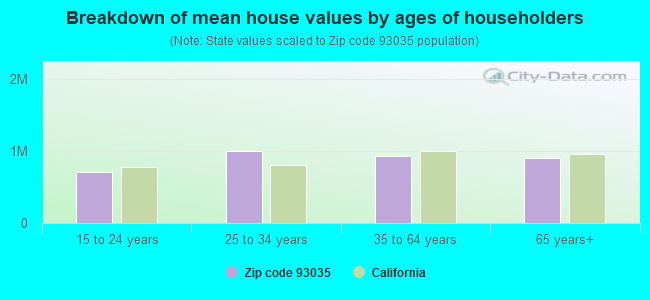
Estimated median house/condo value in 2022: $745,218
93035:
$745,218
California:
$715,900
According to our research of California and other state lists, there were 26 registered sex offenders living in 93035 zip code as of May 08, 2024. The ratio of all residents to sex offenders in zip code 93035 is 1,102 to 1. The ratio of registered sex offenders to all residents in this zip code is lower than the state average.
Median resident age:
This zip code:
43.8 years
California median age:
37.9 years
Average household size:
This zip code:
2.8 people
California:
2.8 people
Averages for the 2020 tax year for zip code 93035, filed in 2021:
Average Adjusted Gross Income (AGI) in 2020: $81,123 (Individual Income Tax Returns)
Here:
$81,123
State:
$95,910
Salary/wage: $64,611 (reported on 77.4% of returns)
Here:
$64,611
State:
$77,331
(% of AGI for various income ranges: 1262.6% for AGIs below $25k, 4116.3% for AGIs $25k-50k, 7518.1% for AGIs $50k-75k, 9996.9% for AGIs $75k-100k, 19105.1% for AGIs $100k-200k, 80056.8% for AGIs over 200k)
Taxable interest for individuals: $1,977 (reported on 38.2% of returns)
This zip code:
$1,977
California:
$2,294
(% of AGI for various income ranges: 24.0% for AGIs below $25k, 30.9% for AGIs $25k-50k, 70.2% for AGIs $50k-75k, 103.8% for AGIs $75k-100k, 240.0% for AGIs $100k-200k, 2212.7% for AGIs over 200k)
Ordinary dividends: $7,975 (reported on 20.4% of returns)
Here:
$7,975
State:
$10,949
(% of AGI for various income ranges: 36.9% for AGIs below $25k, 56.5% for AGIs $25k-50k, 117.2% for AGIs $50k-75k, 188.2% for AGIs $75k-100k, 521.4% for AGIs $100k-200k, 5333.2% for AGIs over 200k)
Net capital gain/loss in AGI: +$25,351 (reported on 20.3% of returns)
Here:
+$25,351
State:
+$49,306
(% of AGI for various income ranges: 23.5% for AGIs below $25k, 39.9% for AGIs $25k-50k, 124.3% for AGIs $50k-75k, 192.2% for AGIs $75k-100k, 780.4% for AGIs $100k-200k, 27278.6% for AGIs over 200k)
Profit/loss from business: +$18,014 (reported on 17.0% of returns)
Here:
+$18,014
State:
+$15,671
(% of AGI for various income ranges: 186.1% for AGIs below $25k, 269.2% for AGIs $25k-50k, 290.4% for AGIs $50k-75k, 345.2% for AGIs $75k-100k, 723.8% for AGIs $100k-200k, 8235.5% for AGIs over 200k)
Taxable individual retirement arrangement distribution: $24,499 (reported on 8.7% of returns)
93035:
$24,499
California:
$23,505
(% of AGI for various income ranges: 50.1% for AGIs below $25k, 89.3% for AGIs $25k-50k, 245.7% for AGIs $50k-75k, 420.0% for AGIs $75k-100k, 943.7% for AGIs $100k-200k, 4052.7% for AGIs over 200k)
Self-employed (Keogh) retirement plans: $32,417 (reported on 0.8% of returns)
93035:
$32,417
California:
$30,163
(% of AGI for various income ranges: 14.5% for AGIs $25k-50k, 47.1% for AGIs $100k-200k, 1361.8% for AGIs over 200k)
Total itemized deductions: $34,052 (reported on 18.4% of returns)
Here:
$34,052
State:
$39,517
(% of AGI for various income ranges: 150.5% for AGIs below $25k, 264.4% for AGIs $25k-50k, 727.8% for AGIs $50k-75k, 1333.9% for AGIs $75k-100k, 2634.3% for AGIs $100k-200k, 12269.1% for AGIs over 200k)
Charity contributions: $5,473 (reported on 15.2% of returns)
Here:
$5,473
State:
$12,598
(% of AGI for various income ranges: 6.4% for AGIs below $25k, 28.0% for AGIs $25k-50k, 61.0% for AGIs $50k-75k, 131.4% for AGIs $75k-100k, 374.1% for AGIs $100k-200k, 2124.1% for AGIs over 200k)
Taxes paid: $8,723 (reported on 18.4% of returns)
93035:
$8,723
State:
$8,807
(% of AGI for various income ranges: 30.0% for AGIs below $25k, 65.3% for AGIs $25k-50k, 198.5% for AGIs $50k-75k, 402.9% for AGIs $75k-100k, 769.9% for AGIs $100k-200k, 2405.9% for AGIs over 200k)
Earned income credit: $1,784 (reported on 10.9% of returns)
Here:
$1,784
State:
$2,074
(% of AGI for various income ranges: 72.6% for AGIs below $25k, 49.7% for AGIs $25k-50k, 0.9% for AGIs $50k-75k)
Percentage of individuals using paid preparers for their 2020 taxes: 92.9%
Here:
93%
State:
92%
(% for various income ranges: 91.7% for AGIs below $25k, 92.7% for AGIs $25k-50k, 93.7% for AGIs $50k-75k, 93.7% for AGIs $75k-100k, 93.3% for AGIs $100k-200k, 94.6% for AGIs over 200k)
Averages for the 2012 tax year for zip code 93035, filed in 2013:
Average Adjusted Gross Income (AGI) in 2012: $64,618 (Individual Income Tax Returns)
Here:
$64,618
State:
$72,726
Salary/wage: $53,419 (reported on 80.4% of returns)
Here:
$53,419
State:
$59,079
(% of AGI for various income ranges: 74.2% for AGIs below $25k, 77.3% for AGIs $25k-50k, 75.4% for AGIs $50k-75k, 72.6% for AGIs $75k-100k, 69.2% for AGIs $100k-200k, 44.8% for AGIs over 200k)
Taxable interest for individuals: $1,989 (reported on 37.7% of returns)
This zip code:
$1,989
California:
$2,146
(% of AGI for various income ranges: 1.3% for AGIs below $25k, 0.6% for AGIs $25k-50k, 0.8% for AGIs $50k-75k, 0.8% for AGIs $75k-100k, 1.0% for AGIs $100k-200k, 2.1% for AGIs over 200k)
Ordinary dividends: $6,331 (reported on 18.6% of returns)
Here:
$6,331
State:
$9,308
(% of AGI for various income ranges: 1.7% for AGIs below $25k, 1.0% for AGIs $25k-50k, 1.4% for AGIs $50k-75k, 1.4% for AGIs $75k-100k, 1.4% for AGIs $100k-200k, 3.4% for AGIs over 200k)
Net capital gain/loss in AGI: +$17,187 (reported on 16.7% of returns)
Here:
+$17,187
State:
+$30,460
(% of AGI for various income ranges: 0.2% for AGIs $25k-50k, 0.4% for AGIs $50k-75k, 0.5% for AGIs $75k-100k, 1.5% for AGIs $100k-200k, 17.2% for AGIs over 200k)
Profit/loss from business: +$18,923 (reported on 16.9% of returns)
Here:
+$18,923
State:
+$17,064
(% of AGI for various income ranges: 10.5% for AGIs below $25k, 6.1% for AGIs $25k-50k, 3.0% for AGIs $50k-75k, 3.0% for AGIs $75k-100k, 3.2% for AGIs $100k-200k, 7.4% for AGIs over 200k)
Taxable individual retirement arrangement distribution: $20,158 (reported on 9.6% of returns)
93035:
$20,158
California:
$19,557
(% of AGI for various income ranges: 2.4% for AGIs below $25k, 2.2% for AGIs $25k-50k, 2.6% for AGIs $50k-75k, 3.0% for AGIs $75k-100k, 3.6% for AGIs $100k-200k, 3.1% for AGIs over 200k)
Self-employment retirement plans: $19,525 (reported on 0.9% of returns)
93035:
$19,525
California:
$24,530
(% of AGI for various income ranges: 0.4% for AGIs $50k-75k, 0.2% for AGIs $100k-200k, 0.7% for AGIs over 200k)
Total itemized deductions: $28,809 (26% of AGI, reported on 40.6% of returns)
Here:
$28,809
State:
$34,004
Here:
26.0% of AGI
State:
22.7% of AGI
(% of AGI for various income ranges: 14.8% for AGIs below $25k, 14.1% for AGIs $25k-50k, 18.2% for AGIs $50k-75k, 20.1% for AGIs $75k-100k, 20.1% for AGIs $100k-200k, 17.6% for AGIs over 200k)
Charity contributions: $3,101 (reported on 33.6% of returns)
Here:
$3,101
State:
$4,659
(% of AGI for various income ranges: 0.7% for AGIs below $25k, 1.0% for AGIs $25k-50k, 1.3% for AGIs $50k-75k, 1.7% for AGIs $75k-100k, 1.8% for AGIs $100k-200k, 2.2% for AGIs over 200k)
Taxes paid: $10,319 (reported on 40.5% of returns)
93035:
$10,319
State:
$14,448
(% of AGI for various income ranges: 3.1% for AGIs below $25k, 3.2% for AGIs $25k-50k, 5.0% for AGIs $50k-75k, 6.3% for AGIs $75k-100k, 7.7% for AGIs $100k-200k, 8.8% for AGIs over 200k)
Earned income credit: $1,900 (reported on 15.0% of returns)
Here:
$1,900
State:
$2,286
(% of AGI for various income ranges: 4.9% for AGIs below $25k, 0.9% for AGIs $25k-50k)
Percentage of individuals using paid preparers for their 2012 taxes: 65.5%
Here:
66%
State:
64%
(% for various income ranges: 60.8% for AGIs below $25k, 66.2% for AGIs $25k-50k, 65.0% for AGIs $50k-75k, 69.7% for AGIs $75k-100k, 68.3% for AGIs $100k-200k, 83.0% for AGIs over 200k)
Averages for the 2004 tax year for zip code 93035, filed in 2005:
Average Adjusted Gross Income (AGI) in 2004: $56,168 (Individual Income Tax Returns)
Here:
$56,168
State:
$58,600
Salary/wage: $47,501 (reported on 81.6% of returns)
Here:
$47,501
State:
$49,455
(% of AGI for various income ranges: 150.6% for AGIs below $10k, 76.9% for AGIs $10k-25k, 81.1% for AGIs $25k-50k, 79.1% for AGIs $50k-75k, 77.2% for AGIs $75k-100k, 55.4% for AGIs over 100k)
Taxable interest for individuals: $2,250 (reported on 48.1% of returns)
This zip code:
$2,250
California:
$2,365
(% of AGI for various income ranges: 13.7% for AGIs below $10k, 2.0% for AGIs $10k-25k, 1.3% for AGIs $25k-50k, 1.5% for AGIs $50k-75k, 1.4% for AGIs $75k-100k, 2.3% for AGIs over 100k)
Taxable dividends: $3,449 (reported on 23.4% of returns)
Here:
$3,449
State:
$4,746
(% of AGI for various income ranges: 8.7% for AGIs below $10k, 1.6% for AGIs $10k-25k, 0.9% for AGIs $25k-50k, 1.2% for AGIs $50k-75k, 1.0% for AGIs $75k-100k, 1.8% for AGIs over 100k)
Net capital gain/loss: +$17,600 (reported on 21.3% of returns)
Here:
+$17,600
State:
+$23,418
(% of AGI for various income ranges: 1.1% for AGIs below $10k, -0.6% for AGIs $10k-25k, 0.4% for AGIs $25k-50k, 0.7% for AGIs $50k-75k, 1.2% for AGIs $75k-100k, 14.4% for AGIs over 100k)
Profit/loss from business: +$16,542 (reported on 17.8% of returns)
Here:
+$16,542
State:
+$16,826
(% of AGI for various income ranges: 4.3% for AGIs below $10k, 8.4% for AGIs $10k-25k, 5.1% for AGIs $25k-50k, 3.5% for AGIs $50k-75k, 4.3% for AGIs $75k-100k, 5.8% for AGIs over 100k)
IRA payment deduction: $3,257 (reported on 3.0% of returns)
93035:
$3,257
California:
$3,192
(% of AGI for various income ranges: 1.1% for AGIs below $10k, 0.2% for AGIs $10k-25k, 0.2% for AGIs $25k-50k, 0.2% for AGIs $50k-75k, 0.2% for AGIs $75k-100k, 0.1% for AGIs over 100k)
Self-employed pension: $16,548 (reported on 1.5% of returns)
Here:
$16,548
California:
$17,688
(% of AGI for various income ranges: 0.3% for AGIs $10k-25k, 0.1% for AGIs $25k-50k, 0.2% for AGIs $50k-75k, 0.3% for AGIs $75k-100k, 0.7% for AGIs over 100k)
Total itemized deductions: $25,734 (28% of AGI, reported on 45.0% of returns)
Here:
$25,734
State:
$28,113
Here:
27.9% of AGI
State:
25.3% of AGI
(% of AGI for various income ranges: 42.1% for AGIs below $10k, 16.1% for AGIs $10k-25k, 18.5% for AGIs $25k-50k, 23.3% for AGIs $50k-75k, 23.3% for AGIs $75k-100k, 19.7% for AGIs over 100k)
Charity contributions deductions: $3,092 (3% of AGI, reported on 40.6% of returns)
Here:
$3,092
State:
$3,923
Here:
3.2% of AGI
State:
3.3% of AGI
(% of AGI for various income ranges: 1.6% for AGIs below $10k, 1.1% for AGIs $10k-25k, 1.6% for AGIs $25k-50k, 2.0% for AGIs $50k-75k, 2.6% for AGIs $75k-100k, 2.6% for AGIs over 100k)
Total tax: $8,737 (reported on 78.0% of returns)
93035:
$8,737
State:
$10,761
(% of AGI for various income ranges: 5.9% for AGIs below $10k, 4.6% for AGIs $10k-25k, 6.9% for AGIs $25k-50k, 8.8% for AGIs $50k-75k, 10.5% for AGIs $75k-100k, 17.2% for AGIs over 100k)
Earned income credit: $1,544 (reported on 11.9% of returns)
Here:
$1,544
State:
$1,763
Percentage of individuals using paid preparers for their 2004 taxes: 68.3%
Here:
68%
State:
66%
(% for various income ranges: 60.2% for AGIs below $10k, 67.7% for AGIs $10k-25k, 67.3% for AGIs $25k-50k, 69.5% for AGIs $50k-75k, 71.2% for AGIs $75k-100k, 77.0% for AGIs over 100k)
Likely homosexual households (counted as self-reported same-sex unmarried-partner households)
Lesbian couples: 0.3% of all households
Gay men: 0.0% of all households
Household received Food Stamps/SNAP in the past 12 months: 667 Household did not receive Food Stamps/SNAP in the past 12 months: 8,519
Women who had a birth in the past 12 months: 205 (68 now married, 138 unmarried) Women who did not have a birth in the past 12 months: 5,554 (2,104 now married, 3,453 unmarried)
Housing units in zip code 93035 with a mortgage: 3,774 (369 second mortgage, 4 home equity loan, 315 both second mortgage and home equity loan) Houses without a mortgage: 74
Median monthly owner costs for units with a mortgage: $2,686 Median monthly owner costs for units without a mortgage: $866
Residents with income below the poverty level in 2022:
This zip code:
6.4%
Whole state:
12.2%
Residents with income below 50% of the poverty level in 2022:
This zip code:
2.1%
Whole state:
6.2%
Median number of rooms in houses and condos:
Here:
6.0
State:
6.0
Median number of rooms in apartments:
Here:
4.3
State:
3.9
Notable locations in this zip code not listed on our city pages
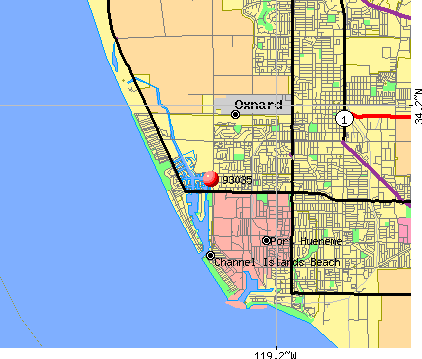
Parks in zip code 93035 include: Marina West Park (1), Oxnard Shores Park (2), Oxnard Beach Park (3), Sea Air Park (4), Seaview Park (5), Via Marina Park (6), Mandalay State Beach (7), Peninsula Park (8). Display/hide their locations on the map
2,666 married couples with children.
1,480 single-parent households (334 men, 1,146 women).
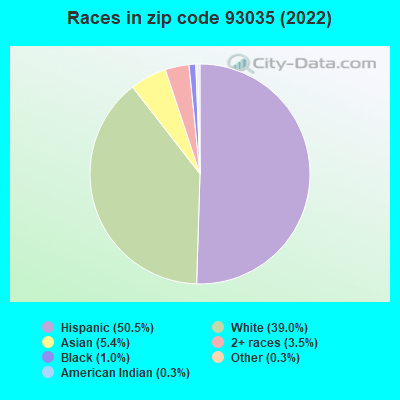
58.7% of residents of 93035 zip code speak English at home.
33.9% of residents speak Spanish at home (61% very well, 17% well, 16% not well, 7% not at all).
2.4% of residents speak other Indo-European language at home (71% very well, 19% well, 9% not well).
4.0% of residents speak Asian or Pacific Island language at home (73% very well, 22% well, 3% not well, 2% not at all).
0.9% of residents speak other language at home (97% very well, 3% not well).
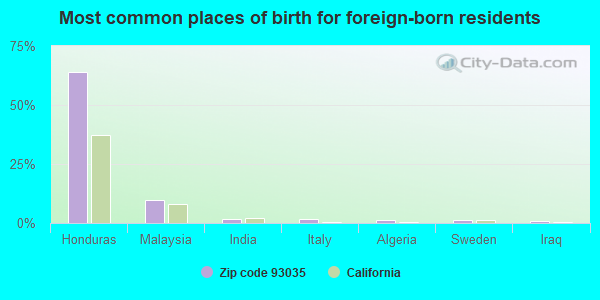
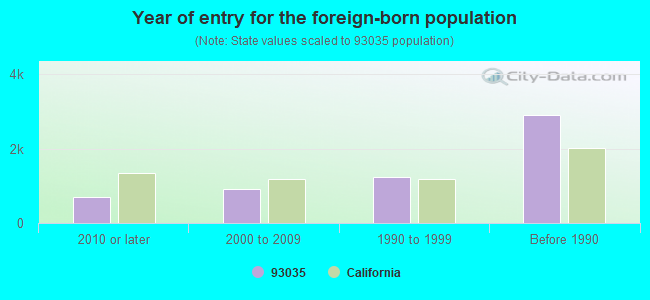
Foreign born population: 5,353 (20.5%) (58.9% of them are naturalized citizens)
Facilities with environmental interests located in this zip code:
MANDALAY GENERATING STATION (393 NORTH HARBOR BOULEVARD in OXNARD, CA)
AIR MAJOR (AIRS/AFS) AIR PROGRAM (Clean Air Markets Division Business System) OIL CONTROL (Facility Response Plan for oil discharge) STATE MASTER (California - Hazardous Waste Tracking) - HAZARDOU WASTE PROGRAM CRITERIA AND HAZARDOUS AIR POLLUTANT INVENTORY (Inventory of air pollution sources) National Pollutant Discharge Elimination System MAJOR (Tracking pollutant discharge elimination systems) - permit HAZARDOUS WASTE BIENNIAL REPORTER (Resource Conservation and Recovery Act (tracking hazardous waste)) Small Quantity Generators, between 100 kg and 1000 kg of hazardous waste/month (Resource Conservation and Recovery Act (tracking hazardous waste)) - notification Large Quantity Generators, more that 1000 kg of hazardous waste/month (Resource Conservation and Recovery Act (tracking hazardous waste)) - notification Business SIC classification: ELECTRIC SERVICES Business NAICS classification: FOSSIL FUEL ELECTRIC POWER GENERATION. Organizations: OCEAN VISTA POWER GENERATION LLC (CONTACT/GENERAL)
, RELIANT ENERGY (CONTACT/OPERATOR)
, SO CALIFORNIA EDISON EPTC (CONTACT/OWNER)
, RELIANT ENERGY MANDALAY, LLC (OWNER/OPERATOR)
Alternative names: OCEAN VISTA (MANDALAY), OCEAN VISTA POWER GENERATION, OCEAN VISTA POWER GEN LLC, RELIANT ENERGY, RELIANT MANDALAY
CHEVRON STATION NO 92561 (1960 VICTORIA AVE in OXNARD, CA)
STATE MASTER (California - Hazardous Waste Tracking) - HAZARDOU WASTE PROGRAM CRITERIA AND HAZARDOUS AIR POLLUTANT INVENTORY (Inventory of air pollution sources) Large Quantity Generators, more that 1000 kg of hazardous waste/month (Resource Conservation and Recovery Act (tracking hazardous waste)) Business SIC classification: GASOLINE SERVICE STATIONS Organizations: CHEVRON PRODUCTS CO. (CONTACT/OPERATOR)
CHANNEL ISLAND CLEANERS (505 S VENTURA RD in OXNARD, CA)
STATE MASTER (California - Hazardous Waste Tracking) - HAZARDOU WASTE PROGRAM Small Quantity Generators, between 100 kg and 1000 kg of hazardous waste/month (Resource Conservation and Recovery Act (tracking hazardous waste)) - notification Organizations: JAY WEE (CONTACT/OWNER)
HOLLYWOOD BEACH ELEMENTARY (4000 SUNSET LANE in OXNARD, CA)
(National Center for Education Statistics) - STATE ID-6055065 Organizations: HUENEME ELEMENTARY (SCHOOL DISTRICT)
MARINA WEST ELEMENTARY (2501 CAROB ST. in OXNARD, CA)
(National Center for Education Statistics) - STATE ID-6055347 Organizations: OXNARD ELEMENTARY (SCHOOL DISTRICT)
ANACAPA MARINE SERVICES (3203 SOUTH VICTORIA AVE in OXNARD, CA)
CRITERIA AND HAZARDOUS AIR POLLUTANT INVENTORY (Inventory of air pollution sources) Small Quantity Generators, between 100 kg and 1000 kg of hazardous waste/month (Resource Conservation and Recovery Act (tracking hazardous waste)) - notification Business SIC classification: BOAT BUILDING AND REPAIRING Organizations: RICHARD FAIRCHILD (CONTACT/OWNER)
Alternative names: MECHANIC WHARF
Housing units lacking complete plumbing facilities: 0.3% Housing units lacking complete kitchen facilities: 0.8%
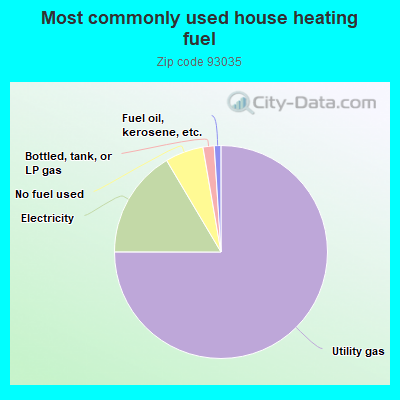
74.8%Utility gas
16.4%Electricity
5.8%No fuel used
1.7%Bottled, tank, or LP gas
1.0%Fuel oil, kerosene, etc.
Population in 1990: 23,778. Population change in the 1990s: +1,543 (+6.5%).
Place of birth for U.S.-born residents:
This state: 16,037
Northeast: 864
Midwest: 1,123
South: 1,318
West: 828
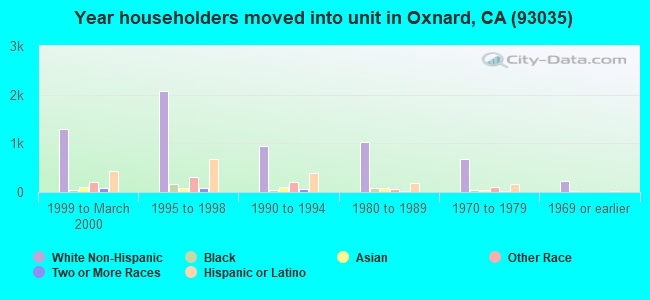
51% of the 93035 zip code residents lived in the same house 5 years ago. Out of people who lived in different houses, 67% lived in this county. Out of people who lived in different counties, 50% lived in California.
90% of the 93035 zip code residents lived in the same house 1 year ago. Out of people who lived in different houses, 53% moved from this county. Out of people who lived in different houses, 31% moved from different county within same state. Out of people who lived in different houses, 9% moved from different state. Out of people who lived in different houses, 7% moved from abroad.
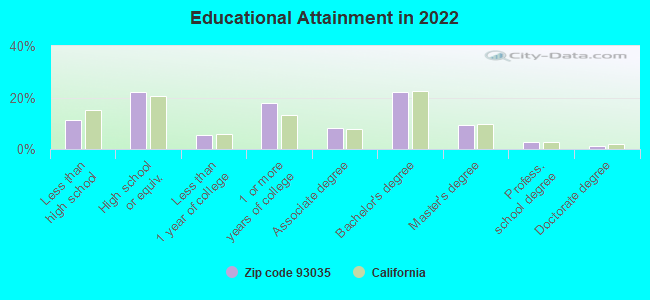
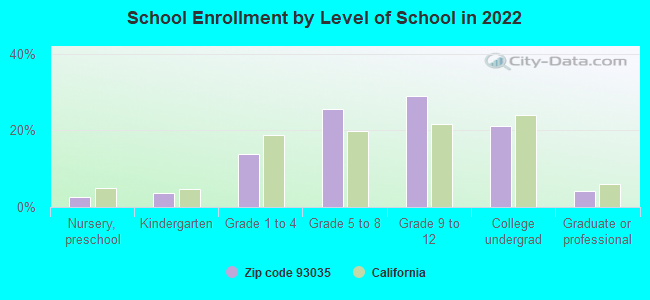
Private vs. public school enrollment:
Students in private schools in grades 1 to 8 (elementary and middle school): 338
Here:
15.0%
California:
10.5%
Students in private schools in grades 9 to 12 (high school): 27
Here:
1.7%
California:
8.5%
Students in private undergraduate colleges: 168
Here:
14.1%
California:
15.9%
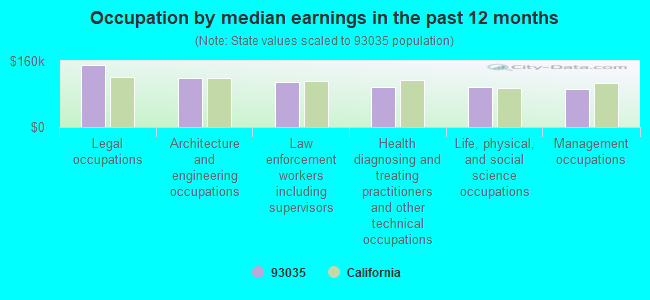
Occupation by median earnings in the past 12 months ($)
149,778Legal occupations
119,609Architecture and engineering occupations
110,088Law enforcement workers including supervisors
97,186Health diagnosing and treating practitioners and other technical occupations
96,962Life, physical, and social science occupations
92,517Management occupations
Companies with biggest federal contracts located in this zip code (OXNARD, CA):
MPGENIUS LLC (5304 SEABREEZE WAY; small business) : $1,151,733 in 5 contractsfrom 1999 to 2003
Contracts for Other ADP and Telecommunications Services (includes data storage on tapes, compact disks, etc.), Automated Information System Design and Integration Services by Federal Technology Service, Navy Signed by year:2000: $638,000; 2001: $164,000; 2002: $0; 2003: -$6,267; 2004: $0; 2005: $0; 2006: $0.
Biggest contracts:
$481,000 with Federal Technology Service for Other ADP and Telecommunications Services (includes data storage on tapes, compact disks, etc.). Signed on 2000-05-15. Completion date: 2000-09-15.
$356,000, same as above.Signed on 1999-12-15. Completion date: 2000-05-15.
$164,000, same as above.Signed on 2001-01-15. Completion date: 2001-09-15.
$157,000, same as above.Signed on 2000-08-15. Completion date: 2000-09-15.
GARY S STANDEFER (3615 S VICTORIA AVE; small business) : $91,969 in 4 contractsfrom 2003 to 2005
$78,864 with Department of Defense for Individual Equipment. Signed on 2003-08-29. Completion date: 2003-09-30.
$5,000 with Navy for Miscellaneous Items. Taking place in FL. Signed on 2005-08-11. Completion date: 2005-09-30.
$4,630 with Navy for Maintenance, Repair and Rebuilding of Equipment -- Ships, Small Craft, Pontoons, and Floating Docks. Signed on 2003-09-16. Completion date: 2003-10-15.
$3,475, same as above.Signed on 2003-09-25. Completion date: 2003-10-15.
EL SOL SERVICES (264 ROSSMORE DRIVE; small business)
$49,682 with Navy for Landscaping/Groundskeeping Services. Signed on 2000-10-01. Completion date: 2000-12-04.
DYKES CONSTRUCTION CORPORATION (5203 WHITECAP ST; small business) : $42,622 in 3 contractsin 2002
$21,589 with Navy for Maintenance, Repair or Alteration of Real Property -- Other Non-Building Facilities. Signed on 2002-06-27. Completion date: 2002-08-26.
$14,683 with Navy for Maintenance, Repair or Alteration of Real Property -- Miscellaneous Buildings. Signed on 2002-04-15. Completion date: 2002-05-31.
$6,350 with Navy for Maintenance, Repair or Alteration of Real Property -- Other Non-Building Facilities. Signed on 2002-07-30. Completion date: 2002-09-25.
RUDYS OILFIELD WELDING SERVICE (1831 RIALTO ST; small business)
$26,718 with Navy for Flight Instruments. Signed on 2002-04-19. Completion date: 2002-05-20.
CAPISTRANO'S RESTAURANT AND CA (2101 MANDALAY BEACH RD; small business) : $11,959 in 2 contractsfrom 2003 to 2004
$10,647 with Army for Food Services. Signed on 2003-11-24. Completion date: 2003-12-12.
$1,312, same as above.Signed on 2004-04-08. Completion date: 2003-12-12.
GARIBAY LANDSCAPING SERVICE, I (1711 PIEDMONT ST; small business)
$11,250 with Navy for Maintenance, Repair or Alteration of Real Property -- Other Non-Building Facilities. Signed on 2000-09-28. Completion date: 2000-11-16.
PHOENIX ELECTRICAL CONSTRUCTOR (4941 CATAMARAN ST UNIT A; small business) : $10,874 in 2 contractsfrom 2001 to 2003
$7,074 with Navy for Maintenance, Repair or Alteration of Real Property -- Miscellaneous Buildings. Signed on 2001-06-18. Completion date: 2001-08-22.
$3,800 with Navy for Maintenance, Repair or Alteration of Real Property -- Other Industrial Buildings. Signed on 2003-03-28. Completion date: 2003-05-28.
ANDY FINAN POOL SERVICE, INC (1008 OCEAN DR; small business) : $6,650 in 2 contractsin 2004
$3,850 with Navy for Water Services. Signed on 2004-10-27. Completion date: 2005-09-30.
$2,800 with Navy for Miscellaneous Chemical Specialties. Signed on 2004-03-10. Completion date: 2004-09-30.
ACCURATE WEIGHING SYSTEMS, INC (3600 S HARBOR BLVD # 160; small business)
$5,590 with Defense Logistics Agency for Recycling and Reclamation Equipment. Signed on 2005-06-01. Completion date: 2005-06-20.
Top industries in this zip code by the number of employees in 2005:
Administrative and Support and Waste Management and Remediation Services: Janitorial Services (20-49: 1, 10-19: 1, 1-4: 1)
Other Services (except Public Administration): Other Similar Organizations (except Business, Professional, Labor, and Political Organizations) (20-49: 1, 5-9: 2)
Arts, Entertainment, and Recreation: Marinas (20-49: 1, 1-4: 3)
Real Estate and Rental and Leasing: Offices of Real Estate Agents and Brokers (5-9: 1, 1-4: 16)
Health Care and Social Assistance: Residential Mental Health and Substance Abuse Facilities (20-49: 1)
Health Care and Social Assistance: Services for the Elderly and Persons with Disabilities (20-49: 1)
Utilities: Natural Gas Distribution (20-49: 1)
People in group quarters in 2010:
31 people in group homes intended for adults
18 people in workers' group living quarters and job corps centers
6 people in residential treatment centers for juveniles (non-correctional)
People in group quarters in 2000:
58 people in homes for the mentally ill
19 people in homes for the mentally retarded
14 people in other noninstitutional group quarters
Fatal accident statistics in 2013:
Fatal accident count: 2
Vehicles involved in fatal accidents: 3
Fatal accidents caused by drunken drivers: 0
Fatalities: 2
Persons involved in fatal accidents: 4
Pedestrians involved in fatal accidents: 1
Fatal accident statistics in 2012:
Fatal accident count: 1
Vehicles involved in fatal accidents: 1
Fatal accidents caused by drunken drivers: 0
Fatalities: 1
Persons involved in fatal accidents: 1
Pedestrians involved in fatal accidents: 1
Home Mortgage Disclosure Act Aggregated Statistics For Year 2009 (Based on 9 full tracts)
A) FHA, FSA/RHS & VA Home Purchase Loans
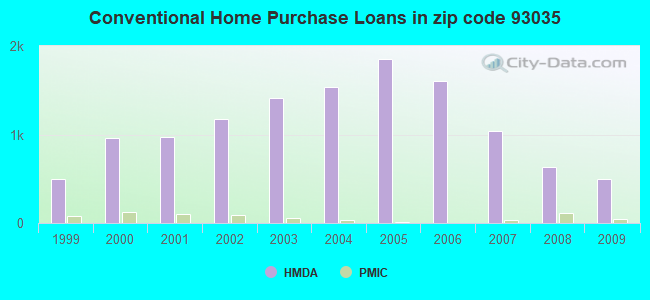
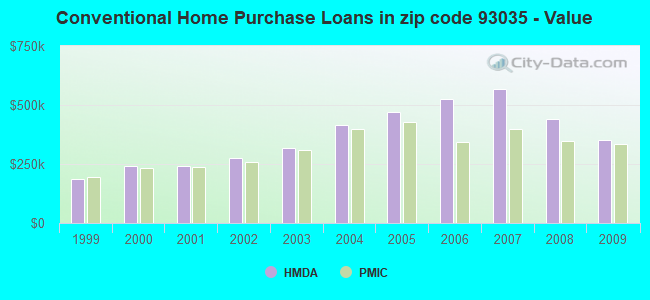
B) Conventional Home Purchase Loans
C) Refinancings
D) Home Improvement Loans
E) Loans on Dwellings For 5+ Families
F) Non-occupant Loans on < 5 Family Dwellings (A B C & D)
G) Loans On Manufactured Home Dwelling (A B C & D)
Number
Average Value
Number
Average Value
Number
Average Value
Number
Average Value
Number
Average Value
Number
Average Value
Number
Average Value
LOANS ORIGINATED
280
$303,073
502
$353,369
1,295
$328,479
53
$206,256
2
$2,192,300
558
$385,319
18
$130,654
APPLICATIONS APPROVED, NOT ACCEPTED
13
$264,444
60
$488,735
112
$381,780
8
$28,614
0
$0
51
$462,780
2
$163,425
APPLICATIONS DENIED
67
$285,590
117
$375,692
505
$396,458
16
$139,677
0
$0
180
$447,418
2
$154,460
APPLICATIONS WITHDRAWN
68
$321,124
100
$353,577
300
$380,104
12
$231,250
0
$0
110
$413,962
0
$0
FILES CLOSED FOR INCOMPLETENESS
3
$255,000
14
$441,911
96
$362,318
4
$161,888
0
$0
25
$390,381
4
$160,445
Aggregated Statistics For Year 2008 (Based on 9 full tracts)
A) FHA, FSA/RHS & VA Home Purchase Loans
B) Conventional Home Purchase Loans
C) Refinancings
D) Home Improvement Loans
E) Loans on Dwellings For 5+ Families
F) Non-occupant Loans on < 5 Family Dwellings (A B C & D)
G) Loans On Manufactured Home Dwelling (A B C & D)
Number
Average Value
Number
Average Value
Number
Average Value
Number
Average Value
Number
Average Value
Number
Average Value
Number
Average Value
LOANS ORIGINATED
177
$337,844
634
$441,924
596
$385,768
55
$228,400
2
$1,913,280
399
$451,930
6
$168,077
APPLICATIONS APPROVED, NOT ACCEPTED
9
$231,078
107
$457,729
138
$437,605
4
$375,275
0
$0
60
$581,364
13
$93,793
APPLICATIONS DENIED
32
$355,013
200
$424,471
393
$457,049
41
$411,661
0
$0
107
$479,261
14
$137,938
APPLICATIONS WITHDRAWN
45
$338,301
162
$382,162
197
$378,369
20
$463,219
0
$0
79
$431,954
4
$103,635
FILES CLOSED FOR INCOMPLETENESS
2
$409,560
21
$416,682
75
$400,100
9
$214,100
0
$0
16
$397,700
0
$0
Aggregated Statistics For Year 2007 (Based on 9 full tracts)
A) FHA, FSA/RHS & VA Home Purchase Loans
B) Conventional Home Purchase Loans
C) Refinancings
D) Home Improvement Loans
E) Loans on Dwellings For 5+ Families
F) Non-occupant Loans on < 5 Family Dwellings (A B C & D)
G) Loans On Manufactured Home Dwelling (A B C & D)
Number
Average Value
Number
Average Value
Number
Average Value
Number
Average Value
Number
Average Value
Number
Average Value
Number
Average Value
LOANS ORIGINATED
4
$295,782
1,043
$568,644
1,349
$461,747
134
$296,687
10
$891,241
608
$612,439
15
$110,394
APPLICATIONS APPROVED, NOT ACCEPTED
0
$0
255
$516,087
364
$420,464
50
$513,913
0
$0
102
$685,936
10
$185,472
APPLICATIONS DENIED
0
$0
444
$559,514
974
$502,832
77
$305,193
0
$0
176
$656,951
11
$149,467
APPLICATIONS WITHDRAWN
1
$400,000
241
$536,298
376
$454,152
30
$211,444
0
$0
81
$560,720
0
$0
FILES CLOSED FOR INCOMPLETENESS
0
$0
36
$648,569
124
$457,078
4
$287,482
0
$0
20
$406,072
2
$139,525
Aggregated Statistics For Year 2006 (Based on 9 full tracts)
A) FHA, FSA/RHS & VA Home Purchase Loans
B) Conventional Home Purchase Loans
C) Refinancings
D) Home Improvement Loans
E) Loans on Dwellings For 5+ Families
F) Non-occupant Loans on < 5 Family Dwellings (A B C & D)
G) Loans On Manufactured Home Dwelling (A B C & D)
Number
Average Value
Number
Average Value
Number
Average Value
Number
Average Value
Number
Average Value
Number
Average Value
Number
Average Value
LOANS ORIGINATED
4
$155,952
1,606
$524,642
1,953
$442,336
320
$327,576
5
$4,537,812
790
$545,613
13
$177,708
APPLICATIONS APPROVED, NOT ACCEPTED
0
$0
308
$481,272
432
$443,130
45
$378,484
0
$0
139
$590,531
2
$17,895
APPLICATIONS DENIED
2
$182,360
346
$513,361
828
$493,248
149
$258,773
0
$0
136
$648,420
10
$198,869
APPLICATIONS WITHDRAWN
0
$0
276
$517,606
586
$459,450
50
$280,881
0
$0
105
$565,886
2
$99,660
FILES CLOSED FOR INCOMPLETENESS
0
$0
53
$523,546
169
$378,654
8
$249,206
1
$900,000
14
$422,606
2
$92,685
Aggregated Statistics For Year 2005 (Based on 9 full tracts)
B) Conventional Home Purchase Loans
C) Refinancings
D) Home Improvement Loans
E) Loans on Dwellings For 5+ Families
F) Non-occupant Loans on < 5 Family Dwellings (A B C & D)
G) Loans On Manufactured Home Dwelling (A B C & D)
Number
Average Value
Number
Average Value
Number
Average Value
Number
Average Value
Number
Average Value
Number
Average Value
LOANS ORIGINATED
1,851
$470,860
2,154
$386,859
285
$284,382
12
$2,053,516
706
$485,826
16
$92,927
APPLICATIONS APPROVED, NOT ACCEPTED
279
$422,438
306
$347,308
56
$192,416
0
$0
91
$480,856
2
$141,505
APPLICATIONS DENIED
413
$470,302
745
$412,412
113
$259,301
0
$0
202
$483,015
12
$95,133
APPLICATIONS WITHDRAWN
276
$443,767
527
$378,146
89
$282,204
0
$0
78
$541,292
14
$213,516
FILES CLOSED FOR INCOMPLETENESS
70
$562,627
240
$388,142
12
$433,198
0
$0
12
$704,543
0
$0
Aggregated Statistics For Year 2004 (Based on 9 full tracts)
A) FHA, FSA/RHS & VA Home Purchase Loans
B) Conventional Home Purchase Loans
C) Refinancings
D) Home Improvement Loans
E) Loans on Dwellings For 5+ Families
F) Non-occupant Loans on < 5 Family Dwellings (A B C & D)
G) Loans On Manufactured Home Dwelling (A B C & D)
Number
Average Value
Number
Average Value
Number
Average Value
Number
Average Value
Number
Average Value
Number
Average Value
Number
Average Value
LOANS ORIGINATED
4
$112,040
1,540
$416,160
2,599
$314,265
252
$207,213
7
$992,484
765
$421,897
14
$95,806
APPLICATIONS APPROVED, NOT ACCEPTED
0
$0
239
$418,706
464
$312,860
24
$166,080
1
$8,350,000
113
$417,438
18
$77,710
APPLICATIONS DENIED
0
$0
283
$411,093
676
$355,742
108
$163,662
0
$0
127
$330,356
8
$231,186
APPLICATIONS WITHDRAWN
0
$0
215
$407,914
744
$328,303
60
$160,714
0
$0
82
$444,326
10
$109,814
FILES CLOSED FOR INCOMPLETENESS
0
$0
62
$400,114
121
$296,338
21
$176,689
0
$0
24
$357,243
0
$0
Aggregated Statistics For Year 2003 (Based on 9 full tracts)
A) FHA, FSA/RHS & VA Home Purchase Loans
B) Conventional Home Purchase Loans
C) Refinancings
D) Home Improvement Loans
E) Loans on Dwellings For 5+ Families
F) Non-occupant Loans on < 5 Family Dwellings (A B C & D)
Number
Average Value
Number
Average Value
Number
Average Value
Number
Average Value
Number
Average Value
Number
Average Value
LOANS ORIGINATED
10
$190,323
1,407
$316,008
5,169
$241,024
74
$69,924
12
$1,546,364
1,190
$295,519
APPLICATIONS APPROVED, NOT ACCEPTED
2
$66,725
167
$301,561
669
$258,015
20
$67,463
2
$1,494,750
142
$301,506
APPLICATIONS DENIED
2
$169,305
244
$305,104
783
$264,933
72
$36,355
8
$780,758
151
$359,402
APPLICATIONS WITHDRAWN
2
$231,625
145
$388,188
959
$245,705
23
$47,270
0
$0
107
$284,938
FILES CLOSED FOR INCOMPLETENESS
4
$13,942
41
$423,067
198
$254,289
1
$20,000
0
$0
30
$347,275
Aggregated Statistics For Year 2002 (Based on 6 full tracts)
A) FHA, FSA/RHS & VA Home Purchase Loans
B) Conventional Home Purchase Loans
C) Refinancings
D) Home Improvement Loans
E) Loans on Dwellings For 5+ Families
F) Non-occupant Loans on < 5 Family Dwellings (A B C & D)
Number
Average Value
Number
Average Value
Number
Average Value
Number
Average Value
Number
Average Value
Number
Average Value
LOANS ORIGINATED
22
$182,266
1,178
$274,770
2,596
$255,696
54
$60,409
6
$1,591,727
781
$284,655
APPLICATIONS APPROVED, NOT ACCEPTED
2
$193,205
106
$339,246
399
$264,643
14
$51,102
0
$0
98
$321,408
APPLICATIONS DENIED
0
$0
145
$296,712
456
$254,052
48
$58,526
2
$810,155
92
$317,441
APPLICATIONS WITHDRAWN
2
$174,285
132
$253,808
452
$234,744
28
$73,879
0
$0
62
$256,415
FILES CLOSED FOR INCOMPLETENESS
0
$0
32
$371,814
116
$306,812
0
$0
0
$0
26
$361,593
Aggregated Statistics For Year 2001 (Based on 6 full tracts)
A) FHA, FSA/RHS & VA Home Purchase Loans
B) Conventional Home Purchase Loans
C) Refinancings
D) Home Improvement Loans
E) Loans on Dwellings For 5+ Families
F) Non-occupant Loans on < 5 Family Dwellings (A B C & D)
Number
Average Value
Number
Average Value
Number
Average Value
Number
Average Value
Number
Average Value
Number
Average Value
LOANS ORIGINATED
58
$185,276
967
$241,339
1,716
$212,992
80
$42,444
12
$834,569
516
$242,302
APPLICATIONS APPROVED, NOT ACCEPTED
2
$193,205
84
$269,681
223
$208,858
12
$48,157
4
$1,220,712
42
$256,674
APPLICATIONS DENIED
10
$253,638
98
$277,132
339
$231,706
48
$32,547
0
$0
62
$305,196
APPLICATIONS WITHDRAWN
10
$153,414
102
$276,594
365
$219,661
44
$37,355
0
$0
64
$206,737
FILES CLOSED FOR INCOMPLETENESS
0
$0
22
$258,430
122
$222,095
8
$29,892
0
$0
24
$234,770
Aggregated Statistics For Year 2000 (Based on 6 full tracts)
A) FHA, FSA/RHS & VA Home Purchase Loans
B) Conventional Home Purchase Loans
C) Refinancings
D) Home Improvement Loans
E) Loans on Dwellings For 5+ Families
F) Non-occupant Loans on < 5 Family Dwellings (A B C & D)
Number
Average Value
Number
Average Value
Number
Average Value
Number
Average Value
Number
Average Value
Number
Average Value
LOANS ORIGINATED
68
$176,907
963
$241,175
426
$179,649
68
$34,402
4
$543,590
199
$246,057
APPLICATIONS APPROVED, NOT ACCEPTED
4
$212,128
120
$269,536
110
$190,179
18
$34,646
0
$0
34
$283,594
APPLICATIONS DENIED
10
$156,157
169
$244,690
247
$177,437
44
$31,877
0
$0
32
$249,743
APPLICATIONS WITHDRAWN
2
$203,165
126
$205,472
126
$152,548
12
$42,675
2
$4,982,500
34
$258,621
FILES CLOSED FOR INCOMPLETENESS
8
$197,001
40
$258,524
30
$235,807
2
$22,920
8
$2,023,249
8
$304,685
Aggregated Statistics For Year 1999 (Based on 2 full and 2 partial tracts)
A) FHA, FSA/RHS & VA Home Purchase Loans
B) Conventional Home Purchase Loans
C) Refinancings
D) Home Improvement Loans
E) Loans on Dwellings For 5+ Families
F) Non-occupant Loans on < 5 Family Dwellings (A B C & D)
2006 - 2018 National Fire Incident Reporting System (NFIRS) incidents
Based on the data from the years 2006 - 2018 the average number of fire incidents per year is 28. The highest number of reported fires - 70 took place in 2018, and the least - 3 in 2006. The data has an increasing trend.
When looking into fire subcategories, the most incidents belonged to: Outside Fires (41.6%), and Structure Fires (37.5%).
Fire incident types reported to NFIRS in Zip Code 93035


 Nearest zip codes: 93043, 93030, 93036, 93003, 93033, 93004.


 Based on the data from the years 2006 - 2018 the average number of fire incidents per year is 28. The highest number of reported fires - 70 took place in 2018, and the least - 3 in 2006. The data has an increasing trend.
 When looking into fire subcategories, the most incidents belonged to: Outside Fires (41.6%), and Structure Fires (37.5%).