Estimated zip code population in 2022: 52,840 Zip code population in 2010: 50,474 Zip code population in 2000: 46,891
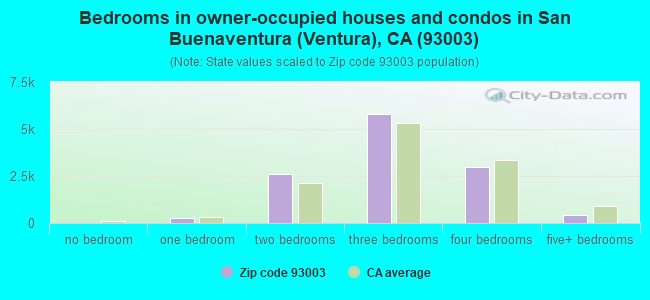
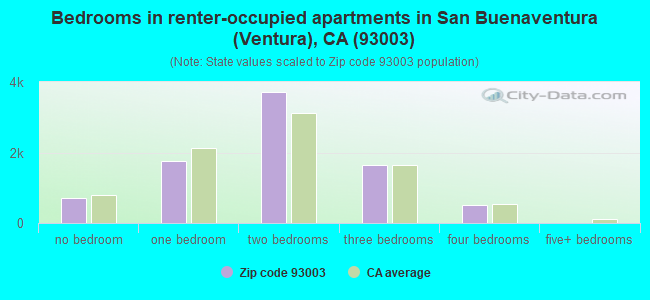
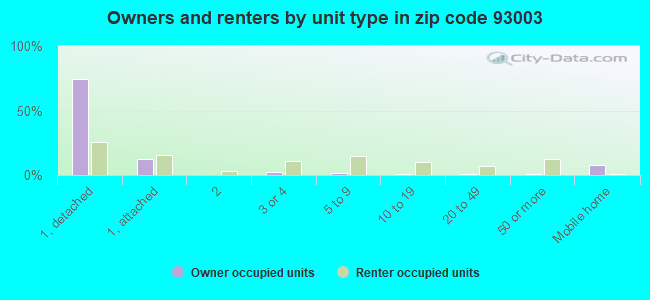
Houses and condos: 21,332 Renter-occupied apartments: 8,339
% of renters here:
41%
State:
44%
March 2022 cost of living index in zip code 93003: 92.8 (less than average, U.S. average is 100)
Land area: 20.6 sq. mi. Water area: 0.1 sq. mi.
Population density: 2,568 people per square mile
(average).
OSM Map
General Map
Google Map
MSN Map
OSM Map
General Map
Google Map
MSN Map
OSM Map
General Map
Google Map
MSN Map
OSM Map
General Map
Google Map
MSN Map
Please wait while loading the map...
Real estate property taxes paid for housing units in 2022:
This zip code:
0.6% ($4,380)
California:
0.7% ($4,831)
Median real estate property taxes paid for housing units with mortgages in 2022: $5,015 (0.6%) Median real estate property taxes paid for housing units with no mortgage in 2022: $2,972 (0.4%)
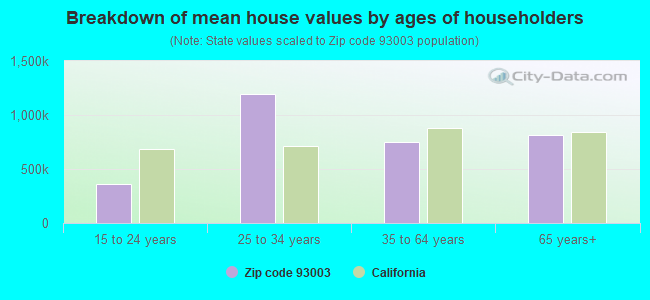
Estimated median house/condo value in 2022: $764,655
93003:
$764,655
California:
$715,900
According to our research of California and other state lists, there were 58 registered sex offenders living in 93003 zip code as of April 26, 2024. The ratio of all residents to sex offenders in zip code 93003 is 893 to 1. The ratio of registered sex offenders to all residents in this zip code is near the state average.
Median resident age:
This zip code:
42.0 years
California median age:
37.9 years
Average household size:
This zip code:
2.5 people
California:
2.8 people
Averages for the 2020 tax year for zip code 93003, filed in 2021:
Average Adjusted Gross Income (AGI) in 2020: $84,053 (Individual Income Tax Returns)
Here:
$84,053
State:
$95,910
Salary/wage: $68,789 (reported on 76.7% of returns)
Here:
$68,789
State:
$77,331
(% of AGI for various income ranges: 1219.4% for AGIs below $25k, 3912.4% for AGIs $25k-50k, 7112.0% for AGIs $50k-75k, 10160.4% for AGIs $75k-100k, 20352.4% for AGIs $100k-200k, 70310.2% for AGIs over 200k)
Taxable interest for individuals: $1,465 (reported on 39.6% of returns)
This zip code:
$1,465
California:
$2,294
(% of AGI for various income ranges: 25.9% for AGIs below $25k, 32.1% for AGIs $25k-50k, 65.2% for AGIs $50k-75k, 98.6% for AGIs $75k-100k, 191.8% for AGIs $100k-200k, 983.3% for AGIs over 200k)
Ordinary dividends: $6,564 (reported on 23.6% of returns)
Here:
$6,564
State:
$10,949
(% of AGI for various income ranges: 45.5% for AGIs below $25k, 64.8% for AGIs $25k-50k, 121.8% for AGIs $50k-75k, 224.6% for AGIs $75k-100k, 526.0% for AGIs $100k-200k, 3260.8% for AGIs over 200k)
Net capital gain/loss in AGI: +$20,097 (reported on 22.5% of returns)
Here:
+$20,097
State:
+$49,306
(% of AGI for various income ranges: 13.2% for AGIs below $25k, 42.9% for AGIs $25k-50k, 135.8% for AGIs $50k-75k, 201.9% for AGIs $75k-100k, 683.0% for AGIs $100k-200k, 17482.1% for AGIs over 200k)
Profit/loss from business: +$20,354 (reported on 17.4% of returns)
Here:
+$20,354
State:
+$15,671
(% of AGI for various income ranges: 172.7% for AGIs below $25k, 239.8% for AGIs $25k-50k, 303.6% for AGIs $50k-75k, 370.2% for AGIs $75k-100k, 1016.1% for AGIs $100k-200k, 7332.5% for AGIs over 200k)
Taxable individual retirement arrangement distribution: $20,980 (reported on 9.8% of returns)
93003:
$20,980
California:
$23,505
(% of AGI for various income ranges: 63.3% for AGIs below $25k, 124.8% for AGIs $25k-50k, 214.7% for AGIs $50k-75k, 399.4% for AGIs $75k-100k, 834.1% for AGIs $100k-200k, 2907.7% for AGIs over 200k)
Self-employed (Keogh) retirement plans: $25,004 (reported on 1.0% of returns)
93003:
$25,004
California:
$30,163
(% of AGI for various income ranges: 2.8% for AGIs below $25k, 17.5% for AGIs $50k-75k, 65.1% for AGIs $100k-200k, 877.9% for AGIs over 200k)
Total itemized deductions: $32,583 (reported on 17.4% of returns)
Here:
$32,583
State:
$39,517
(% of AGI for various income ranges: 120.2% for AGIs below $25k, 214.5% for AGIs $25k-50k, 551.0% for AGIs $50k-75k, 1050.9% for AGIs $75k-100k, 2505.7% for AGIs $100k-200k, 8896.0% for AGIs over 200k)
Charity contributions: $6,396 (reported on 14.3% of returns)
Here:
$6,396
State:
$12,598
(% of AGI for various income ranges: 5.3% for AGIs below $25k, 18.5% for AGIs $25k-50k, 59.3% for AGIs $50k-75k, 123.3% for AGIs $75k-100k, 348.0% for AGIs $100k-200k, 2158.1% for AGIs over 200k)
Taxes paid: $8,544 (reported on 17.4% of returns)
93003:
$8,544
State:
$8,807
(% of AGI for various income ranges: 19.9% for AGIs below $25k, 43.4% for AGIs $25k-50k, 145.8% for AGIs $50k-75k, 309.1% for AGIs $75k-100k, 745.8% for AGIs $100k-200k, 2001.5% for AGIs over 200k)
Earned income credit: $1,737 (reported on 10.3% of returns)
Here:
$1,737
State:
$2,074
(% of AGI for various income ranges: 61.9% for AGIs below $25k, 52.4% for AGIs $25k-50k, 0.8% for AGIs $50k-75k)
Percentage of individuals using paid preparers for their 2020 taxes: 93.3%
Here:
93%
State:
92%
(% for various income ranges: 91.5% for AGIs below $25k, 93.1% for AGIs $25k-50k, 93.8% for AGIs $50k-75k, 93.6% for AGIs $75k-100k, 94.6% for AGIs $100k-200k, 95.2% for AGIs over 200k)
Averages for the 2012 tax year for zip code 93003, filed in 2013:
Average Adjusted Gross Income (AGI) in 2012: $66,256 (Individual Income Tax Returns)
Here:
$66,256
State:
$72,726
Salary/wage: $56,044 (reported on 78.9% of returns)
Here:
$56,044
State:
$59,079
(% of AGI for various income ranges: 70.2% for AGIs below $25k, 73.9% for AGIs $25k-50k, 71.4% for AGIs $50k-75k, 70.6% for AGIs $75k-100k, 72.7% for AGIs $100k-200k, 48.4% for AGIs over 200k)
Taxable interest for individuals: $1,575 (reported on 40.8% of returns)
This zip code:
$1,575
California:
$2,146
(% of AGI for various income ranges: 1.8% for AGIs below $25k, 0.8% for AGIs $25k-50k, 1.0% for AGIs $50k-75k, 0.8% for AGIs $75k-100k, 0.7% for AGIs $100k-200k, 1.3% for AGIs over 200k)
Ordinary dividends: $5,920 (reported on 22.3% of returns)
Here:
$5,920
State:
$9,308
(% of AGI for various income ranges: 2.3% for AGIs below $25k, 1.3% for AGIs $25k-50k, 1.4% for AGIs $50k-75k, 1.6% for AGIs $75k-100k, 1.6% for AGIs $100k-200k, 3.5% for AGIs over 200k)
Net capital gain/loss in AGI: +$8,021 (reported on 19.4% of returns)
Here:
+$8,021
State:
+$30,460
(% of AGI for various income ranges: 0.1% for AGIs $25k-50k, 0.5% for AGIs $50k-75k, 0.7% for AGIs $75k-100k, 1.1% for AGIs $100k-200k, 8.1% for AGIs over 200k)
Profit/loss from business: +$21,464 (reported on 17.3% of returns)
Here:
+$21,464
State:
+$17,064
(% of AGI for various income ranges: 9.3% for AGIs below $25k, 5.6% for AGIs $25k-50k, 3.8% for AGIs $50k-75k, 4.2% for AGIs $75k-100k, 5.0% for AGIs $100k-200k, 7.4% for AGIs over 200k)
Taxable individual retirement arrangement distribution: $15,943 (reported on 11.4% of returns)
93003:
$15,943
California:
$19,557
(% of AGI for various income ranges: 3.3% for AGIs below $25k, 2.5% for AGIs $25k-50k, 2.5% for AGIs $50k-75k, 2.8% for AGIs $75k-100k, 2.9% for AGIs $100k-200k, 2.7% for AGIs over 200k)
Self-employment retirement plans: $21,810 (reported on 1.2% of returns)
93003:
$21,810
California:
$24,530
(% of AGI for various income ranges: 0.1% for AGIs $25k-50k, 0.1% for AGIs $75k-100k, 0.4% for AGIs $100k-200k, 1.0% for AGIs over 200k)
Total itemized deductions: $28,076 (24% of AGI, reported on 39.2% of returns)
Here:
$28,076
State:
$34,004
Here:
24.1% of AGI
State:
22.7% of AGI
(% of AGI for various income ranges: 14.0% for AGIs below $25k, 11.8% for AGIs $25k-50k, 14.7% for AGIs $50k-75k, 17.6% for AGIs $75k-100k, 19.4% for AGIs $100k-200k, 16.5% for AGIs over 200k)
Charity contributions: $3,531 (reported on 33.5% of returns)
Here:
$3,531
State:
$4,659
(% of AGI for various income ranges: 0.7% for AGIs below $25k, 1.1% for AGIs $25k-50k, 1.4% for AGIs $50k-75k, 1.8% for AGIs $75k-100k, 2.1% for AGIs $100k-200k, 2.3% for AGIs over 200k)
Taxes paid: $10,183 (reported on 39.1% of returns)
93003:
$10,183
State:
$14,448
(% of AGI for various income ranges: 2.1% for AGIs below $25k, 2.5% for AGIs $25k-50k, 3.7% for AGIs $50k-75k, 5.3% for AGIs $75k-100k, 7.1% for AGIs $100k-200k, 9.2% for AGIs over 200k)
Earned income credit: $1,844 (reported on 13.0% of returns)
Here:
$1,844
State:
$2,286
(% of AGI for various income ranges: 4.5% for AGIs below $25k, 0.8% for AGIs $25k-50k)
Percentage of individuals using paid preparers for their 2012 taxes: 59.4%
Here:
59%
State:
64%
(% for various income ranges: 51.5% for AGIs below $25k, 57.6% for AGIs $25k-50k, 63.0% for AGIs $50k-75k, 63.7% for AGIs $75k-100k, 67.4% for AGIs $100k-200k, 79.1% for AGIs over 200k)
Averages for the 2004 tax year for zip code 93003, filed in 2005:
Average Adjusted Gross Income (AGI) in 2004: $55,982 (Individual Income Tax Returns)
Here:
$55,982
State:
$58,600
Salary/wage: $48,879 (reported on 78.9% of returns)
Here:
$48,879
State:
$49,455
(% of AGI for various income ranges: 150.1% for AGIs below $10k, 67.3% for AGIs $10k-25k, 76.4% for AGIs $25k-50k, 75.2% for AGIs $50k-75k, 75.6% for AGIs $75k-100k, 59.9% for AGIs over 100k)
Taxable interest for individuals: $1,944 (reported on 52.2% of returns)
This zip code:
$1,944
California:
$2,365
(% of AGI for various income ranges: 12.6% for AGIs below $10k, 3.2% for AGIs $10k-25k, 1.9% for AGIs $25k-50k, 1.5% for AGIs $50k-75k, 1.4% for AGIs $75k-100k, 1.6% for AGIs over 100k)
Taxable dividends: $3,335 (reported on 28.5% of returns)
Here:
$3,335
State:
$4,746
(% of AGI for various income ranges: 9.3% for AGIs below $10k, 2.4% for AGIs $10k-25k, 1.3% for AGIs $25k-50k, 1.4% for AGIs $50k-75k, 1.5% for AGIs $75k-100k, 1.8% for AGIs over 100k)
Net capital gain/loss: +$12,527 (reported on 24.7% of returns)
Here:
+$12,527
State:
+$23,418
(% of AGI for various income ranges: -3.7% for AGIs below $10k, 0.1% for AGIs $10k-25k, 0.5% for AGIs $25k-50k, 0.8% for AGIs $50k-75k, 1.7% for AGIs $75k-100k, 11.7% for AGIs over 100k)
Profit/loss from business: +$19,686 (reported on 17.8% of returns)
Here:
+$19,686
State:
+$16,826
(% of AGI for various income ranges: 10.1% for AGIs below $10k, 8.4% for AGIs $10k-25k, 4.7% for AGIs $25k-50k, 5.0% for AGIs $50k-75k, 5.1% for AGIs $75k-100k, 7.4% for AGIs over 100k)
IRA payment deduction: $3,161 (reported on 3.8% of returns)
93003:
$3,161
California:
$3,192
(% of AGI for various income ranges: 0.4% for AGIs below $10k, 0.3% for AGIs $10k-25k, 0.3% for AGIs $25k-50k, 0.2% for AGIs $50k-75k, 0.3% for AGIs $75k-100k, 0.2% for AGIs over 100k)
Self-employed pension: $14,757 (reported on 1.8% of returns)
Here:
$14,757
California:
$17,688
(% of AGI for various income ranges: 0.1% for AGIs $10k-25k, 0.1% for AGIs $25k-50k, 0.3% for AGIs $50k-75k, 0.3% for AGIs $75k-100k, 0.8% for AGIs over 100k)
Total itemized deductions: $25,353 (27% of AGI, reported on 42.7% of returns)
Here:
$25,353
State:
$28,113
Here:
27.2% of AGI
State:
25.3% of AGI
(% of AGI for various income ranges: 33.0% for AGIs below $10k, 15.3% for AGIs $10k-25k, 20.7% for AGIs $25k-50k, 19.2% for AGIs $50k-75k, 21.8% for AGIs $75k-100k, 18.4% for AGIs over 100k)
Charity contributions deductions: $3,156 (3% of AGI, reported on 38.8% of returns)
Here:
$3,156
State:
$3,923
Here:
3.3% of AGI
State:
3.3% of AGI
(% of AGI for various income ranges: 1.7% for AGIs below $10k, 1.2% for AGIs $10k-25k, 1.5% for AGIs $25k-50k, 2.0% for AGIs $50k-75k, 2.3% for AGIs $75k-100k, 2.6% for AGIs over 100k)
Total tax: $8,406 (reported on 82.0% of returns)
93003:
$8,406
State:
$10,761
(% of AGI for various income ranges: 6.3% for AGIs below $10k, 4.9% for AGIs $10k-25k, 7.6% for AGIs $25k-50k, 9.5% for AGIs $50k-75k, 10.2% for AGIs $75k-100k, 17.1% for AGIs over 100k)
Earned income credit: $1,385 (reported on 9.3% of returns)
Here:
$1,385
State:
$1,763
Percentage of individuals using paid preparers for their 2004 taxes: 64.7%
Here:
65%
State:
66%
(% for various income ranges: 55.0% for AGIs below $10k, 62.1% for AGIs $10k-25k, 64.2% for AGIs $25k-50k, 67.2% for AGIs $50k-75k, 69.8% for AGIs $75k-100k, 74.2% for AGIs over 100k)
Likely homosexual households (counted as self-reported same-sex unmarried-partner households)
Lesbian couples: 0.0% of all households
Gay men: 0.1% of all households
Household received Food Stamps/SNAP in the past 12 months: 2,060 Household did not receive Food Stamps/SNAP in the past 12 months: 18,264
Women who had a birth in the past 12 months: 377 (339 now married, 36 unmarried) Women who did not have a birth in the past 12 months: 11,169 (4,641 now married, 6,519 unmarried)
Housing units in zip code 93003 with a mortgage: 7,812 (708 second mortgage, 5 home equity loan, 470 both second mortgage and home equity loan) Houses without a mortgage: 179
Median monthly owner costs for units with a mortgage: $2,637 Median monthly owner costs for units without a mortgage: $704
Residents with income below the poverty level in 2022:
This zip code:
9.5%
Whole state:
12.2%
Residents with income below 50% of the poverty level in 2022:
This zip code:
4.4%
Whole state:
6.2%
Median number of rooms in houses and condos:
Here:
6.0
State:
6.0
Median number of rooms in apartments:
Here:
4.2
State:
3.9
Notable locations in this zip code not listed on our city pages
Notable locations in zip code 93003: Ventura Municipal Golf Course (A), Ventura County Government Center (B), Lillian Smolt Memorial Library (C), Ventura City Fire Department Station 5 (D), Ventura City Fire Department Station 3 (E). Display/hide their locations on the map
Shopping Centers: Gateway Village Shopping Center (1), College Square Shopping Center (2), Victoria Plaza Shopping Center (3), Telephone Road Plaza Shopping Center (4), Plaza Shopping Center (5), Donlon Plaza Shopping Center (6), Buenaventura Mall Shopping Center (7), Borchard Shopping Center (8), Poinsettia Plaza Shopping Center (9). Display/hide their locations on the map
Churches in zip code 93003 include: Our Lady of the Assumption Church (A), Saint Pauls Episcopal Church (B), Bible Fellowship Church (C), Calvary Chapel of Ventura (D), Church of the Foothills (E), College Heights Baptist Church (F), East Ventura Foursquare Church (G), First Christian Church (H), First Church of Christ Scientist (I). Display/hide their locations on the map
Parks in zip code 93003 include: Reynolds Park (1), Arundell Linear Park (2), Barranca Vista Park (3), Bristol Bay Linear Park (4), Camino Real Park (5), County Square Linear Park (6), Harmon Park (7), Marion Cannon Park (8), Ralston Village Linear Park (9). Display/hide their locations on the map
6,960 married couples with children.
2,898 single-parent households (963 men, 1,935 women).
77.1% of residents of 93003 zip code speak English at home.
16.2% of residents speak Spanish at home (71% very well, 16% well, 10% not well, 3% not at all).
2.7% of residents speak other Indo-European language at home (84% very well, 15% well, 1% not well).
2.5% of residents speak Asian or Pacific Island language at home (63% very well, 23% well, 13% not well, 1% not at all).
1.1% of residents speak other language at home (28% very well, 31% well, 24% not well, 16% not at all).
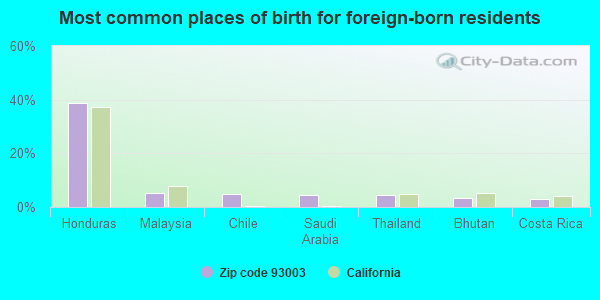
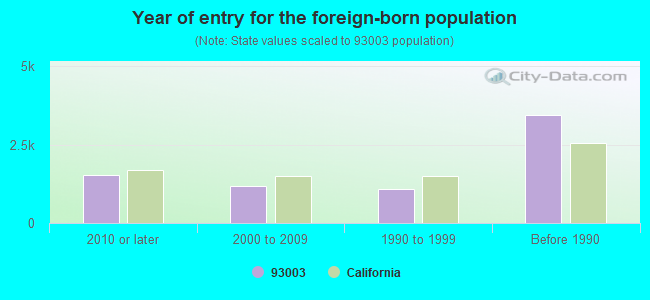
Foreign born population: 6,712 (12.7%) (60.7% of them are naturalized citizens)
Major facilities with environmental interests located in this zip code:
GOODYEAR TIRE CENTER (4547 TELEPHONE RD. in VENTURA, CA)
Small Quantity Generators, between 100 kg and 1000 kg of hazardous waste/month (Resource Conservation and Recovery Act (tracking hazardous waste)) - notification STATE MASTER (California - Used Oil Recycling System ) - USED OIL RECYCLING Organizations: BRUCE I SCHER (CONTACT/OWNER)
Alternative names: SCHER TIRE NO 21 D B A GOODYEAR, SCHER TIRE #21
CHEVRON STATION 9 0576 (920 SEAWARD AVE in VENTURA, CA)
STATE MASTER (California - Hazardous Waste Tracking) - HAZARDOU WASTE PROGRAM Large Quantity Generators, more that 1000 kg of hazardous waste/month (Resource Conservation and Recovery Act (tracking hazardous waste)) HAZARDOUS WASTE BIENNIAL REPORTER (Resource Conservation and Recovery Act (tracking hazardous waste)) Large Quantity Generators, more that 1000 kg of hazardous waste/month (Resource Conservation and Recovery Act (tracking hazardous waste)) Organizations: CHEVRON PRODUCTS CO. (CONTACT/OPERATOR)
Alternative names: CHEVRON 90576, CHEVRON STATION NO 90576
MANUFACTURING TECHNOLOGY (2226 GOODYEAR AVE in VENTURA, CA)
STATE MASTER (California - Hazardous Waste Tracking) - HAZARDOU WASTE PROGRAM HAZARDOUS WASTE BIENNIAL REPORTER (Resource Conservation and Recovery Act (tracking hazardous waste)) Large Quantity Generators, more that 1000 kg of hazardous waste/month (Resource Conservation and Recovery Act (tracking hazardous waste)) Business NAICS classification: SEMICONDUCTOR MACHINERY MANUFACTURING. Organizations: FAYVEL GRINBERG (CONTACT/OPERATOR)
, MIKE CROMER (CONTACT/OWNER)
GENERAL MAGNAPLATE CALIFORNIA (2707 PALMA DRIVE in VENTURA, CA)
STATE MASTER (California - Hazardous Waste Tracking) - HAZARDOU WASTE PROGRAM CRITERIA AND HAZARDOUS AIR POLLUTANT INVENTORY (Inventory of air pollution sources) Large Quantity Generators, more that 1000 kg of hazardous waste/month (Resource Conservation and Recovery Act (tracking hazardous waste)) Business SIC classification: ELECTROPLATING, PLATING, POLISHING, ANODIZING, AND COLORING Organizations: GENERAL MAGANPLATE CORP (CONTACT/OPERATOR)
BARBER FORD BODY SHOP (3680 MARKET ST in VENTURA, CA)
STATE MASTER (California - Hazardous Waste Tracking) - HAZARDOU WASTE PROGRAM CRITERIA AND HAZARDOUS AIR POLLUTANT INVENTORY (Inventory of air pollution sources) Small Quantity Generators, between 100 kg and 1000 kg of hazardous waste/month (Resource Conservation and Recovery Act (tracking hazardous waste)) Small Quantity Generators, between 100 kg and 1000 kg of hazardous waste/month (Resource Conservation and Recovery Act (tracking hazardous waste)) Business SIC classification: TOP, BODY, AND UPHOLSTERY REPAIR SHOPS AND PAINT SHOPS Business NAICS classification: AUTOMOTIVE BODY, PAINT, AND INTERIOR REPAIR AND MAINTENANCE. Alternative names: R E BARBER FORD
GOLD COAST RECYCLING INC (5275 COLT ST in VENTURA, CA)
HAZARDOUS WASTE BIENNIAL REPORTER (Resource Conservation and Recovery Act (tracking hazardous waste)) Large Quantity Generators, more that 1000 kg of hazardous waste/month (Resource Conservation and Recovery Act (tracking hazardous waste)) STATE MASTER (California - Used Oil Recycling System ) - USED OIL RECYCLING Business NAICS classification: HAZARDOUS WASTE COLLECTION. Alternative names: GOLD COAST RECYCLING & TRANSFER STATION
MAACO AUTO PAINTING (1571 GOODYEAR AVE in VENTURA, CA)
STATE MASTER (California - Hazardous Waste Tracking) - HAZARDOU WASTE PROGRAM CRITERIA AND HAZARDOUS AIR POLLUTANT INVENTORY (Inventory of air pollution sources) Small Quantity Generators, between 100 kg and 1000 kg of hazardous waste/month (Resource Conservation and Recovery Act (tracking hazardous waste)) - notification Business SIC classification: TOP, BODY, AND UPHOLSTERY REPAIR SHOPS AND PAINT SHOPS Business NAICS classification: AUTOMOTIVE BODY, PAINT, AND INTERIOR REPAIR AND MAINTENANCE. Organizations: SHARMA ARUN (CONTACT/OWNER)
ECLECTIC ART DESIGNS (2433 EASTMAN AVE. in VENTURA, CA)
STATE MASTER (California - Hazardous Waste Tracking) - HAZARDOU WASTE PROGRAM CRITERIA AND HAZARDOUS AIR POLLUTANT INVENTORY (Inventory of air pollution sources) Small Quantity Generators, between 100 kg and 1000 kg of hazardous waste/month (Resource Conservation and Recovery Act (tracking hazardous waste)) - notification TRI REPORTER (Tracking of toxic chemicals releasing facilities) Business SIC classification: WOOD PRODUCTS
FISHER MARTIN AUTO MOTIVE (6665 VENTURA BLVD in VENTURA, CA)
STATE MASTER (California - Hazardous Waste Tracking) - HAZARDOU WASTE PROGRAM Small Quantity Generators, between 100 kg and 1000 kg of hazardous waste/month (Resource Conservation and Recovery Act (tracking hazardous waste)) - notification Business NAICS classification: GENERAL AUTOMOTIVE REPAIR. Organizations: EDWARD FISHER (CONTACT/OWNER)
GOLD COAST ACURA (3195 PERKIN AVE in VENTURA, CA)
STATE MASTER (California - Hazardous Waste Tracking) - HAZARDOU WASTE PROGRAM CRITERIA AND HAZARDOUS AIR POLLUTANT INVENTORY (Inventory of air pollution sources) Small Quantity Generators, between 100 kg and 1000 kg of hazardous waste/month (Resource Conservation and Recovery Act (tracking hazardous waste)) Business SIC classification: TOP, BODY, AND UPHOLSTERY REPAIR SHOPS AND PAINT SHOPS
BARBER FORD WESTLAND ASSOC DELAINE (3440 E MAIN ST in VENTURA, CA)
STATE MASTER (California - Hazardous Waste Tracking) - HAZARDOU WASTE PROGRAM Small Quantity Generators, between 100 kg and 1000 kg of hazardous waste/month (Resource Conservation and Recovery Act (tracking hazardous waste)) - notification Organizations: BILL HICKS (CONTACT/OWNER)
EQUILON ENTERPRISES (2099 E HARBOR in VENTURA, CA) . Federal Facility
STATE MASTER (California - Hazardous Waste Tracking) - HAZARDOU WASTE PROGRAM CRITERIA AND HAZARDOUS AIR POLLUTANT INVENTORY (Inventory of air pollution sources) Small Quantity Generators, between 100 kg and 1000 kg of hazardous waste/month (Resource Conservation and Recovery Act (tracking hazardous waste)) - notification Business SIC classification: GASOLINE SERVICE STATIONS Organizations: EQUILON ENTERPRISES, LLC (CONTACT/OWNER)
Alternative names: SEAWARD SHELL, SHELL OIL CO
GLIDDEN CO DBA ICI PAINTS (4115 E MAIN in VENTURA, CA)
STATE MASTER (California - Hazardous Waste Tracking) - HAZARDOU WASTE PROGRAM Small Quantity Generators, between 100 kg and 1000 kg of hazardous waste/month (Resource Conservation and Recovery Act (tracking hazardous waste)) Organizations: SINCLAIR PROPERTIES II LLC (CONTACT/OWNER)
Housing units lacking complete plumbing facilities: 1.0% Housing units lacking complete kitchen facilities: 2.9%
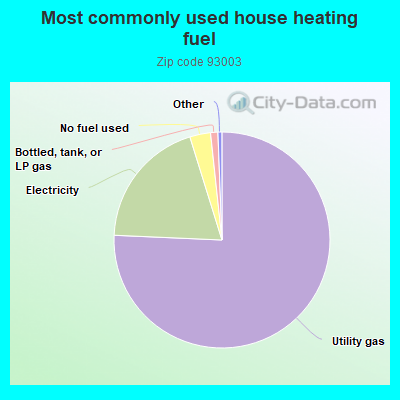
75.7%Utility gas
19.5%Electricity
3.1%No fuel used
1.1%Bottled, tank, or LP gas
Population in 1990: 44,627. Population change in the 1990s: +2,264 (+5.1%).
Place of birth for U.S.-born residents:
This state: 35,209
Northeast: 2,307
Midwest: 3,142
South: 2,141
West: 2,588
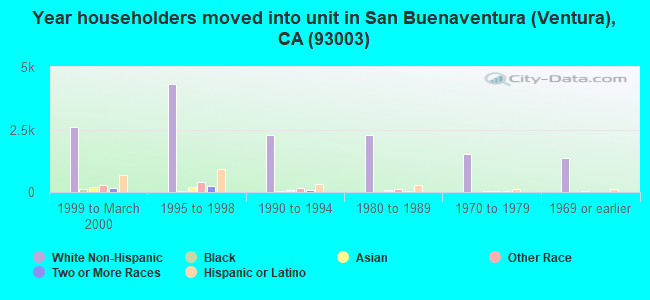
49% of the 93003 zip code residents lived in the same house 5 years ago. Out of people who lived in different houses, 63% lived in this county. Out of people who lived in different counties, 50% lived in California.
89% of the 93003 zip code residents lived in the same house 1 year ago. Out of people who lived in different houses, 65% moved from this county. Out of people who lived in different houses, 23% moved from different county within same state. Out of people who lived in different houses, 7% moved from different state. Out of people who lived in different houses, 3% moved from abroad.
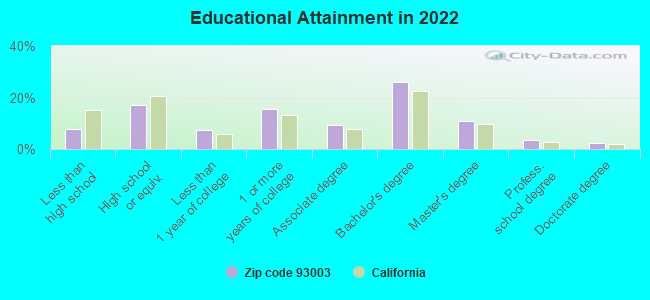
Private vs. public school enrollment:
Students in private schools in grades 1 to 8 (elementary and middle school): 569
Here:
12.0%
California:
10.5%
Students in private schools in grades 9 to 12 (high school): 144
Here:
4.4%
California:
8.5%
Students in private undergraduate colleges: 263
Here:
11.4%
California:
15.9%
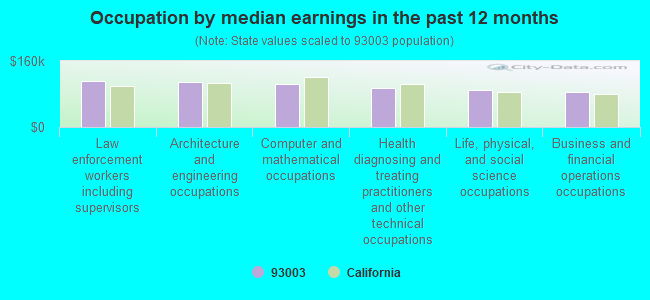
Occupation by median earnings in the past 12 months ($)
112,416Law enforcement workers including supervisors
109,833Architecture and engineering occupations
103,769Computer and mathematical occupations
95,320Health diagnosing and treating practitioners and other technical occupations
90,117Life, physical, and social science occupations
84,337Business and financial operations occupations
Companies with biggest federal contracts located in this zip code (VENTURA, CA):
HARBOR OFFSHORE INC (5720 NICOLLE STREET; small business) : $44,761,420 in 63 contractsfrom 2002 to 2006
Contracts for Engineering and Technical Services, Maintenance, Repair or Alteration of Real Property -- Other Conservation and Development Facilities, Construction of Structures and Facilities -- Dams, Maintenance, Repair or Alteration of Real Property -- Dams, and moreby Navy, Bureau of Reclamation Signed by year:2000: $0; 2001: $0; 2002: $11,537,694; 2003: $1,249,666; 2004: $13,838,116; 2005: $17,153,000; 2006: $982,944.
Biggest contracts:
$7,458,399 with Navy for Engineering and Technical Services. Signed on 2004-07-08. Completion date: 2005-01-31.
$5,841,292, same as above.Signed on 2005-07-21. Completion date: 2005-10-31.
$3,515,541, same as above.Signed on 2002-12-09. Completion date: 2003-04-07.
$2,731,332, same as above.Signed on 2005-08-08. Completion date: 2005-10-31.
AMERICAN BUILDING AUTOMATION, (2686 JOHNSON DRIVE, SUITE; small business) : $10,952,788 in 73 contractsfrom 2000 to 2006
Contracts for Maintenance, Repair and Rebuilding of Equipment -- Refrigeration, Air Conditioning, and Air Circulating Equipment, Maintenance, Repair or Alteration of Real Property -- Government-Owned Government-Operated (GOGO) R&D Facilities, Maintenance, Repair or Alteration of Real Property -- Other Administrative Facilities and Service Buildings, Maintenance, Repair or Alteration of Real Property -- Miscellaneous Buildings, and moreby Navy, Air Force, National Park Service Signed by year:2000: $1,088,287; 2001: $1,693,227; 2002: $1,560,819; 2003: $1,560,040; 2004: $2,251,812; 2005: $2,457,197; 2006: $341,406.
Biggest contracts:
$1,029,574 with Navy for Maintenance, Repair and Rebuilding of Equipment -- Refrigeration, Air Conditioning, and Air Circulating Equipment. Signed on 2005-09-28. Completion date: 2005-09-30.
$1,025,453 with Navy for Maintenance, Repair or Alteration of Real Property -- Government-Owned Government-Operated (GOGO) R&D Facilities. Signed on 2002-10-01. Completion date: 2003-10-01.
$999,587 with Navy for Maintenance, Repair and Rebuilding of Equipment -- Refrigeration, Air Conditioning, and Air Circulating Equipment. Signed on 2004-09-27. Completion date: 2005-09-30.
$995,585 with Navy for Maintenance, Repair or Alteration of Real Property -- Government-Owned Government-Operated (GOGO) R&D Facilities. Signed on 2001-10-01. Completion date: 2000-10-01.
TPI CONSTRUCTION, INC (2452 ALAMEDA AVE; small business) : $6,001,229 in 60 contractsfrom 2000 to 2005
Contracts for Maintenance, Repair or Alteration of Real Property -- Other Airfield Structures, Maintenance, Repair or Alteration of Real Property -- Miscellaneous Buildings, Construction of Structures and Facilities -- Miscellaneous Buildings, Maintenance, Repair or Alteration of Real Property -- Other Industrial Buildings, and moreby Navy, Army Signed by year:2000: $786,000; 2001: $1,405,765; 2002: $1,293,655; 2003: $2,012,920; 2004: $475,446; 2005: $27,443; 2006: $0.
Biggest contracts:
$911,404 with Navy for Maintenance, Repair or Alteration of Real Property -- Other Airfield Structures. Signed on 2002-04-16. Completion date: 2002-10-26.
$902,150 with Navy for Maintenance, Repair or Alteration of Real Property -- Miscellaneous Buildings. Signed on 2001-08-09. Completion date: 2002-05-20.
$651,356, same as above.Signed on 2003-08-20. Completion date: 2004-05-01.
$575,000 with Navy for Construction of Structures and Facilities -- Miscellaneous Buildings. Signed on 2000-09-05. Completion date: 2001-05-18.
PACIFIC RIM SERVICES, INC (3007 BUNSEN AVE UNIT F; small business) : $5,180,099 in 39 contractsfrom 1999 to 2003
Contracts for Maintenance, Repair or Alteration of Real Property -- Other Administrative Facilities and Service Buildings, Construction of Structures and Facilities -- Other Conservation and Development Facilities, Construction of Structures and Facilities -- Dams, Construction of Structures and Facilities -- Other Non-Building Facilities, and moreby Army, U.S. Army Corps of Engineers - civil program financing only, Air Force, Navy, and others Signed by year:2000: $2,441,285; 2001: $2,306,672; 2002: $335,006; 2003: -$2,547; 2004: $0; 2005: $0; 2006: $0.
Biggest contracts:
$1,219,000 with Army for Maintenance, Repair or Alteration of Real Property -- Other Administrative Facilities and Service Buildings. Signed on 2000-06-29. Completion date: 2001-06-29.
$721,474 with U.S. Army Corps of Engineers - civil program financing only for Construction of Structures and Facilities -- Other Conservation and Development Facilities. Signed on 2001-04-19. Completion date: 2001-04-27.
$614,379 with U.S. Army Corps of Engineers - civil program financing only for Construction of Structures and Facilities -- Other Conservation and Development Facilities. Taking place in AZ. Signed on 2000-12-11. Completion date: 2000-12-11.
$555,100 with U.S. Army Corps of Engineers - civil program financing only for Construction of Structures and Facilities -- Dams. Taking place in AZ. Signed on 2001-09-29. Completion date: 2001-09-30.
CUMMINS DISTRIBUTION INC (3958 TRANSPORT ST) : $5,030,381 in 24 contractsfrom 1999 to 2006
Contracts for Miscellaneous Construction Equipment, Other Professional Services, Electrical Control Equipment, Diesel Engines and Components, and moreby Navy, NASA Signed by year:2000: $796,912; 2001: $328,924; 2002: $347,541; 2003: $841,886; 2004: $4,441; 2005: $1,774,180; 2006: $837,787.
Biggest contracts:
$837,787 with Navy for Miscellaneous Construction Equipment. Signed on 2006-03-02. Completion date: 2006-06-21.
$814,388, same as above.Signed on 2005-01-21. Completion date: 2006-06-21.
$770,296, same as above.Signed on 2003-02-27. Completion date: 2006-06-21.
$770,294, same as above.Signed on 2005-01-20. Completion date: 2006-06-21.
FUGRO WEST INC (4820 MCGRATH ST STE 100) : $2,809,245 in 22 contractsfrom 2000 to 2006
Contracts for Architect - Engineer Services (including landscaping, interior layout, and designing), Laboratory Testing Services, Land Surveys, Cadastral Services (non-construction), Quality Control Services -- Miscellaneous, and moreby U.S. Army Corps of Engineers - civil program financing only, Army, Navy, Geological Survey, and others Signed by year:2000: $50,000; 2001: $414,394; 2002: $744,789; 2003: $255,714; 2004: $476,896; 2005: $852,452; 2006: $15,000.
Biggest contracts:
$466,787 with U.S. Army Corps of Engineers - civil program financing only for Architect - Engineer Services (including landscaping, interior layout, and designing). Signed on 2002-02-05. Completion date: 2002-05-06.
$419,551 with Army for Architect - Engineer Services (including landscaping, interior layout, and designing). Signed on 2005-05-06. Completion date: 2006-01-31.
$419,551 with U.S. Army Corps of Engineers - civil program financing only for Architect - Engineer Services (including landscaping, interior layout, and designing). Signed on 2005-05-06. Completion date: 2006-01-31.
$259,894, same as above.Signed on 2001-07-11. Completion date: 2002-01-12.
HARRISON & SONS INC, E J (5275 COLT ST) : $2,566,023 in 12 contractsfrom 1999 to 2002
Contracts for Trash/Garbage Collection Services - Including Portable Sanitation Services by Navy Signed by year:2000: $824,417; 2001: $848,062; 2002: $18,680; 2003: $0; 2004: $0; 2005: $0; 2006: $0.
Biggest contracts:
$896,736 with Navy for Trash/Garbage Collection Services - Including Portable Sanitation Services. Signed on 2000-11-20. Completion date: 2001-11-21.
$874,864, same as above.Signed on 1999-11-19. Completion date: 2000-11-21.
$844,366, same as above.Signed on 2001-11-21. Completion date: 2002-11-21.
$7,513, same as above.Signed on 2002-09-11. Completion date: 2002-09-30.
RDY SALES, INC (2954 SEABORG AVENUE; small business) : $1,470,673 in 8 contractsfrom 2000 to 2005
Contracts for Maintenance, Repair and Rebuilding of Equipment -- Instruments and Laboratory Equipment, Maintenance, Repair and Rebuilding of Equipment -- Office Machines, Text Processing Systems and Visible Record Equipment, Maintenance, Repair and Rebuilding of Equipment -- Automatic Data Processing Equipment (Including Firmware), Software, Supplies and Support Equipment, ADP Software by Department of Defense, National Geospatial-Intelligence Agency Signed by year:2000: $260,500; 2001: $216,276; 2002: $224,925; 2003: $275,409; 2004: $241,941; 2005: $251,622; 2006: $0.
Biggest contracts:
$275,409 with Department of Defense for Maintenance, Repair and Rebuilding of Equipment -- Instruments and Laboratory Equipment. Signed on 2003-06-05. Completion date: 2004-06-04.
$241,941 with National Geospatial-Intelligence Agency for Maintenance, Repair and Rebuilding of Equipment -- Instruments and Laboratory Equipment. Signed on 2004-05-20. Completion date: 2004-06-04.
$229,223 with Department of Defense for Maintenance, Repair and Rebuilding of Equipment -- Instruments and Laboratory Equipment. Signed on 2005-05-26. Completion date: 2006-06-04.
$224,925 with Department of Defense for Maintenance, Repair and Rebuilding of Equipment -- Instruments and Laboratory Equipment. Taking place in VA. Signed on 2002-05-16. Completion date: 2003-05-22.
G & G TECHNOLOGY INC (2064 EASTMAN AVE SUITE 107; small business) : $992,010 in 4 contractsfrom 2002 to 2006
$748,472 with Army for Other Defense -- Applied Research and Exploratory Development (R&D). Signed on 2004-09-30. Completion date: 2006-01-30.
$100,000, same as above.Signed on 2006-03-21. Completion date: 2006-04-30.
$95,313, same as above.Signed on 2002-10-30. Completion date: 2003-06-24.
$48,225, same as above.Signed on 2003-04-30. Completion date: 2003-06-24.
DWG & ASSOC INC (4464 MCGRATH ST; small business) : $985,936 in 4 contractsfrom 2005 to 2006
$460,426 with Navy for Maintenance, Repair or Alteration of Real Property -- Miscellaneous Buildings. Signed on 2005-04-18. Completion date: 2005-10-15.
$317,504, same as above.Signed on 2005-09-02. Completion date: 2006-03-15.
$167,396, same as above.Signed on 2006-03-30. Completion date: 2006-11-20.
$40,610, same as above.Signed on 2005-11-22. Completion date: 2005-10-15.
Top industries in this zip code by the number of employees in 2005:
Health Care and Social Assistance: General Medical and Surgical Hospitals (over 1000 employees: 2 establishments)
Administrative and Support and Waste Management and Remediation Services: Professional Employer Organizations (over 1000: 1, 20-49: 1)
Health Care and Social Assistance: Offices of Physicians (except Mental Health Specialists) (100-249: 1, 50-99: 3, 20-49: 4, 10-19: 22, 5-9: 29, 1-4: 79)
Administrative and Support and Waste Management and Remediation Services: Temporary Help Services (250-499: 1, 100-249: 1, 50-99: 4, 10-19: 2, 5-9: 1, 1-4: 1)
Accommodation and Food Services: Food Service Contractors (500-999: 1)
People in group quarters in 2010:
1,412 people in local jails and other municipal confinement facilities
293 people in nursing facilities/skilled-nursing facilities
166 people in emergency and transitional shelters (with sleeping facilities) for people experiencing homelessness
112 people in group homes intended for adults
14 people in residential treatment centers for adults
10 people in group homes for juveniles (non-correctional)
10 people in other noninstitutional facilities
6 people in residential treatment centers for juveniles (non-correctional)
5 people in workers' group living quarters and job corps centers
People in group quarters in 2000:
695 people in local jails and other confinement facilities (including police lockups)
391 people in nursing homes
112 people in short-term care, detention or diagnostic centers for delinquent children
109 people in other noninstitutional group quarters
84 people in other group homes
46 people in training schools for juvenile delinquents
28 people in religious group quarters
27 people in homes or halfway houses for drug/alcohol abuse
25 people in homes for the mentally retarded
15 people in unknown juvenile institutions
2 people in hospitals/wards and hospices for chronically ill
2 people in other hospitals or wards for chronically ill
2 people in mental (psychiatric) hospitals or wards
Fatal accident statistics in 2014:
Fatal accident count: 5
Vehicles involved in fatal accidents: 7
Fatal accidents caused by drunken drivers: 1
Fatalities: 5
Persons involved in fatal accidents: 8
Pedestrians involved in fatal accidents: 1
Fatal accident statistics in 2013:
Fatal accident count: 4
Vehicles involved in fatal accidents: 5
Fatal accidents caused by drunken drivers: 0
Fatalities: 5
Persons involved in fatal accidents: 4
Pedestrians involved in fatal accidents: 2
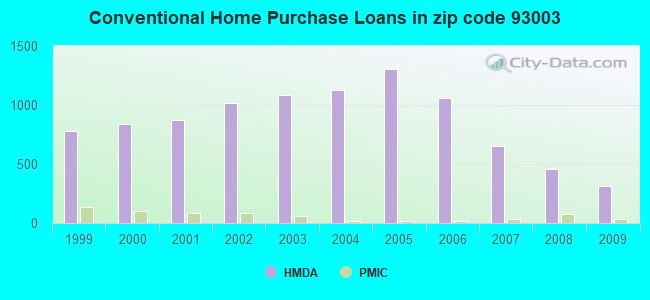
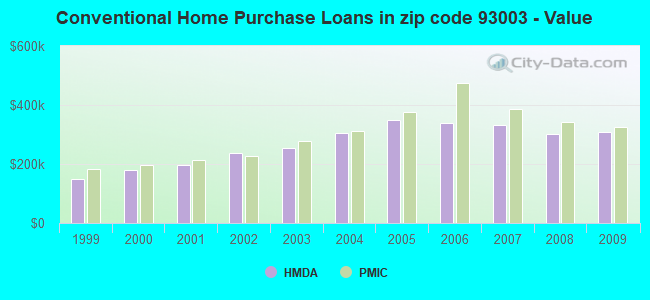
Home Mortgage Disclosure Act Aggregated Statistics For Year 2009 (Based on 10 full and 8 partial tracts)
A) FHA, FSA/RHS & VA Home Purchase Loans
B) Conventional Home Purchase Loans
C) Refinancings
D) Home Improvement Loans
E) Loans on Dwellings For 5+ Families
F) Non-occupant Loans on < 5 Family Dwellings (A B C & D)
G) Loans On Manufactured Home Dwelling (A B C & D)
Number
Average Value
Number
Average Value
Number
Average Value
Number
Average Value
Number
Average Value
Number
Average Value
Number
Average Value
LOANS ORIGINATED
127
$331,621
313
$309,956
1,481
$302,423
83
$231,086
1
$364,810
124
$237,235
18
$97,987
APPLICATIONS APPROVED, NOT ACCEPTED
22
$299,063
40
$246,049
145
$322,304
4
$116,748
0
$0
12
$269,493
10
$91,755
APPLICATIONS DENIED
24
$291,217
87
$265,617
379
$351,827
17
$231,508
0
$0
48
$226,518
21
$122,580
APPLICATIONS WITHDRAWN
22
$419,439
57
$354,930
285
$338,571
9
$187,391
0
$0
30
$265,549
2
$67,990
FILES CLOSED FOR INCOMPLETENESS
7
$331,136
10
$336,700
65
$355,984
4
$175,410
0
$0
6
$213,553
1
$54,000
Aggregated Statistics For Year 2008 (Based on 10 full and 8 partial tracts)
A) FHA, FSA/RHS & VA Home Purchase Loans
B) Conventional Home Purchase Loans
C) Refinancings
D) Home Improvement Loans
E) Loans on Dwellings For 5+ Families
F) Non-occupant Loans on < 5 Family Dwellings (A B C & D)
G) Loans On Manufactured Home Dwelling (A B C & D)
Number
Average Value
Number
Average Value
Number
Average Value
Number
Average Value
Number
Average Value
Number
Average Value
Number
Average Value
LOANS ORIGINATED
91
$341,965
458
$302,589
620
$294,688
41
$216,886
4
$1,426,142
122
$265,302
27
$107,509
APPLICATIONS APPROVED, NOT ACCEPTED
11
$348,558
95
$281,893
118
$343,566
8
$368,010
0
$0
15
$340,253
22
$152,116
APPLICATIONS DENIED
17
$317,268
115
$292,233
297
$359,072
47
$255,284
0
$0
46
$256,204
27
$121,839
APPLICATIONS WITHDRAWN
19
$309,833
96
$294,219
149
$326,460
16
$231,819
0
$0
22
$217,980
2
$133,500
FILES CLOSED FOR INCOMPLETENESS
7
$267,720
24
$361,950
40
$361,656
2
$40,385
0
$0
4
$252,920
2
$454,675
Aggregated Statistics For Year 2007 (Based on 10 full and 8 partial tracts)
A) FHA, FSA/RHS & VA Home Purchase Loans
B) Conventional Home Purchase Loans
C) Refinancings
D) Home Improvement Loans
E) Loans on Dwellings For 5+ Families
F) Non-occupant Loans on < 5 Family Dwellings (A B C & D)
G) Loans On Manufactured Home Dwelling (A B C & D)
Number
Average Value
Number
Average Value
Number
Average Value
Number
Average Value
Number
Average Value
Number
Average Value
Number
Average Value
LOANS ORIGINATED
1
$204,000
652
$333,515
1,086
$336,449
142
$211,033
10
$2,190,305
169
$308,501
34
$86,788
APPLICATIONS APPROVED, NOT ACCEPTED
2
$114,840
165
$316,574
296
$340,287
31
$205,234
0
$0
31
$295,023
19
$87,540
APPLICATIONS DENIED
0
$0
185
$309,577
618
$383,708
63
$221,584
0
$0
61
$351,689
21
$90,165
APPLICATIONS WITHDRAWN
0
$0
109
$326,743
275
$368,864
24
$276,142
0
$0
35
$319,683
8
$149,722
FILES CLOSED FOR INCOMPLETENESS
0
$0
33
$382,086
99
$377,847
5
$333,652
0
$0
16
$329,713
0
$0
Aggregated Statistics For Year 2006 (Based on 10 full and 8 partial tracts)
A) FHA, FSA/RHS & VA Home Purchase Loans
B) Conventional Home Purchase Loans
C) Refinancings
D) Home Improvement Loans
E) Loans on Dwellings For 5+ Families
F) Non-occupant Loans on < 5 Family Dwellings (A B C & D)
G) Loans On Manufactured Home Dwelling (A B C & D)
Number
Average Value
Number
Average Value
Number
Average Value
Number
Average Value
Number
Average Value
Number
Average Value
Number
Average Value
LOANS ORIGINATED
1
$321,000
1,061
$339,001
1,507
$341,853
229
$215,199
5
$3,254,472
208
$318,717
34
$92,902
APPLICATIONS APPROVED, NOT ACCEPTED
0
$0
211
$347,761
301
$335,697
29
$201,667
0
$0
36
$306,098
17
$94,794
APPLICATIONS DENIED
0
$0
312
$335,002
632
$396,434
108
$216,519
0
$0
50
$368,330
24
$141,645
APPLICATIONS WITHDRAWN
0
$0
313
$306,952
448
$366,418
45
$248,261
0
$0
75
$290,824
11
$112,994
FILES CLOSED FOR INCOMPLETENESS
0
$0
26
$337,018
106
$343,263
6
$176,442
0
$0
7
$371,796
9
$224,932
Aggregated Statistics For Year 2005 (Based on 10 full and 8 partial tracts)
A) FHA, FSA/RHS & VA Home Purchase Loans
B) Conventional Home Purchase Loans
C) Refinancings
D) Home Improvement Loans
E) Loans on Dwellings For 5+ Families
F) Non-occupant Loans on < 5 Family Dwellings (A B C & D)
G) Loans On Manufactured Home Dwelling (A B C & D)
Number
Average Value
Number
Average Value
Number
Average Value
Number
Average Value
Number
Average Value
Number
Average Value
Number
Average Value
LOANS ORIGINATED
1
$262,000
1,302
$350,439
1,861
$335,867
248
$245,361
6
$2,187,150
276
$336,638
48
$105,414
APPLICATIONS APPROVED, NOT ACCEPTED
0
$0
146
$298,685
269
$337,406
28
$233,892
0
$0
35
$268,464
13
$128,036
APPLICATIONS DENIED
1
$232,000
305
$331,843
530
$348,559
78
$175,942
0
$0
55
$361,015
43
$115,520
APPLICATIONS WITHDRAWN
2
$273,175
271
$336,057
507
$329,541
60
$300,757
0
$0
51
$347,848
28
$133,378
FILES CLOSED FOR INCOMPLETENESS
0
$0
55
$344,576
161
$390,751
11
$172,991
0
$0
8
$325,581
2
$64,000
Aggregated Statistics For Year 2004 (Based on 10 full and 8 partial tracts)
A) FHA, FSA/RHS & VA Home Purchase Loans
B) Conventional Home Purchase Loans
C) Refinancings
D) Home Improvement Loans
E) Loans on Dwellings For 5+ Families
F) Non-occupant Loans on < 5 Family Dwellings (A B C & D)
G) Loans On Manufactured Home Dwelling (A B C & D)
Number
Average Value
Number
Average Value
Number
Average Value
Number
Average Value
Number
Average Value
Number
Average Value
Number
Average Value
LOANS ORIGINATED
6
$239,958
1,126
$306,501
2,375
$275,433
228
$223,584
7
$1,518,339
313
$266,327
46
$92,378
APPLICATIONS APPROVED, NOT ACCEPTED
0
$0
168
$294,524
345
$266,520
31
$98,559
1
$361,550
45
$266,139
22
$91,468
APPLICATIONS DENIED
0
$0
232
$280,150
538
$272,309
82
$139,837
0
$0
65
$234,284
34
$85,817
APPLICATIONS WITHDRAWN
1
$211,000
193
$280,511
590
$280,629
61
$126,487
1
$805,270
39
$281,352
47
$86,894
FILES CLOSED FOR INCOMPLETENESS
0
$0
44
$347,680
84
$283,620
12
$72,809
0
$0
3
$242,377
1
$299,530
Aggregated Statistics For Year 2003 (Based on 10 full and 8 partial tracts)
A) FHA, FSA/RHS & VA Home Purchase Loans
B) Conventional Home Purchase Loans
C) Refinancings
D) Home Improvement Loans
E) Loans on Dwellings For 5+ Families
F) Non-occupant Loans on < 5 Family Dwellings (A B C & D)
Number
Average Value
Number
Average Value
Number
Average Value
Number
Average Value
Number
Average Value
Number
Average Value
LOANS ORIGINATED
23
$183,610
1,088
$254,267
5,400
$225,187
87
$76,614
5
$2,637,720
519
$195,051
APPLICATIONS APPROVED, NOT ACCEPTED
0
$0
129
$240,479
651
$224,506
26
$62,604
0
$0
69
$201,134
APPLICATIONS DENIED
1
$184,000
164
$232,632
633
$223,781
62
$48,338
0
$0
56
$202,264
APPLICATIONS WITHDRAWN
1
$169,820
186
$211,990
833
$230,554
24
$65,077
0
$0
55
$188,642
FILES CLOSED FOR INCOMPLETENESS
0
$0
37
$307,522
143
$238,639
7
$74,919
0
$0
10
$155,515
Aggregated Statistics For Year 2002 (Based on 9 full and 4 partial tracts)
A) FHA, FSA/RHS & VA Home Purchase Loans
B) Conventional Home Purchase Loans
C) Refinancings
D) Home Improvement Loans
E) Loans on Dwellings For 5+ Families
F) Non-occupant Loans on < 5 Family Dwellings (A B C & D)
Number
Average Value
Number
Average Value
Number
Average Value
Number
Average Value
Number
Average Value
Number
Average Value
LOANS ORIGINATED
42
$163,619
1,021
$237,089
2,793
$219,322
95
$62,980
9
$1,139,532
230
$192,627
APPLICATIONS APPROVED, NOT ACCEPTED
1
$238,000
113
$229,064
307
$232,217
17
$41,127
0
$0
17
$170,959
APPLICATIONS DENIED
3
$206,667
122
$190,265
352
$212,353
42
$39,994
0
$0
28
$200,484
APPLICATIONS WITHDRAWN
7
$183,000
156
$167,626
393
$208,717
15
$62,478
1
$449,000
27
$197,631
FILES CLOSED FOR INCOMPLETENESS
0
$0
34
$266,800
89
$206,853
3
$36,640
0
$0
13
$178,778
Aggregated Statistics For Year 2001 (Based on 9 full and 4 partial tracts)
A) FHA, FSA/RHS & VA Home Purchase Loans
B) Conventional Home Purchase Loans
C) Refinancings
D) Home Improvement Loans
E) Loans on Dwellings For 5+ Families
F) Non-occupant Loans on < 5 Family Dwellings (A B C & D)
Number
Average Value
Number
Average Value
Number
Average Value
Number
Average Value
Number
Average Value
Number
Average Value
LOANS ORIGINATED
94
$163,471
875
$198,014
1,911
$200,585
109
$57,498
0
$0
181
$140,914
APPLICATIONS APPROVED, NOT ACCEPTED
9
$170,111
111
$208,430
220
$195,104
25
$68,392
1
$20,500,000
33
$140,050
APPLICATIONS DENIED
7
$156,429
99
$179,505
299
$179,545
29
$30,183
0
$0
17
$185,158
APPLICATIONS WITHDRAWN
8
$170,315
143
$189,983
343
$181,575
22
$60,246
0
$0
26
$144,624
FILES CLOSED FOR INCOMPLETENESS
4
$155,500
26
$286,980
95
$210,408
1
$14,000
0
$0
4
$161,530
Aggregated Statistics For Year 2000 (Based on 9 full and 4 partial tracts)
A) FHA, FSA/RHS & VA Home Purchase Loans
B) Conventional Home Purchase Loans
C) Refinancings
D) Home Improvement Loans
E) Loans on Dwellings For 5+ Families
F) Non-occupant Loans on < 5 Family Dwellings (A B C & D)
Number
Average Value
Number
Average Value
Number
Average Value
Number
Average Value
Number
Average Value
Number
Average Value
LOANS ORIGINATED
130
$133,664
835
$179,843
445
$146,664
87
$44,394
1
$439,000
95
$132,867
APPLICATIONS APPROVED, NOT ACCEPTED
3
$214,527
88
$206,205
56
$176,541
34
$35,299
0
$0
3
$122,233
APPLICATIONS DENIED
8
$107,619
129
$141,084
166
$142,310
41
$30,296
1
$108,000
13
$122,707
APPLICATIONS WITHDRAWN
26
$148,692
90
$167,908
116
$134,040
19
$65,207
0
$0
5
$136,184
FILES CLOSED FOR INCOMPLETENESS
5
$137,000
46
$203,411
36
$183,358
1
$13,000
0
$0
8
$168,882
Aggregated Statistics For Year 1999 (Based on 7 full and 6 partial tracts)
A) FHA, FSA/RHS & VA Home Purchase Loans
B) Conventional Home Purchase Loans
C) Refinancings
D) Home Improvement Loans
E) Loans on Dwellings For 5+ Families
F) Non-occupant Loans on < 5 Family Dwellings (A B C & D)
2005 - 2018 National Fire Incident Reporting System (NFIRS) incidents
According to the data from the years 2005 - 2018 the average number of fire incidents per year is 66. The highest number of reported fire incidents - 192 took place in 2017, and the least - 8 in 2014. The data has a growing trend.
When looking into fire subcategories, the most incidents belonged to: Outside Fires (39.6%), and Structure Fires (38.8%).
Fire incident types reported to NFIRS in Zip Code 93003

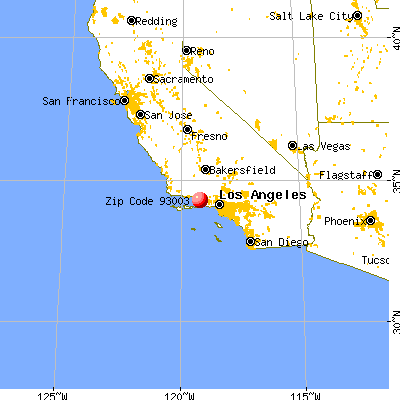


 Nearest zip codes: 93004, 93036, 93030, 93035, 93043, 93022.


 According to the data from the years 2005 - 2018 the average number of fire incidents per year is 66. The highest number of reported fire incidents - 192 took place in 2017, and the least - 8 in 2014. The data has a growing trend.
 When looking into fire subcategories, the most incidents belonged to: Outside Fires (39.6%), and Structure Fires (38.8%).