Simi Valley: Fire Incidents, California (CA)
Where are fire incidents reported in Simi Valley, CA
Something went wrong! Please refresh the page.
| Fire incidents reported | |
|---|---|
| Sreet name | Count |
| COCHRAN ST | 166 |
| LOS ANGELES AVE | 150 |
| LOS ANGELES | 120 |
| EB 118 AT | 74 |
| TAPO CANYON RD | 74 |
| ROYAL AVE | 66 |
| EB 118 WO | 64 |
| COCHRAN | 62 |
| MADERA RD | 62 |
| TAPO ST | 62 |
| ERRINGER RD | 56 |
| PATRICIA AVE | 54 |
| SYCAMORE DR | 52 |
| 1ST ST | 48 |
| WB 118 AT | 48 |
| EB 118 EO | 46 |
| WB 118 WO | 42 |
| ALAMO ST | 40 |
| EASY ST | 40 |
| TIERRA REJADA RD | 38 |
| WB 118 EO | 38 |
| YOSEMITE AVE | 32 |
| ADAM RD | 30 |
| 118 FRWY | 28 |
| KUEHNER DR | 28 |
| PATRICIA | 28 |
| ROYAL | 28 |
| STEARNS ST | 26 |
| FITZGERALD RD | 24 |
| EB 118 FWY | 22 |
| Other | 607 |
2005 - 2018 National Fire Incident Reporting System (NFIRS) incidents
- Incident types reported to NFIRS in Simi Valley, CA
- 24,54366.5%Rescue & EMS
- 4,81913.1%Good Intent Call
- 2,6767.3%Service Call
- 2,2556.1%Fire
- 1,3923.8%Hazardous Condition
- 1,0852.9%False Alarm
- 600.2%Overpressure Rupture
- Fire incident types reported to NFIRS in Simi Valley, CA
- 1,00144.4%Outside Fires
- 48721.6%Structure Fires
- 43519.3%Mobile Property/Vehicle Fires
- 33214.7%Other
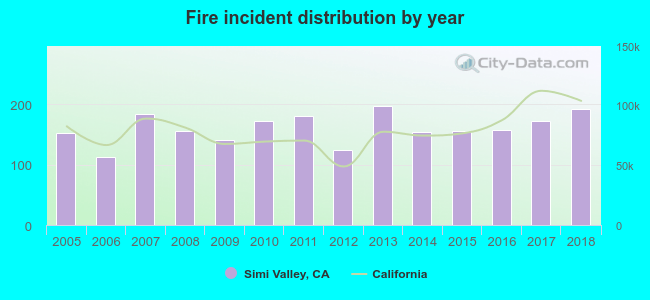 Based on the data from the years 2005 - 2018 the average number of fire incidents per year is 161. The highest number of reported fire incidents - 198 took place in 2013, and the least - 112 in 2006. The data has a rising trend.
The average number of yearly fire incidents per 10k residents in Simi Valley, CA compared to nearest cities:
(Note: Based on data for the last 3 years, including only cities with population 5,000 and above)
| Simi Valley: | 13.7 |
| Oak Park: | 6.8 |
| Moorpark: | 13.3 |
| Agoura Hills: | 13.3 |
| Thousand Oaks: | 9.7 |
| Westlake Village: | 9.0 |
| Calabasas: | 15.5 |
| Stevenson Ranch: | 6.6 |
| Fillmore: | 25.1 |
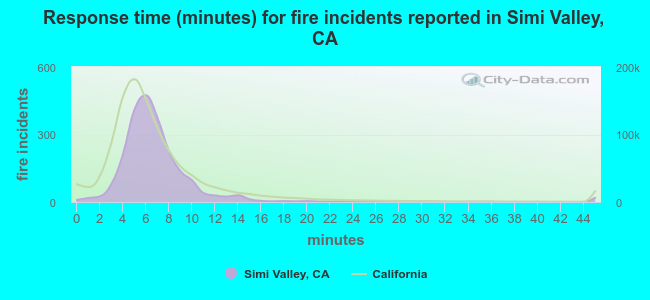 The median response time based on all reported fire incidents is 6 minutes. This is comparable to the California median value.
The median response time in Simi Valley, CA compared to nearest cities:
(Note: Based on data for all years, including only cities with at least 500 fire incidents)
| Simi Valley: | 6 minutes |
| Moorpark: | 7 minutes |
| Thousand Oaks: | 6 minutes |
| Santa Clarita: | 5 minutes |
| Malibu: | 6 minutes |
| Camarillo: | 6 minutes |
| Santa Paula: | 6 minutes |
| Santa Monica: | 5 minutes |
| Beverly Hills: | 5 minutes |
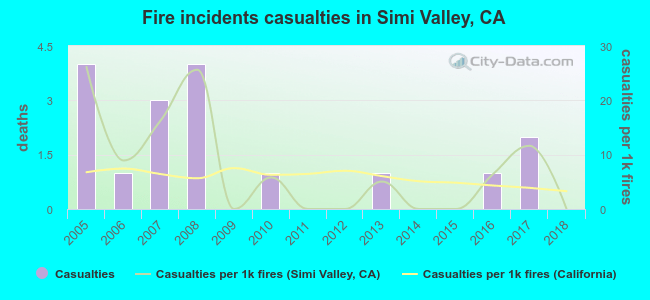 Based on the reports from the years 2005 - 2018 the average number of fire-related yearly casualties is 1. The highest number of reported injuries - 4 took place in 2005, and the lowest - 0 in 2009. The data has a decreasing trend.
The average number of injuries per 1,000 fires is 8. This indicator was the highest - 26 in 2005, and the lowest 0 in 2009. The trend for casualties per 1,000 fires is declining. Compared to the state value the number of injuries per 1,000 fires is higher.
Based on the reports from the years 2005 - 2018 the average number of fire-related yearly casualties is 1. The highest number of reported injuries - 4 took place in 2005, and the lowest - 0 in 2009. The data has a decreasing trend.
The average number of injuries per 1,000 fires is 8. This indicator was the highest - 26 in 2005, and the lowest 0 in 2009. The trend for casualties per 1,000 fires is declining. Compared to the state value the number of injuries per 1,000 fires is higher.Casualties per 1,000 incidents in Simi Valley, CA compared to nearest cities:
(Note: Based on data for all years, including only cities with at least 500 fire incidents)
| Simi Valley: | 7.5 |
| Moorpark: | 2.9 |
| Thousand Oaks: | 9.8 |
| Santa Clarita: | 0.0 |
| Malibu: | 0.0 |
| Camarillo: | 4.1 |
| Santa Paula: | 6.3 |
| Santa Monica: | 7.7 |
| Beverly Hills: | 2.4 |
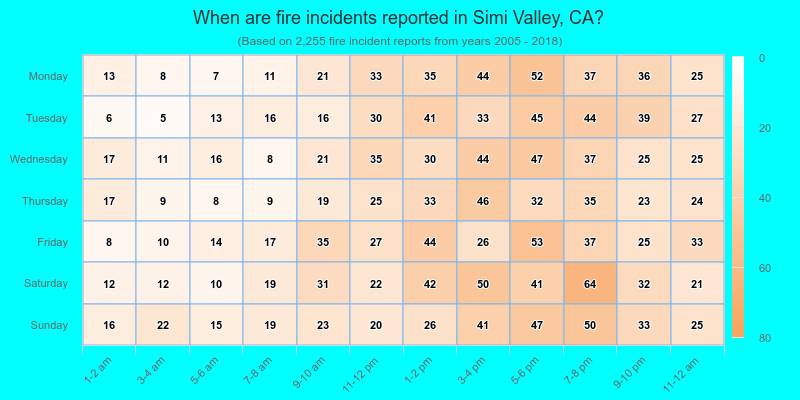
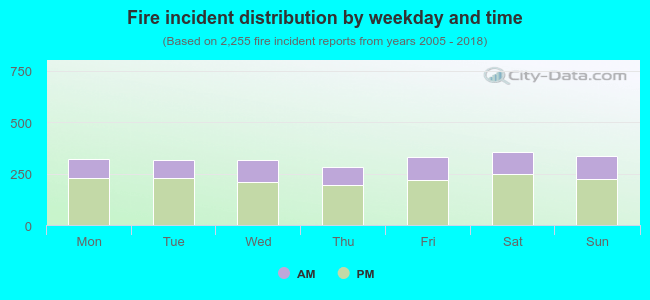 31.3% incidents where reported in the morning and 68.7% in the evening. The most fires (15.8%) took place on Saturday, and the least (12.4%) on Thursday.
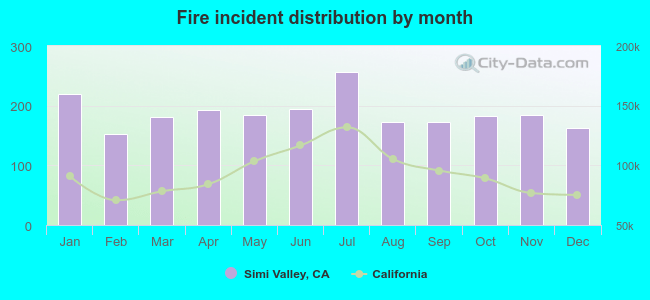 According to the 2,255 fire incident reports from years 2005 - 2018 most fires (11.4%) took place during July, and the least (6.7%) in February.
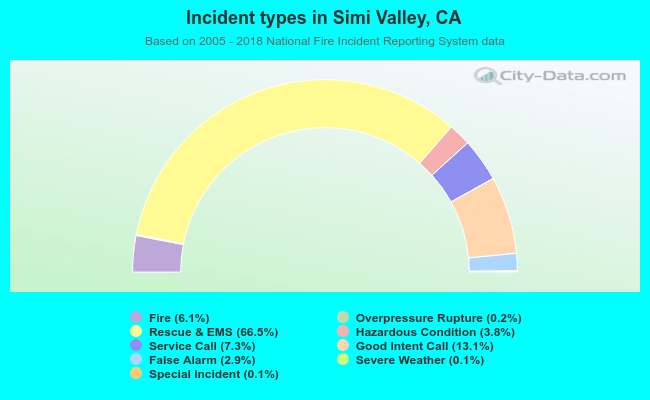 Out of all 36,884 cases reported during the years 2005 - 2018, the most belonged to the categories: Rescue & EMS (66.5%), Good Intent Call (13.1%), and Service Call (7.3%).
 When looking into fire subcategories, the most reports belonged to: Outside Fires (44.4%), and Structure Fires (21.6%).