Calabasas: Fire Incidents, California (CA)
Where are fire incidents reported in Calabasas, CA
Something went wrong! Please refresh the page.
|
| |||||||||||||||||||||||||||||||||||||||||||||||||||||||||||||||||||||||||||||||||||||||||||||||||||||||||||||
2005 - 2018 National Fire Incident Reporting System (NFIRS) incidents
- Incident types reported to NFIRS in Calabasas, CA
- 3,84749.5%Rescue & EMS
- 1,57220.2%Good Intent Call
- 1,00212.9%Service Call
- 6898.9%False Alarm
- 4105.3%Fire
- 2272.9%Hazardous Condition
- 160.2%Special Incident
- 100.1%Overpressure Rupture
- Fire incident types reported to NFIRS in Calabasas, CA
- 14234.6%Outside Fires
- 12330.0%Structure Fires
- 11828.8%Mobile Property/Vehicle Fires
- 276.6%Other
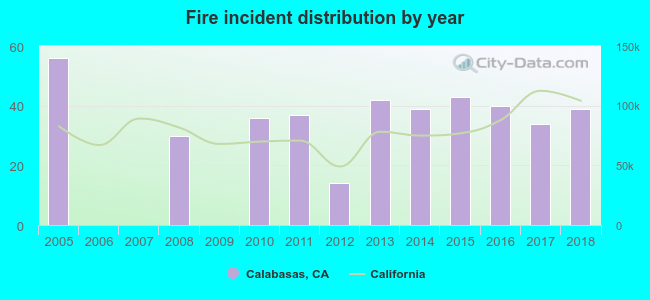 According to the data from the years 2005 - 2018 the average number of fires per year is 29. The highest number of reported fire incidents - 56 took place in 2005, and the least - 0 in 2006. The data has a dropping trend.
The average number of yearly fire incidents per 10k residents in Calabasas, CA compared to nearest cities:
(Note: Based on data for the last 3 years, including only cities with population 5,000 and above)
| Calabasas: | 15.5 |
| Topanga: | 12.9 |
| Agoura Hills: | 13.3 |
| Oak Park: | 6.8 |
| Westlake Village: | 9.0 |
| Malibu: | 37.6 |
| Simi Valley: | 13.7 |
| Thousand Oaks: | 9.7 |
| Santa Monica: | 23.0 |
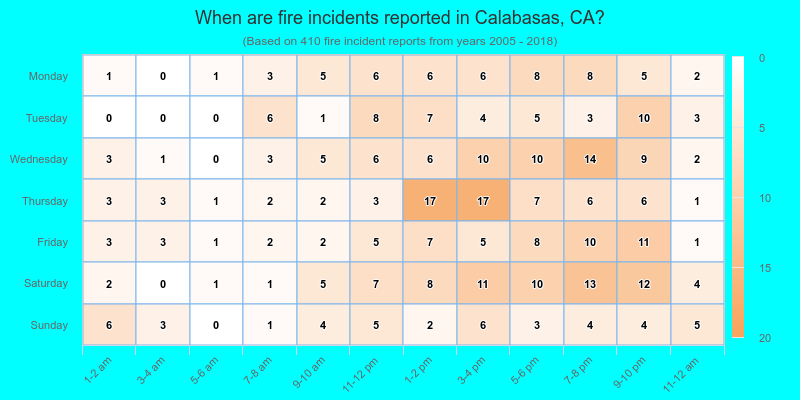
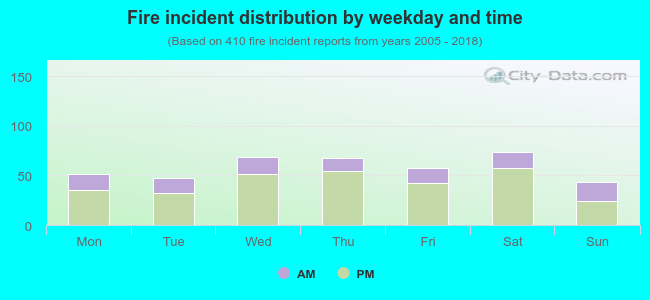 27.8% incidents where reported in the morning and 72.2% in the evening. The most fires (18.0%) took place on Saturday, and the least (10.5%) on Sunday.
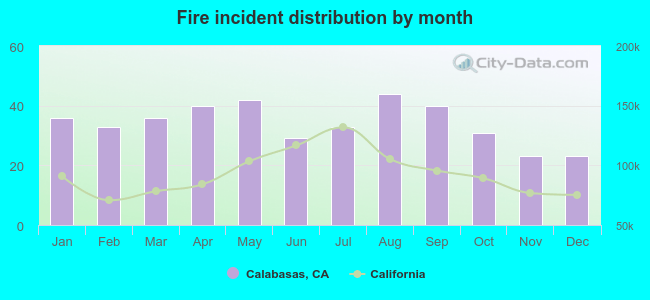 According to the 410 incident reports from years 2005 - 2018 most fires (10.7%) took place during August, and the least (5.6%) in November.
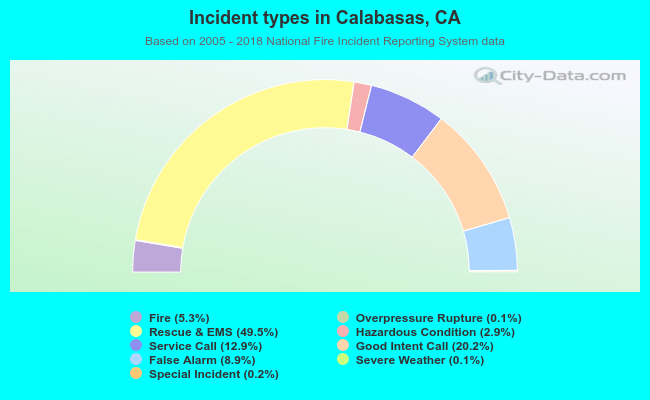 Out of all 7,777 cases reported during the years 2005 - 2018, the most belonged to the categories: Rescue & EMS (49.5%), Good Intent Call (20.2%), and Service Call (12.9%).
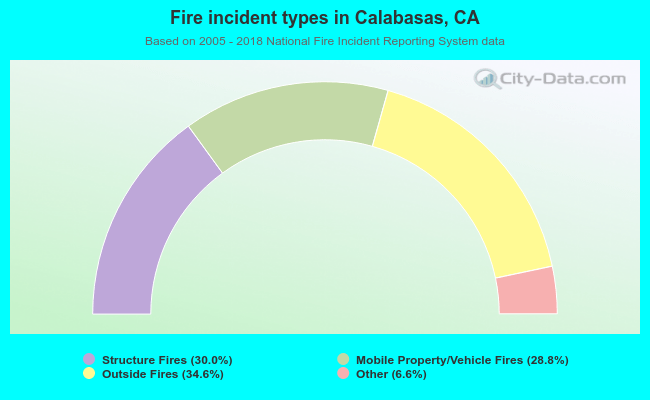 When looking into fire subcategories, the most reports belonged to: Outside Fires (34.6%), and Structure Fires (30.0%).