Agoura Hills: Fire Incidents, California (CA)
Where are fire incidents reported in Agoura Hills, CA
Something went wrong! Please refresh the page.
|
| |||||||||||||||||||||||||||||||||||||||||||||||||||||||||||||||||||||||||||||||||||||||||||||||||||||||||||||
2005 - 2018 National Fire Incident Reporting System (NFIRS) incidents
- Incident types reported to NFIRS in Agoura Hills, CA
- 3,83255.6%Rescue & EMS
- 1,41320.5%Good Intent Call
- 5668.2%Service Call
- 5087.4%False Alarm
- 3304.8%Fire
- 2073.0%Hazardous Condition
- 320.5%Special Incident
- Fire incident types reported to NFIRS in Agoura Hills, CA
- 11635.2%Structure Fires
- 9127.6%Outside Fires
- 8325.2%Mobile Property/Vehicle Fires
- 4012.1%Other
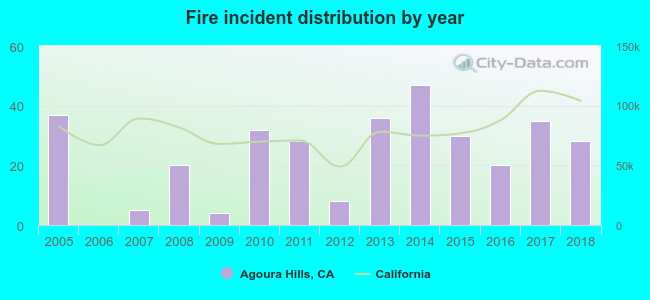 Based on the data from the years 2005 - 2018 the average number of fire incidents per year is 24. The highest number of reported fires - 47 took place in 2014, and the least - 0 in 2006. The data has a declining trend.
The average number of yearly fire incidents per 10k residents in Agoura Hills, CA compared to nearest cities:
(Note: Based on data for the last 3 years, including only cities with population 5,000 and above)
| Agoura Hills: | 13.3 |
| Oak Park: | 6.8 |
| Westlake Village: | 9.0 |
| Calabasas: | 15.5 |
| Thousand Oaks: | 9.7 |
| Simi Valley: | 13.7 |
| Malibu: | 37.6 |
| Topanga: | 12.9 |
| Moorpark: | 13.3 |
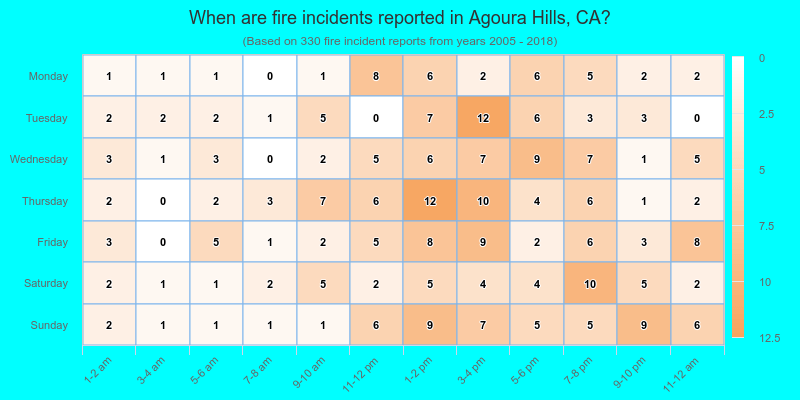
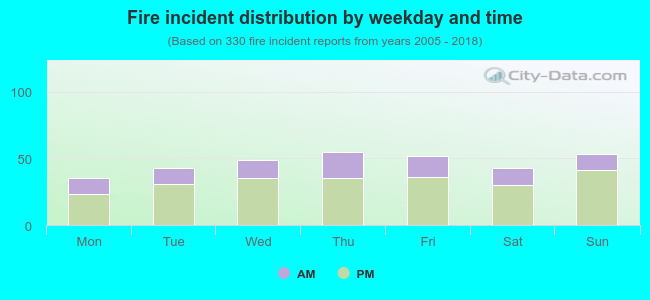 30.0% incidents where reported in the morning and 70.0% in the evening. The most fires (16.7%) took place on Thursday, and the least (10.6%) on Monday.
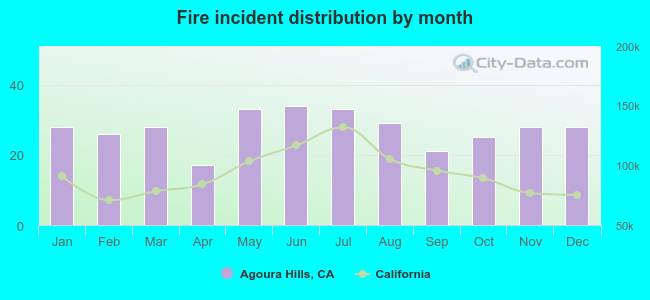 According to the 330 fires from years 2005 - 2018 most fires (10.3%) took place during June, and the least (5.2%) in April.
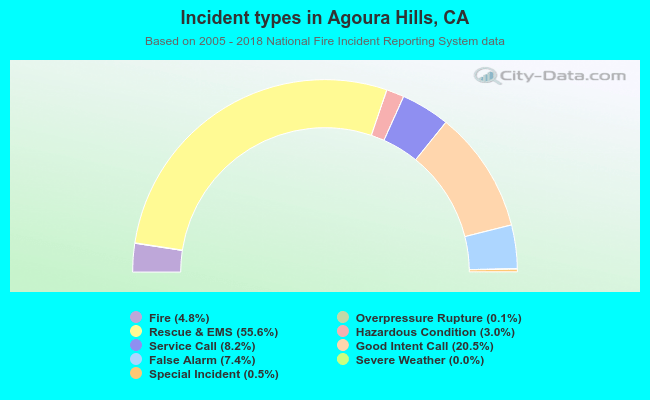 Out of all 6,896 cases reported during the years 2005 - 2018, the most belonged to the categories: Rescue & EMS (55.6%), Good Intent Call (20.5%), and Service Call (8.2%).
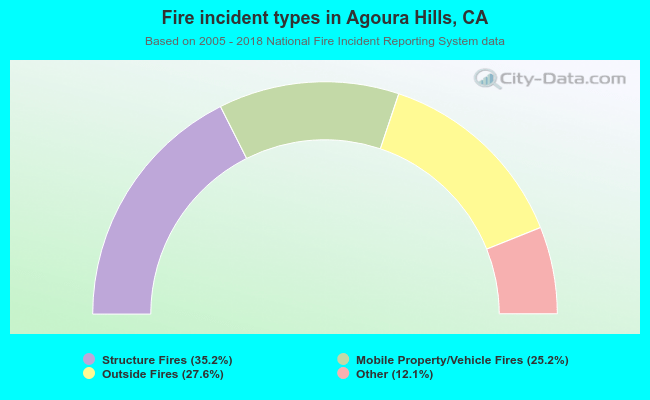 When looking into fire subcategories, the most incidents belonged to: Structure Fires (35.2%), and Outside Fires (27.6%).