Oak Park: Fire Incidents, California (CA)
Where are fire incidents reported in Oak Park, CA
Something went wrong! Please refresh the page.
|
| |||||||||||||||||||||||||||||||||||||||||||||||||||||||||||||||||||||||||||||||||||||||||||||||||||||||||||||
2005 - 2018 National Fire Incident Reporting System (NFIRS) incidents
- Incident types reported to NFIRS in Oak Park, CA
- 1,33553.5%Rescue & EMS
- 47118.9%Service Call
- 28311.4%Good Intent Call
- 1576.3%False Alarm
- 1234.9%Fire
- 1054.2%Hazardous Condition
- 110.4%Severe Weather
- 70.3%Overpressure Rupture
- Fire incident types reported to NFIRS in Oak Park, CA
- 6048.8%Structure Fires
- 2822.8%Other
- 2722.0%Outside Fires
- 86.5%Mobile Property/Vehicle Fires
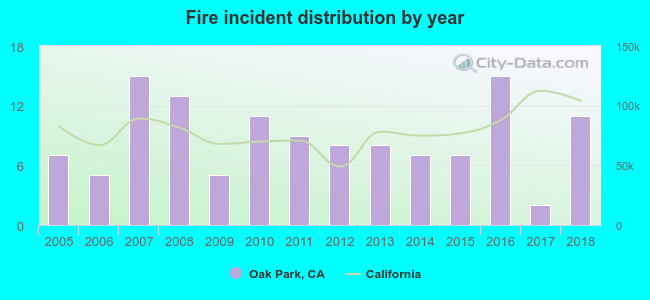 Based on the data from the years 2005 - 2018 the average number of fire incidents per year is 9. The highest number of reported fire incidents - 15 took place in 2007, and the least - 2 in 2017. The data has a rising trend.
The average number of yearly fire incidents per 10k residents in Oak Park, CA compared to nearest cities:
(Note: Based on data for the last 3 years, including only cities with population 5,000 and above)
| Oak Park: | 6.8 |
| Agoura Hills: | 13.3 |
| Westlake Village: | 9.0 |
| Calabasas: | 15.5 |
| Thousand Oaks: | 9.7 |
| Simi Valley: | 13.7 |
| Malibu: | 37.6 |
| Moorpark: | 13.3 |
| Topanga: | 12.9 |
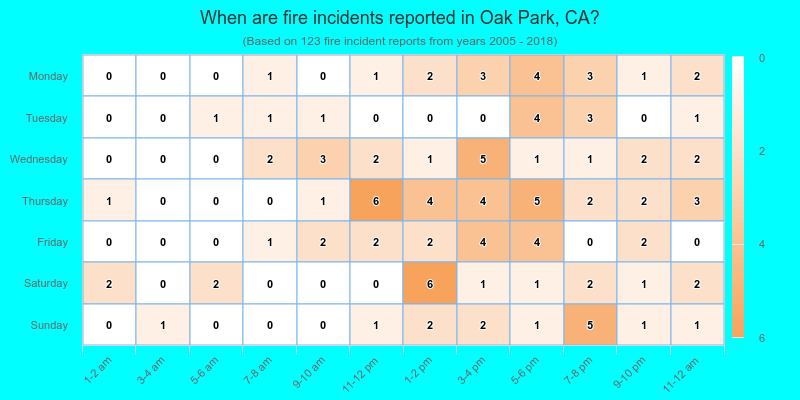
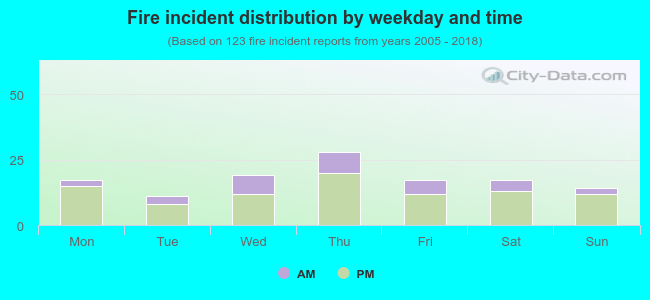 25.2% incidents where reported in the morning and 74.8% in the evening. The most fires (22.8%) took place on Thursday, and the least (8.9%) on Tuesday.
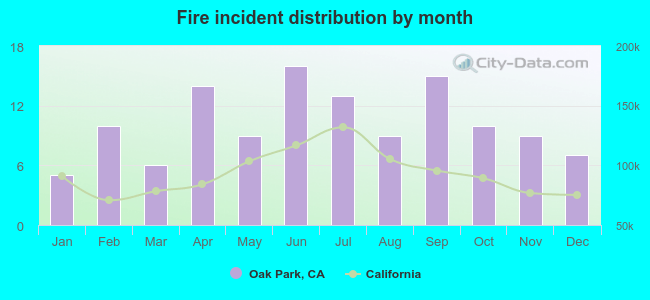 Based on the 123 incident reports from years 2005 - 2018 most fires (13.0%) took place during June, and the least (4.1%) in January.
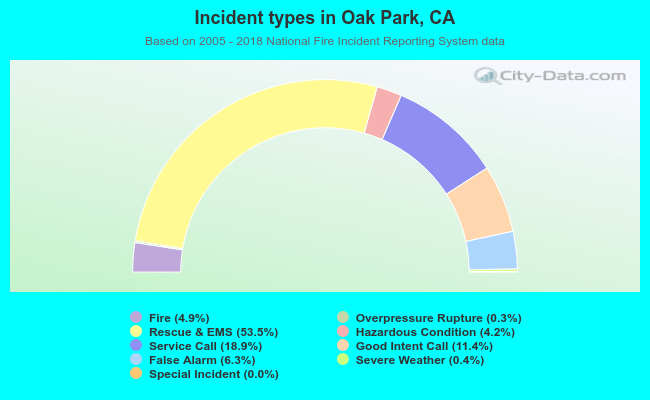 Out of all 2,493 cases reported during the years 2005 - 2018, the most belonged to the categories: Rescue & EMS (53.5%), Service Call (18.9%), and Good Intent Call (11.4%).
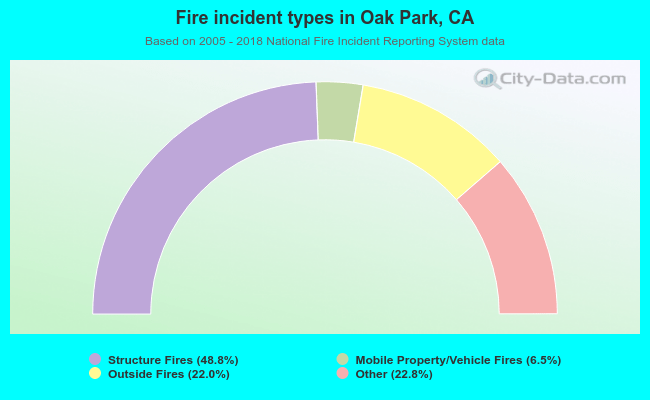 When looking into fire subcategories, the most incidents belonged to: Structure Fires (48.8%), and Other (22.8%).