Topanga: Fire Incidents, California (CA)
Where are fire incidents reported in Topanga, CA
Something went wrong! Please refresh the page.
|
| |||||||||||||||||||||||||||||||||||||||||||||||||||||||||||||||||||||||||||||||||||||||||||||||||||||
2005 - 2018 National Fire Incident Reporting System (NFIRS) incidents
- Incident types reported to NFIRS in Topanga, CA
- 1,04345.9%Rescue & EMS
- 39117.2%Good Intent Call
- 28312.4%Service Call
- 23510.3%Hazardous Condition
- 1637.2%False Alarm
- 1315.8%Fire
- 200.9%Special Incident
- 40.2%Overpressure Rupture
- 40.2%Severe Weather
- Fire incident types reported to NFIRS in Topanga, CA
- 5138.9%Outside Fires
- 3426.0%Structure Fires
- 3426.0%Mobile Property/Vehicle Fires
- 129.2%Other
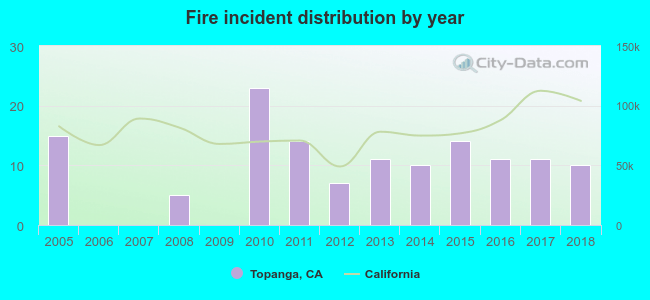 Based on the data from the years 2005 - 2018 the average number of fires per year is 9. The highest number of reported fires - 23 took place in 2010, and the least - 0 in 2006. The data has a decreasing trend.
The average number of yearly fire incidents per 10k residents in Topanga, CA compared to nearest cities:
(Note: Based on data for the last 3 years, including only cities with population 5,000 and above)
| Topanga: | 12.9 |
| Calabasas: | 15.5 |
| Santa Monica: | 23.0 |
| Agoura Hills: | 13.3 |
| Oak Park: | 6.8 |
| Malibu: | 37.6 |
| Marina del Rey: | 28.9 |
| Beverly Hills: | 24.5 |
| Los Angeles: | 16.6 |

 32.1% incidents where reported in the morning and 67.9% in the evening. The most fires (21.4%) took place on Saturday, and the least (9.9%) on Thursday.
 According to the 131 incident reports from years 2005 - 2018 most fires (14.5%) took place during July, and the least (4.6%) in April.
 Out of all 2,274 cases reported during the years 2005 - 2018, the most belonged to the categories: Rescue & EMS (45.9%), Good Intent Call (17.2%), and Service Call (12.4%).
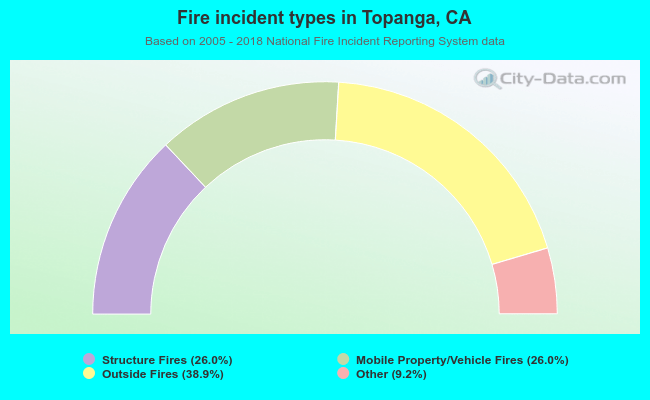 When looking into fire subcategories, the most incidents belonged to: Outside Fires (38.9%), and Structure Fires (26.0%).