Santa Monica: Fire Incidents, California (CA)
Where are fire incidents reported in Santa Monica, CA
Something went wrong! Please refresh the page.
| Fire incidents reported | |
|---|---|
| Sreet name | Count |
| LINCOLN BLVD | 118 |
| OCEAN AVE | 100 |
| 4TH ST | 96 |
| BROADWAY | 92 |
| WILSHIRE BLVD | 92 |
| OCEAN AVE | 88 |
| 3RD STREET PROM | 86 |
| 20TH ST | 84 |
| 2ND ST | 78 |
| 14TH ST | 70 |
| 5TH ST | 70 |
| MAIN ST | 68 |
| 2ND ST | 64 |
| SANTA MONICA BLVD | 64 |
| 9TH ST | 62 |
| PICO BLVD | 62 |
| SANTA MONICA BLVD | 62 |
| CLOVERFIELD BLVD | 60 |
| LINCOLN BLVD | 56 |
| OCEAN PARK BLVD | 56 |
| 6TH ST | 54 |
| OCEAN FRONT | 52 |
| 10TH ST | 50 |
| 11TH ST | 50 |
| 16TH ST | 50 |
| EUCLID ST | 50 |
| PACIFIC COAST HWY | 48 |
| WILSHIRE BLVD | 48 |
| 7TH ST | 46 |
| 17TH ST | 44 |
| Other | 181 |
2005 - 2018 National Fire Incident Reporting System (NFIRS) incidents
- Incident types reported to NFIRS in Santa Monica, CA
- 39,97062.9%Rescue & EMS
- 11,32817.8%Good Intent Call
- 4,4267.0%False Alarm
- 2,7884.4%Hazardous Condition
- 2,6174.1%Service Call
- 2,2013.5%Fire
- 1860.3%Special Incident
- Fire incident types reported to NFIRS in Santa Monica, CA
- 1,05848.1%Structure Fires
- 71132.3%Outside Fires
- 30113.7%Mobile Property/Vehicle Fires
- 1316.0%Other
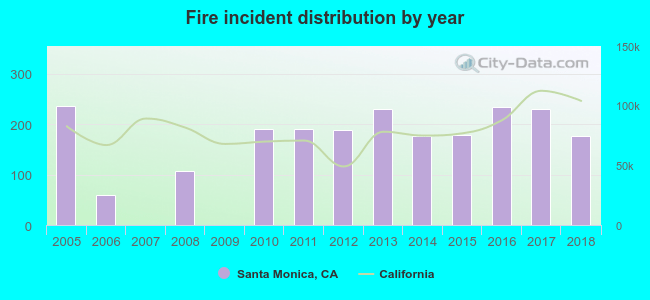 According to the data from the years 2005 - 2018 the average number of fires per year is 157. The highest number of fire incidents - 237 took place in 2005, and the least - 0 in 2007. The data has a dropping trend.
The average number of yearly fire incidents per 10k residents in Santa Monica, CA compared to nearest cities:
(Note: Based on data for the last 3 years, including only cities with population 5,000 and above)
| Santa Monica: | 23.0 |
| Marina del Rey: | 28.9 |
| Culver City: | 17.9 |
| Beverly Hills: | 24.5 |
| Ladera Heights: | 17.4 |
| Los Angeles: | 16.6 |
| West Hollywood: | 25.5 |
| El Segundo: | 31.3 |
| Topanga: | 12.9 |
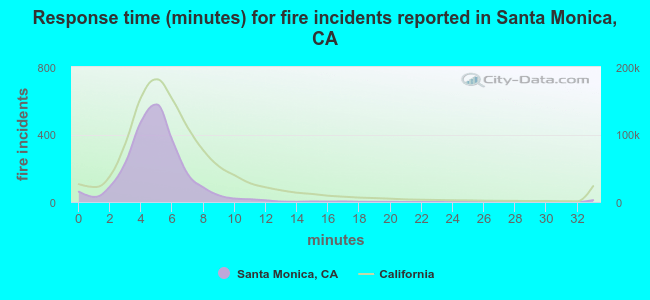 The median response time based on all reported fire incidents is 5 minutes. This is lower than the California median value.
The median response time in Santa Monica, CA compared to nearest cities:
(Note: Based on data for all years, including only cities with at least 500 fire incidents)
| Santa Monica: | 5 minutes |
| Culver City: | 6 minutes |
| Beverly Hills: | 5 minutes |
| Los Angeles: | 5 minutes |
| West Hollywood: | 4 minutes |
| El Segundo: | 5 minutes |
| Inglewood: | 4 minutes |
| Manhattan Beach: | 5 minutes |
| Hawthorne: | 4 minutes |
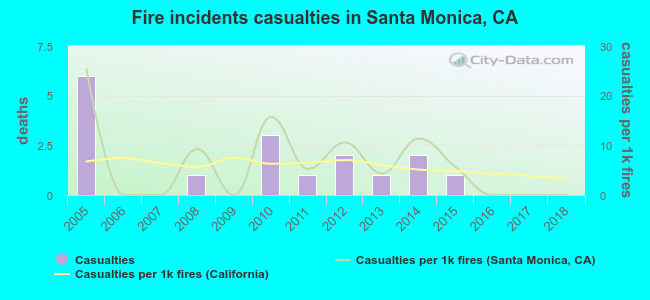 Based on the reports from the years 2005 - 2018 the average number of fire-related casualties per year is 1. The highest number of reported casualties - 6 took place in 2005, and the lowest - 0 in 2006. The data has a decreasing trend.
The average number of casualties per 1,000 fire incidents is 6. This indicator was the highest - 25 in 2005, and the lowest 0 in 2006. The trend for casualties per 1,000 incidents is decreasing. Compared to the California value the number of casualties per 1,000 fires is higher.
Based on the reports from the years 2005 - 2018 the average number of fire-related casualties per year is 1. The highest number of reported casualties - 6 took place in 2005, and the lowest - 0 in 2006. The data has a decreasing trend.
The average number of casualties per 1,000 fire incidents is 6. This indicator was the highest - 25 in 2005, and the lowest 0 in 2006. The trend for casualties per 1,000 incidents is decreasing. Compared to the California value the number of casualties per 1,000 fires is higher.Casualties per 1,000 incidents in Santa Monica, CA compared to nearest cities:
(Note: Based on data for all years, including only cities with at least 500 fire incidents)
| Santa Monica: | 7.7 |
| Culver City: | 0.0 |
| Beverly Hills: | 2.4 |
| Los Angeles: | 6.9 |
| West Hollywood: | 0.0 |
| El Segundo: | 1.5 |
| Inglewood: | 0.0 |
| Manhattan Beach: | 0.0 |
| Hawthorne: | 0.5 |
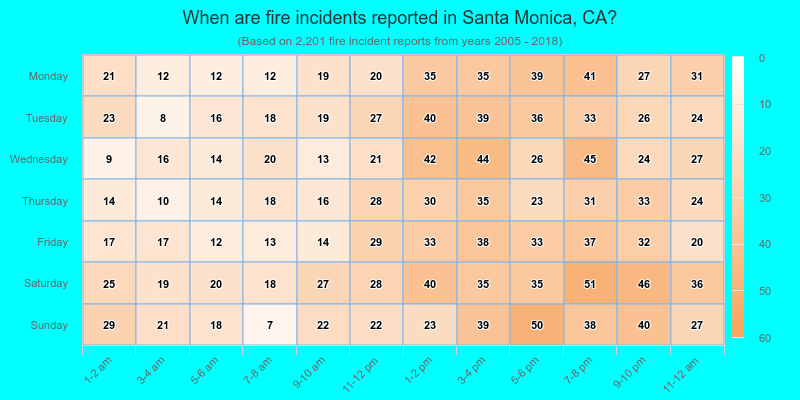
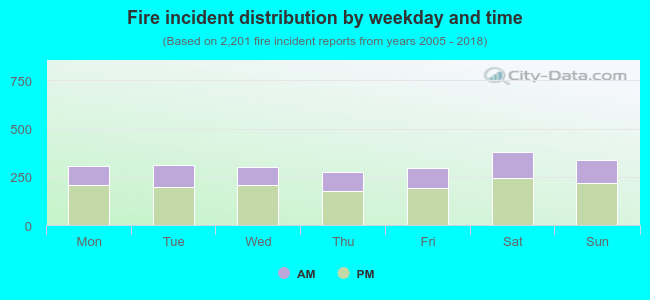 34.4% incidents where reported in the morning and 65.6% in the evening. The most fires (17.3%) took place on Saturday, and the least (12.5%) on Thursday.
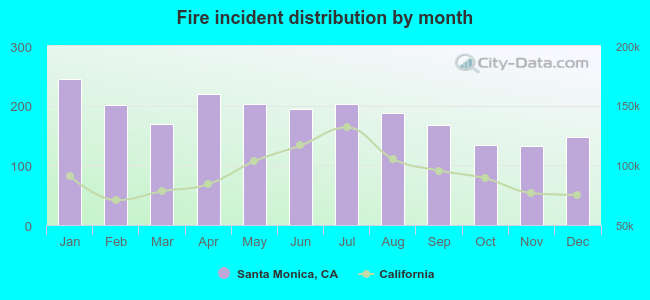 According to the 2,201 fires from years 2005 - 2018 most fires (11.1%) took place during January, and the least (6.0%) in November.
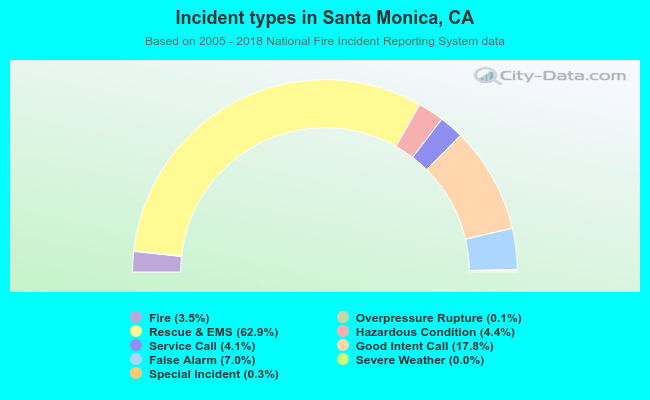 Out of all 63,579 cases reported during the years 2005 - 2018, the most belonged to the categories: Rescue & EMS (62.9%), Good Intent Call (17.8%), and False Alarm (7.0%).
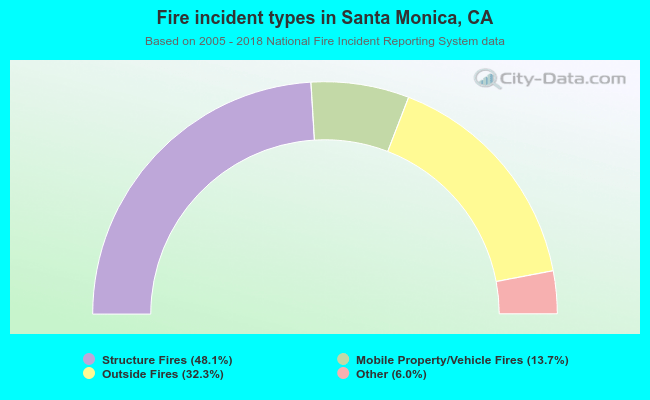 When looking into fire subcategories, the most reports belonged to: Structure Fires (48.1%), and Outside Fires (32.3%).