Manhattan Beach: Fire Incidents, California (CA)
Where are fire incidents reported in Manhattan Beach, CA
Something went wrong! Please refresh the page.
| Fire incidents reported | |
|---|---|
| Sreet name | Count |
| SEPULVEDA BL ,MAN | 70 |
| HIGHLAND AVE | 66 |
| ROSECRANS AVE | 56 |
| MANHATTAN AVE | 44 |
| MANHATTAN BEACH BLMAN | 40 |
| 10TH ST | 36 |
| 2ND ST | 34 |
| 11TH ST | 32 |
| MANHATTAN BEACH BL , | 32 |
| MARINE AVE | 32 |
| 9TH ST | 30 |
| SEPULVEDA BLMAN | 30 |
| 15TH ST | 28 |
| 6TH ST | 28 |
| 27TH ST | 26 |
| 1ST ST | 24 |
| ARTESIA BLMAN | 24 |
| MANHATTAN BEACH BL | 22 |
| PARK VIEW AVE | 22 |
| THE STRAND | 22 |
| THE STRAND ,MAN | 22 |
| 3RD ST | 20 |
| 8TH ST | 20 |
| OAK AVE | 20 |
| OCEAN DR | 20 |
| POINSETTIA AVE | 20 |
| VALLEY DR | 20 |
| 12TH ST | 18 |
| 17TH ST | 18 |
| 19TH ST | 18 |
| Other | 22 |
2002 - 2018 National Fire Incident Reporting System (NFIRS) incidents
- Incident types reported to NFIRS in Manhattan Beach, CA
- 8,19250.5%Rescue & EMS
- 2,84417.5%Hazardous Condition
- 2,22513.7%Good Intent Call
- 1,1927.4%Service Call
- 9165.7%Fire
- 7994.9%False Alarm
- 180.1%Special Incident
- 170.1%Severe Weather
- Fire incident types reported to NFIRS in Manhattan Beach, CA
- 53658.5%Structure Fires
- 21523.5%Outside Fires
- 10111.0%Mobile Property/Vehicle Fires
- 647.0%Other
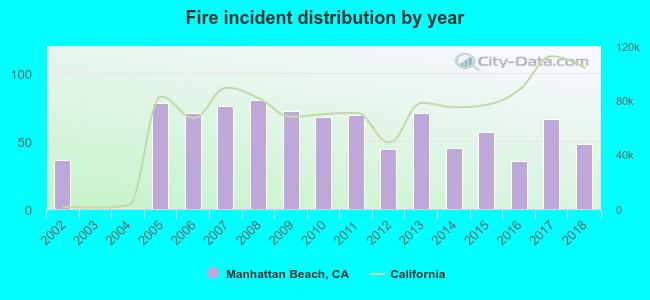 Based on the data from the years 2002 - 2018 the average number of fires per year is 54. The highest number of fire incidents - 80 took place in 2008, and the least - 0 in 2003. The data has an increasing trend.
The average number of yearly fire incidents per 10k residents in Manhattan Beach, CA compared to nearest cities:
(Note: Based on data for the last 3 years, including only cities with population 5,000 and above)
| Manhattan Beach: | 13.8 |
| Hermosa Beach: | 8.2 |
| El Segundo: | 31.3 |
| Redondo Beach: | 17.9 |
| Lawndale: | 14.3 |
| Hawthorne: | 18.5 |
| Lennox: | 13.5 |
| Torrance: | 13.1 |
| Gardena: | 27.7 |
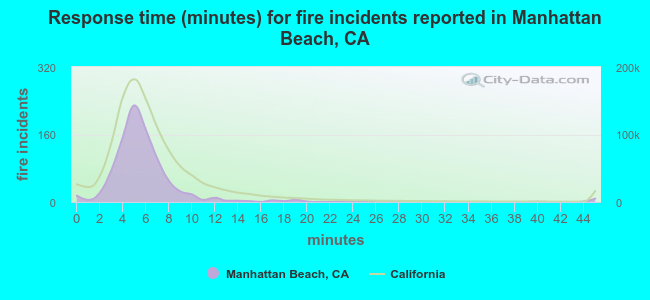 The median response time based on all reported fire incidents is 5 minutes. This is lower compared to the California median value.
The median response time in Manhattan Beach, CA compared to nearest cities:
(Note: Based on data for all years, including only cities with at least 500 fire incidents)
| Manhattan Beach: | 5 minutes |
| Hermosa Beach: | 5 minutes |
| El Segundo: | 5 minutes |
| Redondo Beach: | 5 minutes |
| Hawthorne: | 4 minutes |
| Torrance: | 5 minutes |
| Gardena: | 5 minutes |
| Inglewood: | 4 minutes |
| Culver City: | 6 minutes |
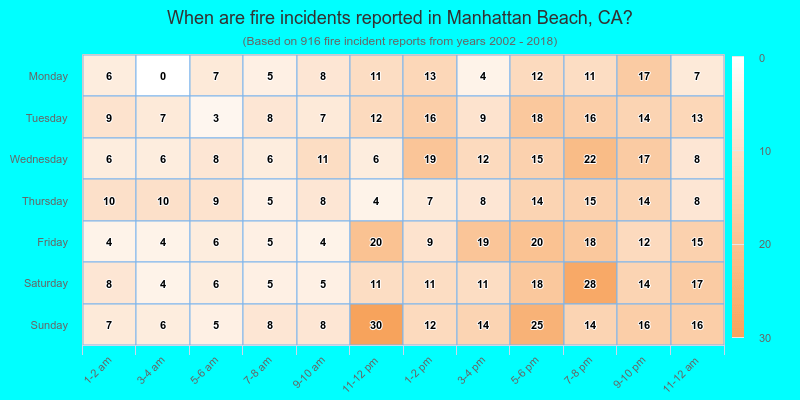
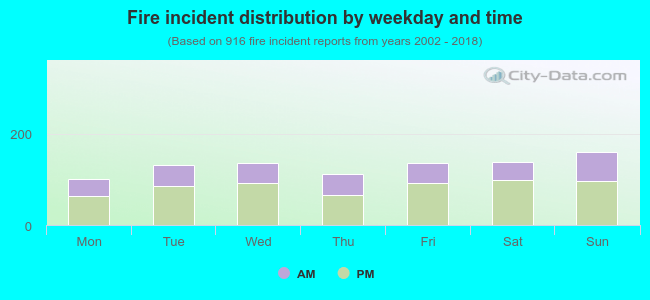 34.7% incidents where reported in the morning and 65.3% in the evening. The most fires (17.6%) took place on Sunday, and the least (11.0%) on Monday.
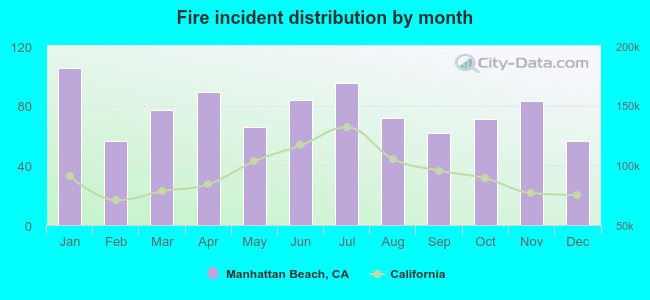 According to the 916 fire incidents from years 2002 - 2018 most fires (11.5%) took place during January, and the least (6.1%) in February.
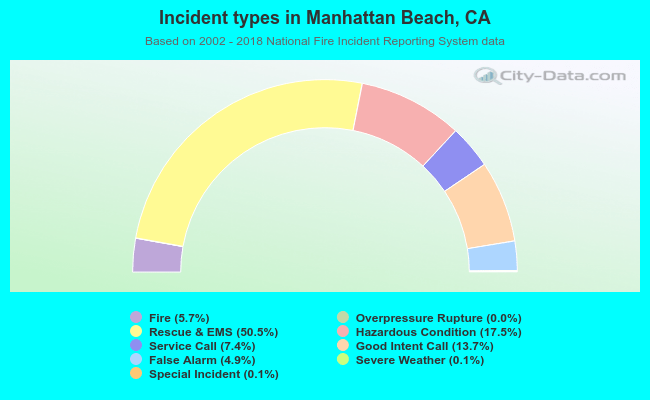 Out of all 16,207 cases reported during the years 2002 - 2018, the most belonged to the categories: Rescue & EMS (50.5%), Hazardous Condition (17.5%), and Good Intent Call (13.7%).
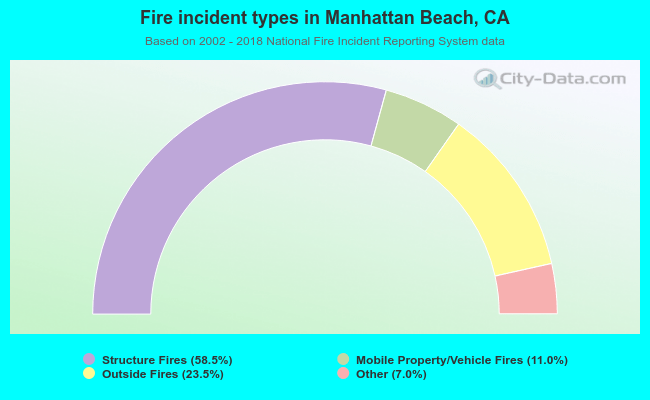 When looking into fire subcategories, the most incidents belonged to: Structure Fires (58.5%), and Outside Fires (23.5%).