West Hollywood: Fire Incidents, California (CA)
Where are fire incidents reported in West Hollywood, CA
Something went wrong! Please refresh the page.
| Fire incidents reported | |
|---|---|
| Sreet name | Count |
| SANTA MONICA | 310 |
| SUNSET | 116 |
| KINGS | 54 |
| FAIRFAX | 52 |
| WEST KNOLL | 52 |
| SAN VICENTE | 48 |
| FOUNTAIN | 46 |
| MELROSE | 44 |
| LA CIENEGA | 40 |
| LARRABEE | 40 |
| HAYWORTH | 38 |
| SWEETZER | 38 |
| HAVENHURST | 36 |
| CRESCENT HEIGHTS | 34 |
| PALM | 34 |
| HARPER | 32 |
| LA BREA | 32 |
| NORTON | 32 |
| HOLLOWAY | 30 |
| CURSON | 26 |
| FLORES | 26 |
| GENESEE | 24 |
| ORANGE GROVE | 24 |
| FULLER | 22 |
| WESTBOURNE | 22 |
| LAUREL | 20 |
| SPAULDING | 20 |
| DOHENY | 18 |
| ROBERTSON | 18 |
| BEVERLY | 16 |
2005 - 2018 National Fire Incident Reporting System (NFIRS) incidents
- Incident types reported to NFIRS in West Hollywood, CA
- 16,52559.9%Rescue & EMS
- 6,76924.5%Good Intent Call
- 1,6395.9%False Alarm
- 1,0803.9%Service Call
- 8913.2%Fire
- 6292.3%Hazardous Condition
- 440.2%Special Incident
- 280.1%Overpressure Rupture
- Fire incident types reported to NFIRS in West Hollywood, CA
- 42647.8%Structure Fires
- 32636.6%Outside Fires
- 9410.5%Mobile Property/Vehicle Fires
- 455.1%Other
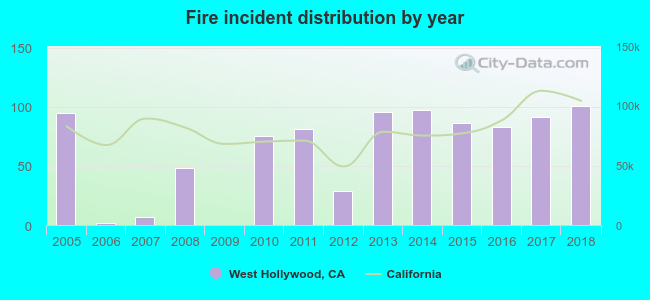 Based on the data from the years 2005 - 2018 the average number of fires per year is 64. The highest number of fires - 101 took place in 2018, and the least - 0 in 2009. The data has a growing trend.
The average number of yearly fire incidents per 10k residents in West Hollywood, CA compared to nearest cities:
(Note: Based on data for the last 3 years, including only cities with population 5,000 and above)
| West Hollywood: | 25.5 |
| Los Angeles: | 16.6 |
| Beverly Hills: | 24.5 |
| Culver City: | 17.9 |
| Burbank: | 18.2 |
| Ladera Heights: | 17.4 |
| Santa Monica: | 23.0 |
| Marina del Rey: | 28.9 |
| Glendale: | 9.1 |
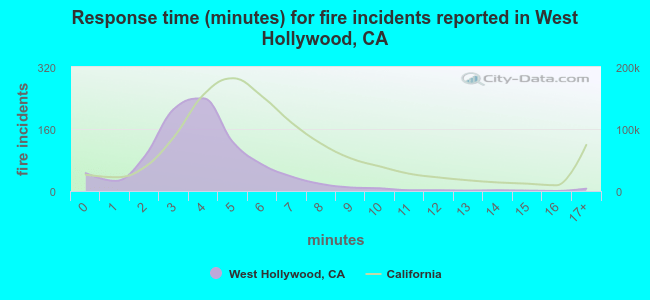 The median response time based on all reported fire incidents is 4 minutes. This is lower than the California median value.
The median response time in West Hollywood, CA compared to nearest cities:
(Note: Based on data for all years, including only cities with at least 500 fire incidents)
| West Hollywood: | 4 minutes |
| Los Angeles: | 5 minutes |
| Beverly Hills: | 5 minutes |
| Culver City: | 6 minutes |
| Burbank: | 4 minutes |
| Santa Monica: | 5 minutes |
| Glendale: | 5 minutes |
| Inglewood: | 4 minutes |
| Vernon: | 5 minutes |
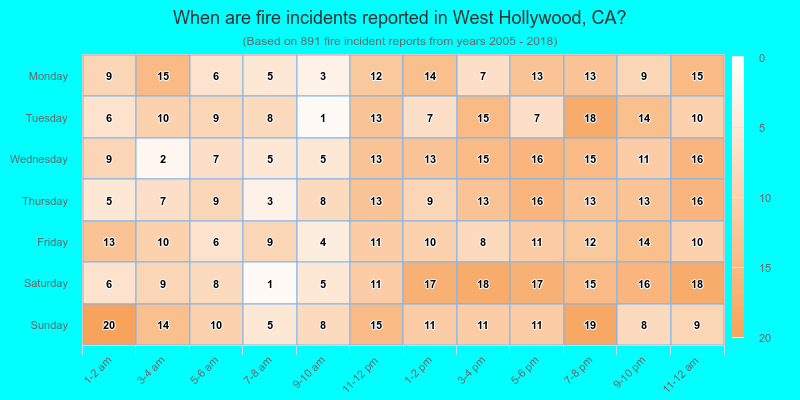
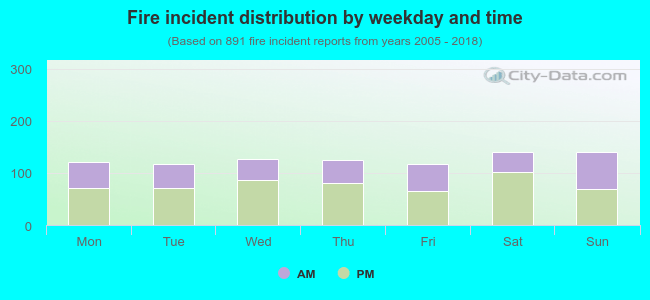 39.1% incidents where reported in the morning and 60.9% in the evening. The most fires (15.8%) took place on Saturday, and the least (13.2%) on Tuesday.
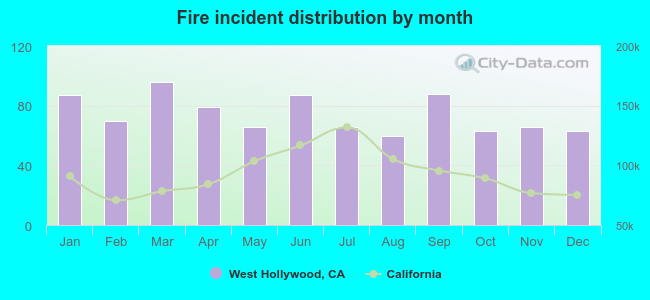 Based on the 891 incident reports from years 2005 - 2018 most fires (10.8%) took place during March, and the least (6.7%) in August.
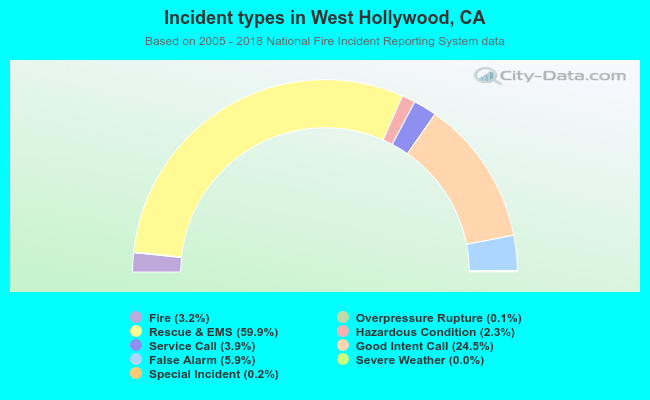 Out of all 27,606 cases reported during the years 2005 - 2018, the most belonged to the categories: Rescue & EMS (59.9%), Good Intent Call (24.5%), and False Alarm (5.9%).
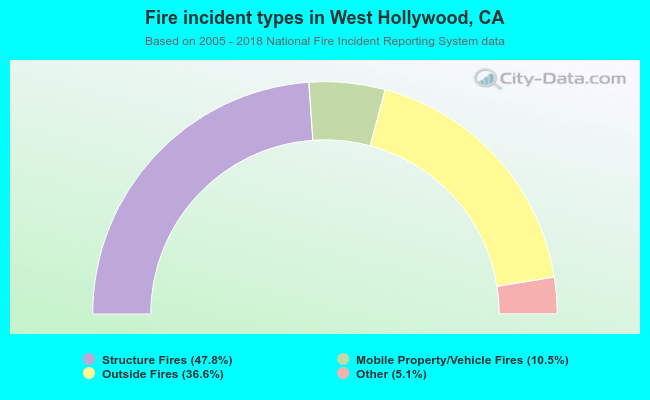 When looking into fire subcategories, the most incidents belonged to: Structure Fires (47.8%), and Outside Fires (36.6%).