Ladera Heights: Fire Incidents, California (CA)
Where are fire incidents reported in Ladera Heights, CA
Something went wrong! Please refresh the page.
|
| |||||||||||||||||||||||||||||||||||||||||||||||||||||||||||||||||||||||||||||||||
2005 - 2018 National Fire Incident Reporting System (NFIRS) incidents
- Incident types reported to NFIRS in Ladera Heights, CA
- 2,36962.7%Rescue & EMS
- 76620.3%Good Intent Call
- 3388.9%False Alarm
- 1433.8%Fire
- 882.3%Service Call
- 721.9%Hazardous Condition
- Fire incident types reported to NFIRS in Ladera Heights, CA
- 5840.6%Structure Fires
- 4330.1%Mobile Property/Vehicle Fires
- 3222.4%Outside Fires
- 107.0%Other
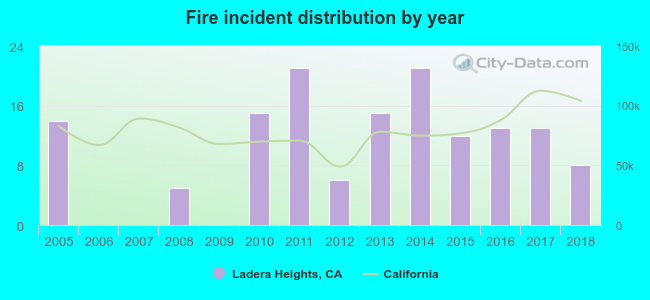 Based on the data from the years 2005 - 2018 the average number of fire incidents per year is 10. The highest number of fire incidents - 21 took place in 2011, and the least - 0 in 2006. The data has a declining trend.
The average number of yearly fire incidents per 10k residents in Ladera Heights, CA compared to nearest cities:
(Note: Based on data for the last 3 years, including only cities with population 5,000 and above)
| Ladera Heights: | 17.4 |
| Culver City: | 17.9 |
| Inglewood: | 23.8 |
| Lennox: | 13.5 |
| Marina del Rey: | 28.9 |
| El Segundo: | 31.3 |
| Hawthorne: | 18.5 |
| Beverly Hills: | 24.5 |
| Santa Monica: | 23.0 |
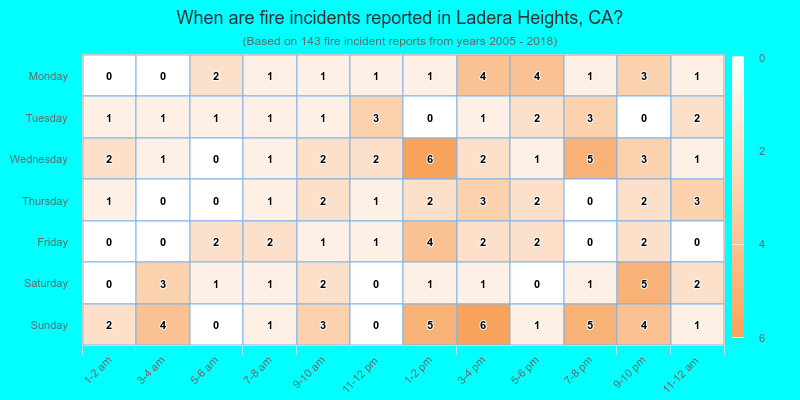
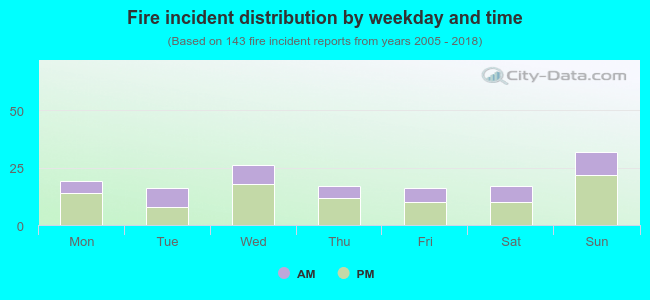 34.3% incidents where reported in the morning and 65.7% in the evening. The most fires (22.4%) took place on Sunday, and the least (11.2%) on Tuesday.
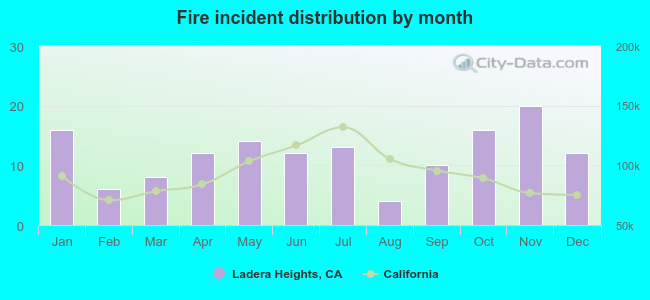 According to the 143 incident reports from years 2005 - 2018 most fires (14.0%) took place during November, and the least (2.8%) in August.
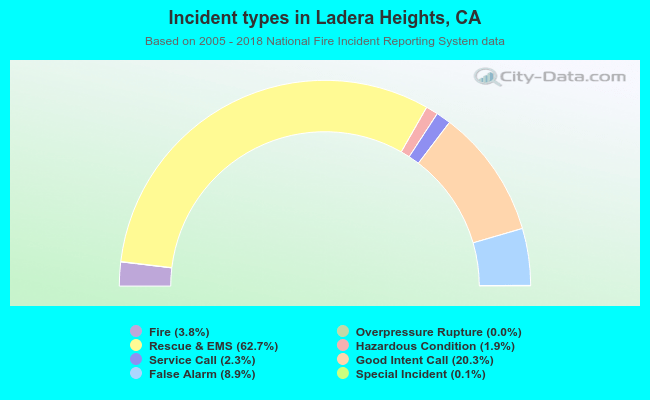 Out of all 3,780 cases reported during the years 2005 - 2018, the most belonged to the categories: Rescue & EMS (62.7%), Good Intent Call (20.3%), and False Alarm (8.9%).
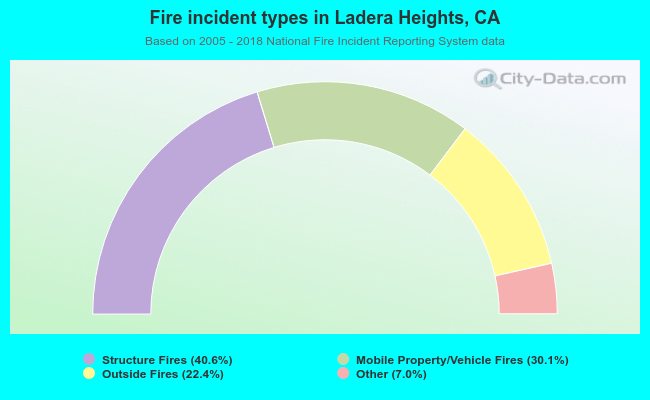 When looking into fire subcategories, the most incidents belonged to: Structure Fires (40.6%), and Mobile Property/Vehicle Fires (30.1%).