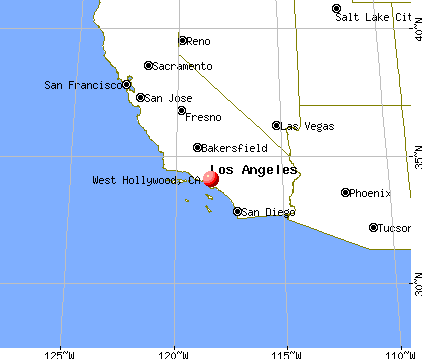
West Hollywood, California

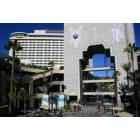
West Hollywood: The Pacific Design Center at night
West Hollywood: Hollywood Bowl
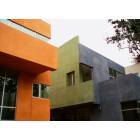
West Hollywood: New homes in West Hollywood, CA
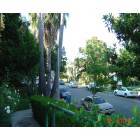
West Hollywood: 1245 North Laurel Avenue - Laurel Ave. is just below the famous Laurel Canyon
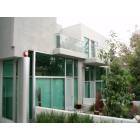
West Hollywood: New homes in West Hollywood, CA
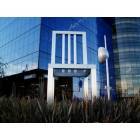
West Hollywood: Pacific Design Center in West Hollywood, CA
- add
your
Submit your own pictures of this city and show them to the world
- OSM Map
- General Map
- Google Map
- MSN Map
Population change since 2000: -3.4%
 |
| Males: 19,788 | |
| Females: 14,726 |
| Median resident age: | 41.2 years |
| California median age: | 37.9 years |
Zip codes: 90069.
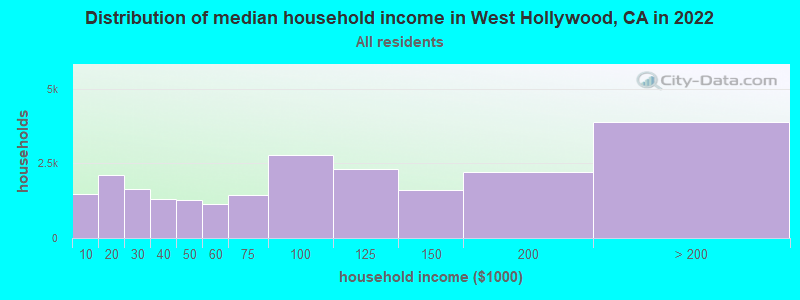
| West Hollywood: | $88,079 |
| CA: | $91,551 |
Estimated per capita income in 2022: $82,165 (it was $38,302 in 2000)
West Hollywood city income, earnings, and wages data
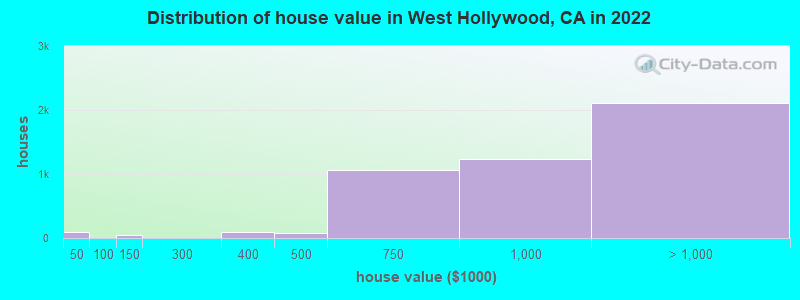
Estimated median house or condo value in 2022: $989,011 (it was $263,400 in 2000)
| West Hollywood: | $989,011 |
| CA: | $715,900 |
Mean prices in 2022: all housing units: over $1,000,000; detached houses: over $1,000,000; townhouses or other attached units: over $1,000,000; in 2-unit structures: over $1,000,000; in 3-to-4-unit structures: over $1,000,000; in 5-or-more-unit structures: over $1,000,000
Median gross rent in 2022: $1,969.
West Hollywood, CA residents, houses, and apartments details
(13.0% for White Non-Hispanic residents, 7.1% for Black residents, 12.1% for Hispanic or Latino residents, 11.8% for other race residents, 15.2% for two or more races residents)
Detailed information about poverty and poor residents in West Hollywood, CA


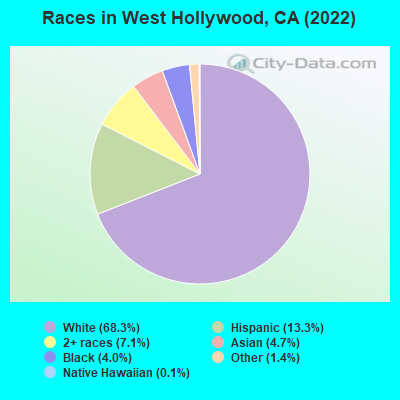
- 23,62768.3%White alone
- 4,61013.3%Hispanic
- 2,4597.1%Two or more races
- 1,6244.7%Asian alone
- 1,3824.0%Black alone
- 4981.4%Other race alone
- 410.1%Native Hawaiian and Other
Pacific Islander alone - 240.07%American Indian alone
According to our research of California and other state lists, there were 12 registered sex offenders living in West Hollywood, California as of April 20, 2024.
The ratio of all residents to sex offenders in West Hollywood is 2,996 to 1.
The ratio of registered sex offenders to all residents in this city is much lower than the state average.
Type |
2009 |
2010 |
2011 |
2012 |
2013 |
2014 |
2015 |
2016 |
2017 |
2018 |
2019 |
2020 |
2022 |
|---|---|---|---|---|---|---|---|---|---|---|---|---|---|
| Murders (per 100,000) | 0 (0.0) | 6 (17.4) | 0 (0.0) | 0 (0.0) | 0 (0.0) | 1 (2.8) | 2 (5.5) | 2 (5.5) | 1 (2.7) | 3 (8.0) | 0 (0.0) | 0 (0.0) | 0 (0.0) |
| Rapes (per 100,000) | 10 (27.8) | 12 (34.9) | 19 (54.6) | 12 (34.3) | 14 (40.1) | 7 (19.7) | 19 (52.4) | 26 (71.0) | 29 (78.2) | 40 (106.7) | 24 (64.6) | 29 (79.0) | 20 (58.5) |
| Robberies (per 100,000) | 115 (319.3) | 154 (447.7) | 125 (359.2) | 134 (383.2) | 68 (194.8) | 95 (267.6) | 90 (248.2) | 119 (325.2) | 122 (328.9) | 127 (338.9) | 139 (373.9) | 82 (223.3) | 124 (362.7) |
| Assaults (per 100,000) | 201 (558.0) | 217 (630.8) | 193 (554.5) | 192 (549.0) | 134 (383.9) | 164 (461.9) | 169 (466.1) | 128 (349.8) | 102 (275.0) | 131 (349.5) | 131 (352.4) | 94 (256.0) | 180 (526.5) |
| Burglaries (per 100,000) | 286 (794.0) | 288 (837.2) | 277 (795.9) | 331 (946.5) | 292 (836.6) | 210 (591.4) | 209 (576.5) | 241 (658.6) | 234 (630.8) | 240 (640.4) | 215 (578.4) | 281 (765.3) | 322 (941.9) |
| Thefts (per 100,000) | 1,142 (3,170) | 1,124 (3,268) | 1,041 (2,991) | 1,194 (3,414) | 1,044 (2,991) | 1,029 (2,898) | 1,102 (3,039) | 1,217 (3,326) | 1,367 (3,685) | 1,762 (4,701) | 1,566 (4,213) | 822 (2,239) | 1,757 (5,140) |
| Auto thefts (per 100,000) | 131 (363.7) | 133 (386.6) | 119 (341.9) | 117 (334.6) | 99 (283.7) | 86 (242.2) | 89 (245.5) | 143 (390.8) | 104 (280.4) | 98 (261.5) | 117 (314.7) | 102 (277.8) | 178 (520.7) |
| Arson (per 100,000) | 7 (19.4) | 8 (23.3) | 18 (51.7) | 9 (25.7) | 2 (5.7) | 14 (39.4) | 11 (30.3) | 9 (24.6) | 2 (5.4) | 20 (53.4) | 9 (24.2) | 9 (24.5) | 18 (52.7) |
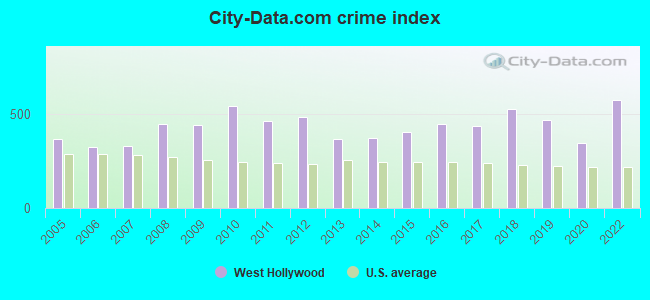
| City-Data.com crime index | 441.1 | 543.5 | 465.0 | 481.8 | 368.2 | 370.7 | 402.2 | 445.7 | 435.6 | 526.8 | 468.5 | 346.7 | 574.1 |
The City-Data.com crime index weighs serious crimes and violent crimes more heavily. Higher means more crime, U.S. average is 246.1. It adjusts for the number of visitors and daily workers commuting into cities.
Crime rate in West Hollywood detailed stats: murders, rapes, robberies, assaults, burglaries, thefts, arson
Full-time law enforcement employees in 2015, including police officers: 1 (1 officers - 1 male; 0 female).
| Officers per 1,000 residents here: | 0.03 |
| California average: | 1.98 |
 Recent articles from our blog. Our writers, many of them Ph.D. graduates or candidates, create easy-to-read articles on a wide variety of topics.


Latest news from West Hollywood, CA collected exclusively by city-data.com from local newspapers, TV, and radio stations
Ancestries: English (6.3%), Russian (5.6%), Italian (5.4%), American (5.4%), Irish (5.1%), Iranian (3.6%).
Current Local Time: PST time zone
Elevation: 287 feet
Land area: 1.88 square miles.
Population density: 18,353 people per square mile (very high).
8,163 residents are foreign born (10.3% Europe, 6.8% Asia, 3.9% Latin America).
| This city: | 23.6% |
| California: | 26.5% |
Median real estate property taxes paid for housing units with mortgages in 2022: $7,408 (0.7%)
Median real estate property taxes paid for housing units with no mortgage in 2022: $6,201 (0.7%)
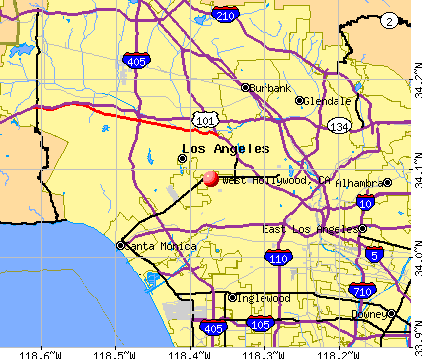
Nearest city with pop. 50,000+: Los Angeles, CA  (0.3 miles , pop. 3,694,820).
Nearest cities:
), Latitude: 34.09 N, Longitude: 118.37 W
Daytime population change due to commuting: +11,690 (+33.8%)
Workers who live and work in this city: 8,412 (35.4%)
Area code commonly used in this area: 310
West Hollywood tourist attractions:
- Beverly Center - West Hollywood, California - Popular Mall for L.A. Shoppers
- Sunset Marquis Hotel and Villas
- Blue Jay Way
- Chamberlain West Hollywood
- Mondrian Los Angeles
- Sunset Tower Hotel
- Comedy Store
- Liberace Home
- Mansion owned by Johnny Depp
- Madonna's Former Home
- House at 1654 Doheny Drive
- House at 9137 Cordell Drive
- House of Blues Sunset Strip
- The London West Hollywood
- Apartment at 1326 Londonderry View
- Andaz West Hollywood
- Piazza del Sol
- Le Parc Suites Hotel
- Pacific Design Center
- Le Montrose Suite
- Petit Ermitage
- Robertson Boulevard
- Rocky and Bullwinkle Statue
- Shoreham Towers
- Sierra Towers
- Best Western Sunset Plaza Hotel
- The Grafton on Sunset
- Chateau Marmont
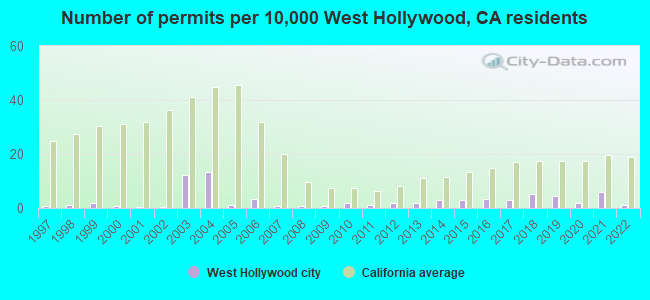
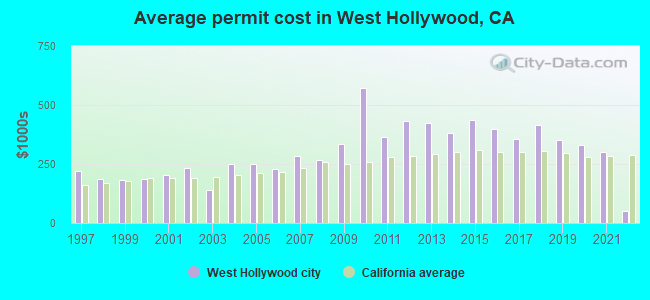
Single-family new house construction building permits:
- 2022: 4 buildings, average cost: $49,700
- 2021: 21 buildings, average cost: $301,100
- 2020: 7 buildings, average cost: $329,400
- 2019: 16 buildings, average cost: $353,300
- 2018: 18 buildings, average cost: $415,000
- 2017: 10 buildings, average cost: $357,500
- 2016: 12 buildings, average cost: $397,000
- 2015: 11 buildings, average cost: $437,300
- 2014: 11 buildings, average cost: $382,900
- 2013: 7 buildings, average cost: $424,200
- 2012: 6 buildings, average cost: $433,800
- 2011: 4 buildings, average cost: $366,400
- 2010: 6 buildings, average cost: $573,900
- 2009: 2 buildings, average cost: $332,500
- 2008: 2 buildings, average cost: $268,600
- 2007: 2 buildings, average cost: $285,300
- 2006: 12 buildings, average cost: $226,700
- 2005: 4 buildings, average cost: $251,200
- 2004: 48 buildings, average cost: $251,200
- 2003: 44 buildings, average cost: $140,000
- 2002: 1 building, cost: $233,400
- 2001: 1 building, cost: $202,600
- 2000: 2 buildings, average cost: $185,000
- 1999: 7 buildings, average cost: $183,200
- 1998: 4 buildings, average cost: $184,600
- 1997: 2 buildings, average cost: $219,000
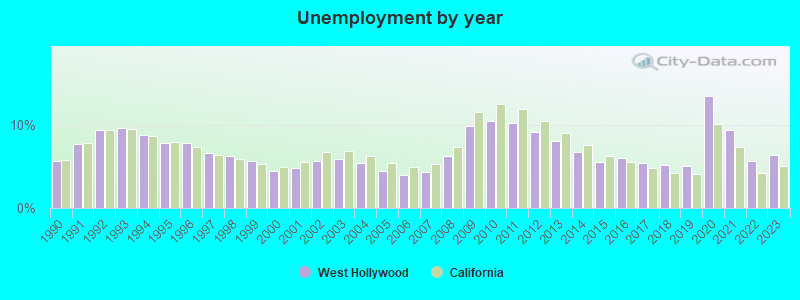
| Here: | 6.4% |
| California: | 5.1% |
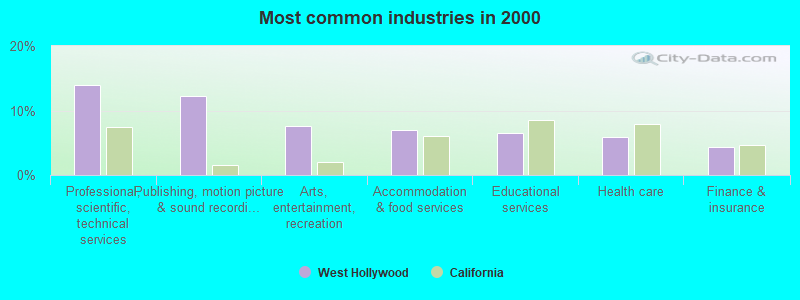
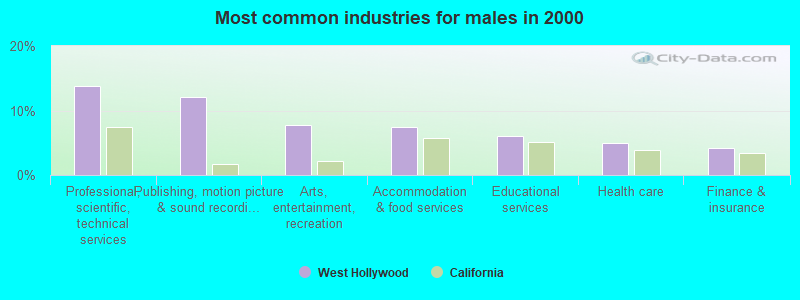
- Professional, scientific, technical services (13.9%)
- Publishing, motion picture & sound recording industries (12.2%)
- Arts, entertainment, recreation (7.6%)
- Accommodation & food services (7.0%)
- Educational services (6.4%)
- Health care (6.0%)
- Finance & insurance (4.3%)
- Professional, scientific, technical services (13.9%)
- Publishing, motion picture & sound recording industries (12.0%)
- Arts, entertainment, recreation (7.8%)
- Accommodation & food services (7.4%)
- Educational services (6.0%)
- Health care (4.9%)
- Finance & insurance (4.2%)
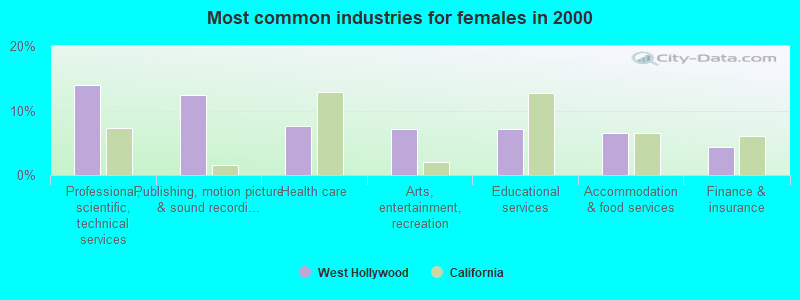
- Professional, scientific, technical services (13.9%)
- Publishing, motion picture & sound recording industries (12.5%)
- Health care (7.6%)
- Arts, entertainment, recreation (7.2%)
- Educational services (7.1%)
- Accommodation & food services (6.5%)
- Finance & insurance (4.4%)
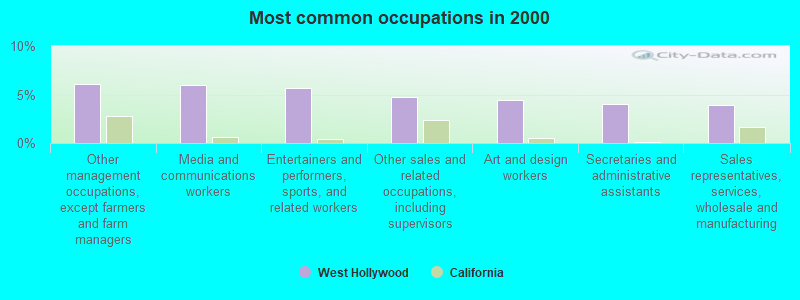
- Other management occupations, except farmers and farm managers (6.1%)
- Media and communications workers (5.9%)
- Entertainers and performers, sports, and related workers (5.7%)
- Other sales and related occupations, including supervisors (4.7%)
- Art and design workers (4.4%)
- Secretaries and administrative assistants (4.0%)
- Sales representatives, services, wholesale and manufacturing (3.9%)
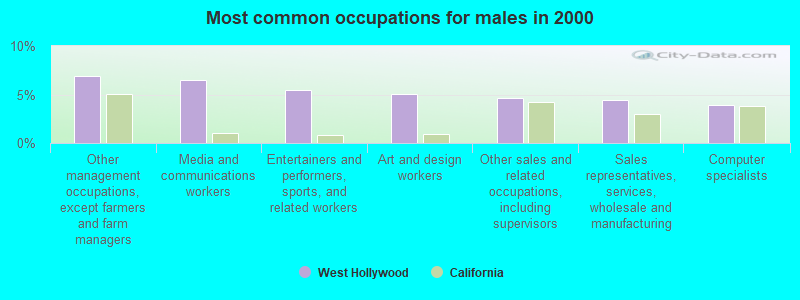
- Other management occupations, except farmers and farm managers (6.9%)
- Media and communications workers (6.5%)
- Entertainers and performers, sports, and related workers (5.5%)
- Art and design workers (5.1%)
- Other sales and related occupations, including supervisors (4.6%)
- Sales representatives, services, wholesale and manufacturing (4.4%)
- Computer specialists (3.9%)
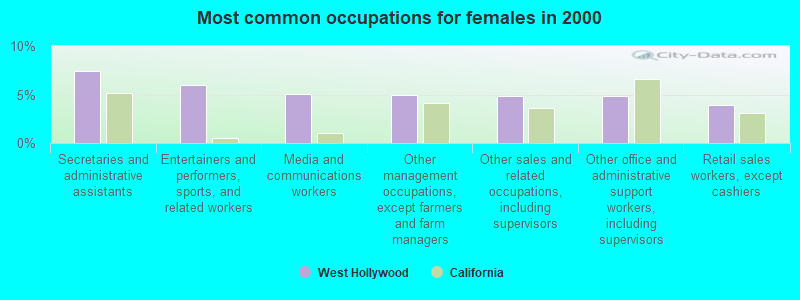
- Secretaries and administrative assistants (7.4%)
- Entertainers and performers, sports, and related workers (5.9%)
- Media and communications workers (5.1%)
- Other management occupations, except farmers and farm managers (4.9%)
- Other sales and related occupations, including supervisors (4.9%)
- Other office and administrative support workers, including supervisors (4.8%)
- Retail sales workers, except cashiers (3.9%)
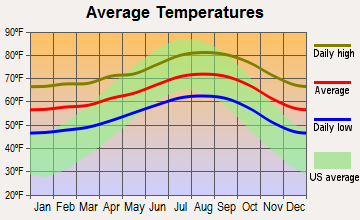
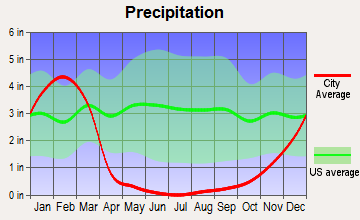
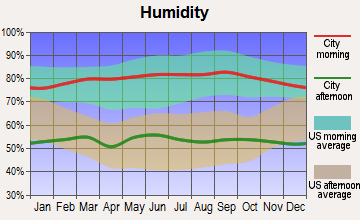
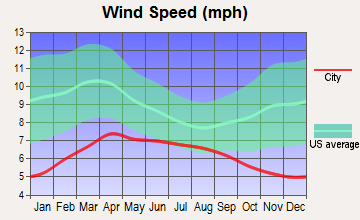
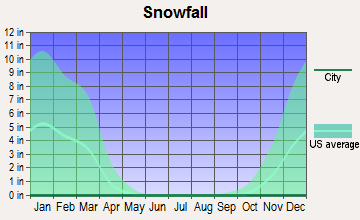
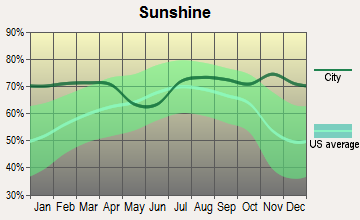
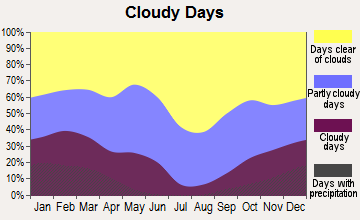
Average climate in West Hollywood, California
Based on data reported by over 4,000 weather stations
|
|

(lower is better)
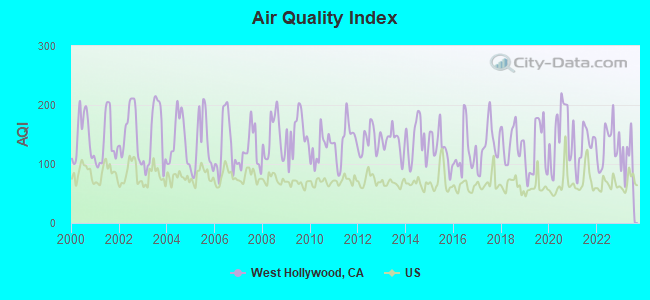
Air Quality Index (AQI) level in 2023 was 108. This is significantly worse than average.
| City: | 108 |
| U.S.: | 73 |

Carbon Monoxide (CO) [ppm] level in 2022 was 0.373. This is significantly worse than average. Closest monitor was 2.6 miles away from the city center.
| City: | 0.373 |
| U.S.: | 0.251 |
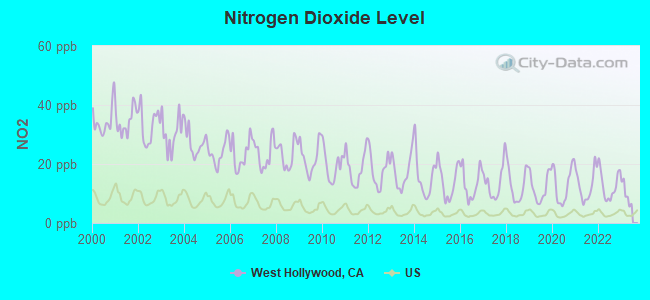
Nitrogen Dioxide (NO2) [ppb] level in 2022 was 12.8. This is significantly worse than average. Closest monitor was 2.6 miles away from the city center.
| City: | 12.8 |
| U.S.: | 5.1 |
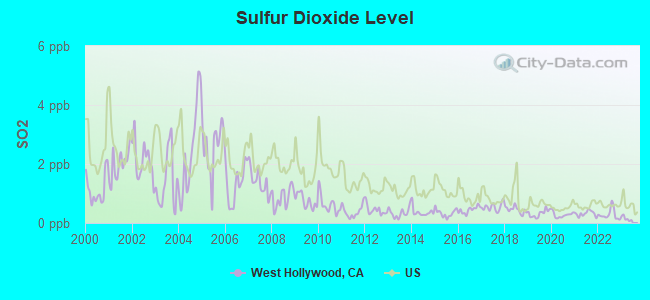
Sulfur Dioxide (SO2) [ppb] level in 2022 was 0.288. This is significantly better than average. Closest monitor was 2.6 miles away from the city center.
| City: | 0.288 |
| U.S.: | 1.515 |
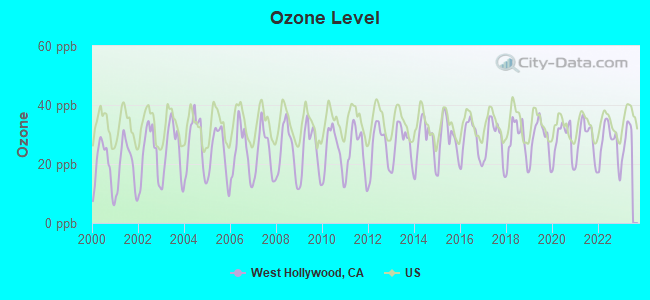
Ozone [ppb] level in 2022 was 27.1. This is better than average. Closest monitor was 2.4 miles away from the city center.
| City: | 27.1 |
| U.S.: | 33.3 |
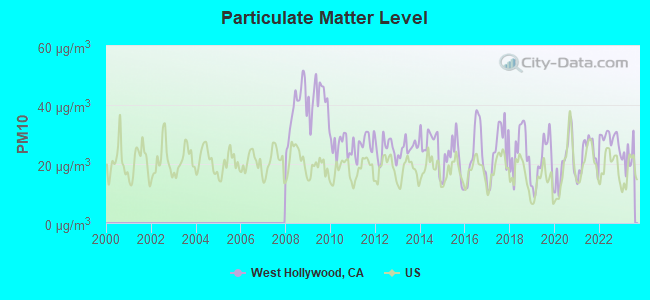
Particulate Matter (PM10) [µg/m3] level in 2023 was 22.8. This is about average. Closest monitor was 6.9 miles away from the city center.
| City: | 22.8 |
| U.S.: | 19.2 |
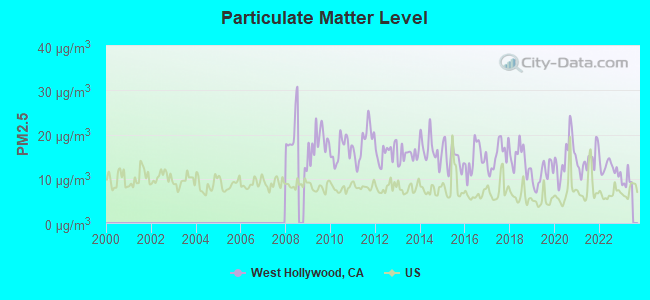
Particulate Matter (PM2.5) [µg/m3] level in 2022 was 12.4. This is significantly worse than average. Closest monitor was 6.9 miles away from the city center.
| City: | 12.4 |
| U.S.: | 8.1 |
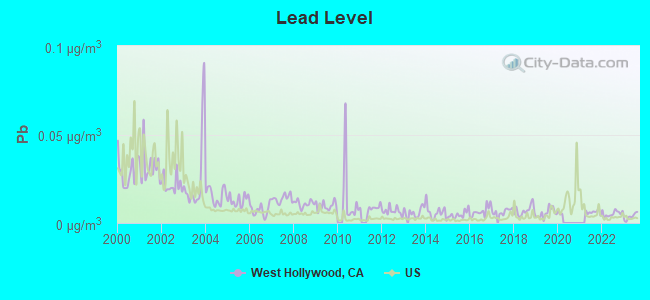
Lead (Pb) [µg/m3] level in 2023 was 0.00359. This is significantly better than average. Closest monitor was 5.5 miles away from the city center.
| City: | 0.00359 |
| U.S.: | 0.00931 |
Earthquake activity:
West Hollywood-area historical earthquake activity is significantly above California state average. It is 6986% greater than the overall U.S. average.On 7/21/1952 at 11:52:14, a magnitude 7.7 (7.7 UK, Class: Major, Intensity: VIII - XII) earthquake occurred 72.5 miles away from West Hollywood center, causing $50,000,000 total damage
On 6/28/1992 at 11:57:34, a magnitude 7.6 (6.2 MB, 7.6 MS, 7.3 MW, Depth: 0.7 mi) earthquake occurred 105.6 miles away from the city center, causing 3 deaths (1 shaking deaths, 2 other deaths) and 400 injuries, causing $100,000,000 total damage and $40,000,000 insured losses
On 10/16/1999 at 09:46:44, a magnitude 7.4 (6.3 MB, 7.4 MS, 7.2 MW, 7.3 ML) earthquake occurred 114.6 miles away from the city center
On 11/4/1927 at 13:51:53, a magnitude 7.5 (7.5 UK) earthquake occurred 162.0 miles away from the city center
On 1/17/1994 at 12:30:55, a magnitude 6.8 (6.4 MB, 6.8 MS, 6.7 MW, Depth: 11.4 mi, Class: Strong, Intensity: VII - IX) earthquake occurred 12.5 miles away from West Hollywood center, causing 60 deaths (60 shaking deaths) and 7000 injuries
On 4/21/1918 at 22:32:30, a magnitude 6.8 (6.8 UK) earthquake occurred 56.8 miles away from the city center
Magnitude types: body-wave magnitude (MB), local magnitude (ML), surface-wave magnitude (MS), moment magnitude (MW)
Natural disasters:
The number of natural disasters in Los Angeles County (57) is a lot greater than the US average (15).Major Disasters (Presidential) Declared: 27
Emergencies Declared: 3
Causes of natural disasters: Fires: 37, Floods: 16, Storms: 9, Winter Storms: 6, Landslides: 5, Mudslides: 5, Earthquakes: 3, Freeze: 1, Heavy Rain: 1, Hurricane: 1, Snow: 1, Tornado: 1, Wind: 1, Other: 1 (Note: some incidents may be assigned to more than one category).

Hospitals and medical centers near West Hollywood:
- COUNTRY VILLA WILSHIRE (Nursing Home, about 1 miles away; LOS ANGELES, CA)
- KENNEDY CARE CENTER (Nursing Home, about 1 miles away; LOS ANGELES, CA)
- VICTORIA HOME HEALTH NURSING AGENCY INC (Home Health Center, about 1 miles away; LOS ANGELES, CA)
- DAVITA-CRESCENT HEIGHTS DIALYSIS CENTER (Dialysis Facility, about 1 miles away; LOS ANGELES, CA)
- LIRA HOME HEALTH, INC (Home Health Center, about 1 miles away; LOS ANGELES, CA)
- NOVA SKILLED HOME HEALTH, INC (Home Health Center, about 1 miles away; LOS ANGELES, CA)
- CEDARS-SINAI MEDICAL CENTER Acute Care Hospitals (about 1 miles away; LOS ANGELES, CA)
Heliports located in West Hollywood:
Amtrak stations near West Hollywood:
- 7 miles: GLENDALE (400 W. CERRITOS AVE.) . Services: fully wheelchair accessible, public payphones, free short-term parking, free long-term parking, call for taxi service, intercity bus service, public transit connection.
- 8 miles: BURBANK AIRPORT (BURBANK, EMPIRE & AIRPORT AVES.) . Services: fully wheelchair accessible, public payphones, snack bar, free short-term parking, paid long-term parking, car rental agency, taxi stand, public transit connection.
- 9 miles: LOS ANGELES (800 N. ALAMEDA ST.) . Services: ticket office, fully wheelchair accessible, enclosed waiting area, public restrooms, public payphones, snack bar, free short-term parking, paid long-term parking, car rental agency, taxi stand, public transit connection.
Colleges/universities with over 2000 students nearest to West Hollywood:
- Los Angeles Film School (about 3 miles; Hollywood, CA; Full-time enrollment: 3,189)
- New York Film Academy (about 4 miles; Universal City, CA; FT enrollment: 4,714)
- University of California-Los Angeles (about 5 miles; Los Angeles, CA; FT enrollment: 39,409)
- Los Angeles City College (about 5 miles; Los Angeles, CA; FT enrollment: 10,027)
- Westwood College-Los Angeles (about 5 miles; Los Angeles, CA; FT enrollment: 2,448)
- West Los Angeles College (about 6 miles; Culver City, CA; FT enrollment: 5,221)
- Mount St Mary's College (about 7 miles; Los Angeles, CA; FT enrollment: 2,431)
Public high schools in West Hollywood:
- HELEN BERNSTEIN HIGH (Students: 958, Location: 1309 N. WILTON PL., Grades: 9-12)
- STEM ACADEMY AT BERNSTEIN HIGH (Location: 1309 N. WILTON PL., Grades: 9-12)
Public elementary/middle school in West Hollywood:
- JOSEPH LE CONTE MIDDLE (Students: 1,600, Location: 1316 N. BRONSON AVE., Grades: 6-8)
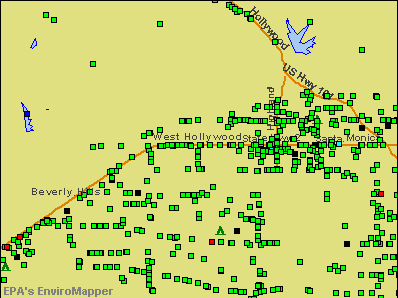
Points of interest:
Notable locations in West Hollywood: Goldwyn Studios (A), Hollywood Film Archive Library (B), West Hollywood Branch County of Los Angeles Public Library (C), Pacific Design Center (D), West Hollywood Sheriffs Station (E), West Hollywood County Building (F), Globe Playhouse (G), Sunset Tower (H), Los Angeles County Fire Department Station 8 (I), Los Angeles County Fire Department Station 7 (J), Cedars-Sinai Outpatient Services Building (K). Display/hide their locations on the map
Shopping Centers: West Hollywood Gateway Shopping Center (1), Movietown Plaza Shopping Center (2), Sunset Plaza Shopping Center (3). Display/hide their locations on the map
Churches in West Hollywood include: Saint Ambrose Catholic Church (A), Crescent Heights Methodist Church (B), Seventeenth Church of Christ Scientist (C), Temple Bethel (D), First Baptist Church of Beverly Hills (E), Saint Victors Roman Catholic Church (F), West Hollywood Community Church (G), West Hollywood Foursquare Church (H). Display/hide their locations on the map
Parks in West Hollywood include: Plummer Park (1), West Hollywood Park (2). Display/hide their locations on the map
Tourist attractions: Architecture & Design Museum (8560 West Sunset Boulevard), Glass Garage Fine Art Gallery (Museums; 418 North Robertson Boulevard), American Travel Marketing (9200 West Sunset Boulevard), Ballet Magique (Arcades & Amusements; 8581 Santa Monica Blvd. # 232).
Hotels: Argyle Hotel (Sc) (8358 W Sunset Blvd), Argyle Hotel (8358 Sunset Boulevard), Best Western Sunset Plaza Hotel (8400 West Sunset Boulevard Suite 3A), Brasserie Restaurant & Bar (Wyndham Bel Age Hotel 1020 North San Vicente Boulevard).
Birthplace of: Greg Daniels - Writer, Lukas Haas - Child actor.
| This city: | 1.5 people |
| California: | 2.9 people |
| This city: | 19.3% |
| Whole state: | 68.7% |
| This city: | 10.7% |
| Whole state: | 7.2% |
Likely homosexual households (counted as self-reported same-sex unmarried-partner households)
- Lesbian couples: 0.8% of all households
- Gay men: 5.0% of all households
People in group quarters in West Hollywood in 2010:
- 72 people in group homes intended for adults
- 27 people in other noninstitutional facilities
- 10 people in residential treatment centers for adults
18 people in homes for the mentally retarded in 2000
Banks with branches in West Hollywood (2011 data):
- Wells Fargo Bank, National Association: Fountain & North La Brea Branch at 1233 North La Brea Avenue, branch established on 1997/05/09; West Hollywood Branch at 8571 Santa Monica Boulevard, branch established on 1996/07/01. Info updated 2011/04/05: Bank assets: $1,161,490.0 mil, Deposits: $905,653.0 mil, headquarters in Sioux Falls, SD, positive income, 6395 total offices, Holding Company: Wells Fargo & Company
- JPMorgan Chase Bank, National Association: Santa Monica Robertson Banking Cente at 8951 Santa Monica Boulevard, Suite F, branch established on 2010/11/19. Info updated 2011/11/10: Bank assets: $1,811,678.0 mil, Deposits: $1,190,738.0 mil, headquarters in Columbus, OH, positive income, International Specialization, 5577 total offices, Holding Company: Jpmorgan Chase & Co.
- City National Bank: Sunset/Dohenybranch at 9229 Sunset Boulevard, branch established on 1959/11/30. Info updated 2011/04/11: Bank assets: $23,303.6 mil, Deposits: $20,475.9 mil, headquarters in Los Angeles, CA, positive income, Commercial Lending Specialization, 86 total offices, Holding Company: City National Corporation
- Comerica Bank: 9200 Sunset Banking Center Branch at 9200 W. Sunset Blvd, branch established on 2010/12/14. Info updated 2011/07/29: Bank assets: $60,970.5 mil, Deposits: $48,300.9 mil, headquarters in Dallas, TX, positive income, Commercial Lending Specialization, 497 total offices, Holding Company: Comerica Incorporated
- U.S. Bank National Association: West Hollywood Branch at 8901 Santa Monica Boulevard, branch established on 1982/05/06. Info updated 2012/01/30: Bank assets: $330,470.8 mil, Deposits: $236,091.5 mil, headquarters in Cincinnati, OH, positive income, 3121 total offices, Holding Company: U.S. Bancorp
- Citibank, National Association: Santa Monica Boulevard Branch at 8900 Santa Monica Boulevard, branch established on 1945/01/01. Info updated 2012/01/10: Bank assets: $1,288,658.0 mil, Deposits: $882,541.0 mil, headquarters in Sioux Falls, SD, positive income, International Specialization, 1048 total offices, Holding Company: Citigroup Inc.
- OneWest Bank, FSB: 8653 Beverly Boulevard Branch at 8653 Beverly Boulevard, branch established on 1954/05/07. Info updated 2011/07/21: Bank assets: $26,181.3 mil, Deposits: $15,408.4 mil, headquarters in Pasadena, CA, positive income, 79 total offices
For population 15 years and over in West Hollywood:
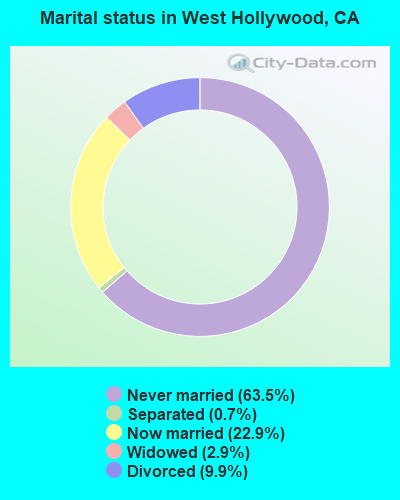
- Never married: 63.5%
- Now married: 22.9%
- Separated: 0.7%
- Widowed: 2.9%
- Divorced: 9.9%
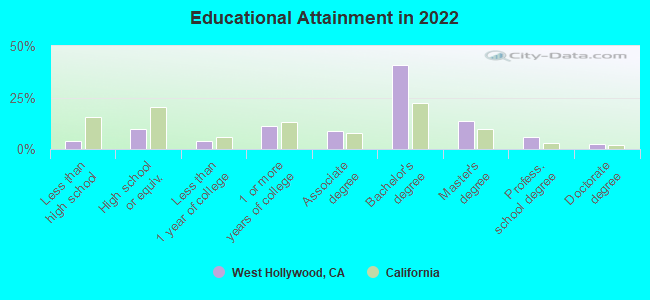
For population 25 years and over in West Hollywood:
- High school or higher: 95.9%
- Bachelor's degree or higher: 61.5%
- Graduate or professional degree: 20.8%
- Unemployed: 6.4%
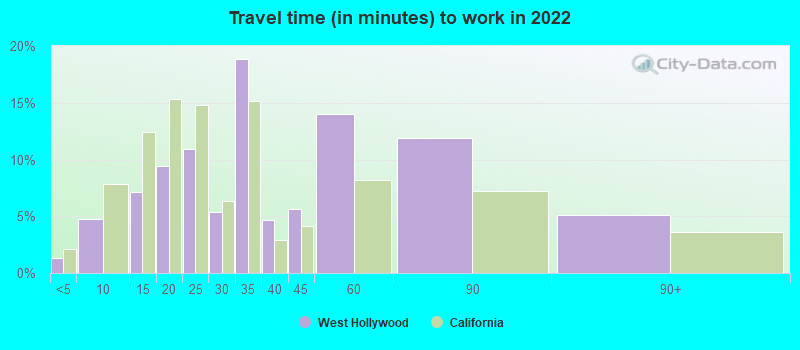
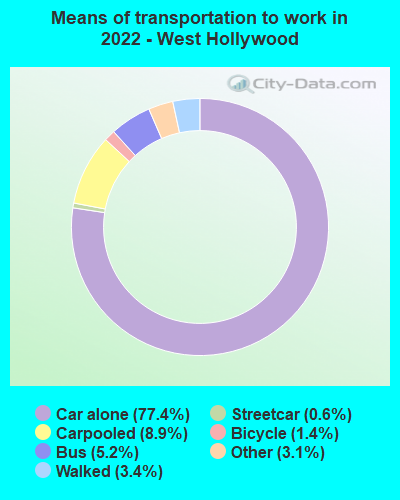
- Mean travel time to work (commute): 19.3 minutes
| Here: | 9.5 |
| California average: | 15.5 |


Graphs represent county-level data. Detailed 2008 Election Results
Political contributions by individuals in West Hollywood, CA
Religion statistics for West Hollywood, CA (based on Los Angeles County data)


| Religion | Adherents | Congregations |
|---|---|---|
| Catholic | 3,542,994 | 275 |
| Evangelical Protestant | 814,611 | 3,249 |
| Other | 451,594 | 1,023 |
| Mainline Protestant | 229,056 | 860 |
| Black Protestant | 112,338 | 290 |
| Orthodox | 63,517 | 76 |
| None | 4,604,495 | - |
Food Environment Statistics:
| This county: | 2.12 / 10,000 pop. |
| California: | 2.14 / 10,000 pop. |
| Los Angeles County: | 0.03 / 10,000 pop. |
| California: | 0.04 / 10,000 pop. |
| Los Angeles County: | 0.58 / 10,000 pop. |
| California: | 0.62 / 10,000 pop. |
| Here: | 1.23 / 10,000 pop. |
| California: | 1.49 / 10,000 pop. |
| This county: | 7.15 / 10,000 pop. |
| State: | 7.42 / 10,000 pop. |
| Los Angeles County: | 7.5% |
| California: | 7.3% |
| Los Angeles County: | 20.4% |
| California: | 21.3% |
| This county: | 18.6% |
| California: | 17.9% |
Health and Nutrition:
| West Hollywood: | 54.7% |
| California: | 49.4% |
| West Hollywood: | 54.8% |
| California: | 48.0% |
| This city: | 27.9 |
| State: | 28.1 |
| Here: | 18.2% |
| State: | 20.2% |
| This city: | 8.2% |
| California: | 11.2% |
| West Hollywood: | 6.9 |
| California: | 6.8 |
| This city: | 32.1% |
| California: | 31.5% |
| West Hollywood: | 62.4% |
| State: | 56.4% |
| This city: | 81.9% |
| California: | 80.9% |
More about Health and Nutrition of West Hollywood, CA Residents
| Local government employment and payroll (March 2022) | |||||
| Function | Full-time employees | Monthly full-time payroll | Average yearly full-time wage | Part-time employees | Monthly part-time payroll |
|---|---|---|---|---|---|
| Other and Unallocable | 80 | $922,981 | $138,447 | 4 | $7,799 |
| Other Government Administration | 37 | $428,302 | $138,909 | 3 | $1,125 |
| Parks and Recreation | 36 | $328,226 | $109,409 | 26 | $44,044 |
| Financial Administration | 24 | $316,139 | $158,070 | 1 | $4,588 |
| Welfare | 13 | $153,924 | $142,084 | 1 | $1,330 |
| Streets and Highways | 11 | $136,198 | $148,580 | 0 | $0 |
| Housing and Community Development (Local) | 11 | $117,148 | $127,798 | 1 | $1,520 |
| Police - Other | 3 | $22,739 | $90,956 | 0 | $0 |
| Judicial and Legal | 3 | $33,172 | $132,688 | 0 | $0 |
| Fire - Other | 2 | $18,978 | $113,868 | 0 | $0 |
| Solid Waste Management | 1 | $11,449 | $137,388 | 0 | $0 |
| Totals for Government | 221 | $2,489,256 | $135,163 | 36 | $60,405 |
West Hollywood government finances - Expenditure in 2021 (per resident):
- Construction - Parks and Recreation: $53,245,000 ($1542.71)
Regular Highways: $3,330,000 ($96.48)
General - Other: $2,835,000 ($82.14)
Police Protection: $1,024,000 ($29.67)
Housing and Community Development: $845,000 ($24.48)
General Public Buildings: $794,000 ($23.01)
Parking Facilities: $564,000 ($16.34)
- Current Operations - Police Protection: $25,524,000 ($739.53)
Central Staff Services: $22,451,000 ($650.49)
Regular Highways: $17,584,000 ($509.47)
Housing and Community Development: $13,620,000 ($394.62)
Health - Other: $9,373,000 ($271.57)
Protective Inspection and Regulation - Other: $8,923,000 ($258.53)
Parks and Recreation: $5,330,000 ($154.43)
Financial Administration: $4,010,000 ($116.18)
Parking Facilities: $3,357,000 ($97.26)
Transit Utilities: $3,265,000 ($94.60)
General - Other: $2,720,000 ($78.81)
Solid Waste Management: $1,664,000 ($48.21)
Libraries: $1,116,000 ($32.33)
Sewerage: $613,000 ($17.76)
- General - Interest on Debt: $19,970,000 ($578.61)
- Other Capital Outlay - General - Other: $64,000 ($1.85)
West Hollywood government finances - Revenue in 2021 (per resident):
- Charges - Other: $12,699,000 ($367.94)
Parking Facilities: $12,612,000 ($365.42)
Housing and Community Development: $4,761,000 ($137.94)
Solid Waste Management: $1,674,000 ($48.50)
Sewerage: $1,402,000 ($40.62)
Parks and Recreation: $51,000 ($1.48)
- Federal Intergovernmental - Other: $651,000 ($18.86)
Housing and Community Development: $616,000 ($17.85)
- Local Intergovernmental - Other: $305,000 ($8.84)
- Miscellaneous - General Revenue - Other: $7,392,000 ($214.17)
Donations From Private Sources: $1,980,000 ($57.37)
Rents: $748,000 ($21.67)
Fines and Forfeits: $457,000 ($13.24)
Interest Earnings: $166,000 ($4.81)
- State Intergovernmental - Other: $1,754,000 ($50.82)
Highways: $1,527,000 ($44.24)
General Local Government Support: $101,000 ($2.93)
- Tax - Property: $31,229,000 ($904.82)
General Sales and Gross Receipts: $18,459,000 ($534.83)
Other Selective Sales: $9,676,000 ($280.35)
Other License: $5,449,000 ($157.88)
Occupation and Business License - Other: $3,937,000 ($114.07)
Other: $3,246,000 ($94.05)
Public Utilities Sales: $1,950,000 ($56.50)
Documentary and Stock Transfer: $599,000 ($17.36)
West Hollywood government finances - Debt in 2021 (per resident):
- Long Term Debt - Beginning Outstanding - Unspecified Public Purpose: $377,641,000 ($10941.68)
Outstanding Unspecified Public Purpose: $374,118,000 ($10839.60)
Retired Unspecified Public Purpose: $3,523,000 ($102.07)
West Hollywood government finances - Cash and Securities in 2021 (per resident):
- Bond Funds - Cash and Securities: $9,612,000 ($278.50)
- Other Funds - Cash and Securities: $163,578,000 ($4739.47)
- Sinking Funds - Cash and Securities: $94,232,000 ($2730.25)
2.98% of this county's 2021 resident taxpayers lived in other counties in 2020 ($81,235 average adjusted gross income)
| Here: | 2.98% |
| California average: | 5.19% |
0.01% of residents moved from foreign countries ($155 average AGI)
Los Angeles County: 0.01% California average: 0.03%
Top counties from which taxpayers relocated into this county between 2020 and 2021:
| from Orange County, CA | |
| from San Bernardino County, CA | |
| from Riverside County, CA |
4.68% of this county's 2020 resident taxpayers moved to other counties in 2021 ($97,324 average adjusted gross income)
| Here: | 4.68% |
| California average: | 6.14% |
0.01% of residents moved to foreign countries ($196 average AGI)
Los Angeles County: 0.01% California average: 0.02%
Top counties to which taxpayers relocated from this county between 2020 and 2021:
| to Orange County, CA | |
| to San Bernardino County, CA | |
| to Riverside County, CA |
| Businesses in West Hollywood, CA | ||||
| Name | Count | Name | Count | |
|---|---|---|---|---|
| 24 Hour Fitness | 1 | Rite Aid | 1 | |
| Baja Fresh Mexican Grill | 1 | Safeway | 1 | |
| CVS | 1 | Sprint Nextel | 1 | |
| Carl\s Jr. | 1 | Starbucks | 6 | |
| DHL | 1 | Subway | 3 | |
| FedEx | 4 | T-Mobile | 1 | |
| GameStop | 1 | Target | 1 | |
| Jamba Juice | 1 | Trader Joe's | 1 | |
| Jones New York | 2 | True Value | 1 | |
| Kroger | 3 | UPS | 4 | |
| MasterBrand Cabinets | 4 | Vans | 1 | |
| Nike | 1 | Vons | 1 | |
| Quiznos | 1 | Whole Foods Market | 1 | |
| Ramada | 1 | |||
Strongest AM radio stations in West Hollywood:
- KSPN (710 AM; 50 kW; LOS ANGELES, CA; Owner: KABC-AM RADIO, INC.)
- KBLA (1580 AM; 50 kW; SANTA MONICA, CA)
- KHJ (930 AM; 5 kW; LOS ANGELES, CA; Owner: LBI RADIO LICENSE CORP.)
- KFWB (980 AM; 50 kW; LOS ANGELES, CA; Owner: INFINITY BROADCASTING OPERATIONS, INC.)
- KABC (790 AM; 5 kW; LOS ANGELES, CA; Owner: KABC-AM RADIO, INC.)
- KMPC (1540 AM; 50 kW; LOS ANGELES, CA; Owner: ROSE CITY RADIO CORPORATION)
- KRLA (870 AM; 20 kW; GLENDALE, CA; Owner: NEW INSPIRATION BROADCASTING COMPANY)
- KFOX (1650 AM; 10 kW; TORRANCE, CA; Owner: CHAGAL COMMUNICATIONS, INC.)
- KXMX (1190 AM; 25 kW; ANAHEIM, CA; Owner: NEW INSPIRATION BROADCASTING COMPANY)
- KNX (1070 AM; 50 kW; LOS ANGELES, CA; Owner: INFINITY BROADCASTING OPERATIONS, INC.)
- KLAC (570 AM; 50 kW; LOS ANGELES, CA; Owner: AMFM RADIO LICENSES, L.L.C.)
- KWKW (1330 AM; 5 kW; LOS ANGELES, CA; Owner: LOTUS COMMUNICATIONS CORP.)
- KSUR (1260 AM; 25 kW; BEVERLY HILLS, CA)
Strongest FM radio stations in West Hollywood:
- KKBT (100.3 FM; LOS ANGELES, CA; Owner: RADIO ONE LICENSES, LLC)
- KYSR (98.7 FM; LOS ANGELES, CA; Owner: AMFM RADIO LICENSES, L.L.C.)
- KCRW (89.9 FM; SANTA MONICA, CA; Owner: SANTA MONICA COMM. COLLEGE DISTRICT)
- KRTH-FM (101.1 FM; LOS ANGELES, CA; Owner: INFINITY BROADCASTING OPERATIONS, INC.)
- KZLA-FM (93.9 FM; LOS ANGELES, CA; Owner: EMMIS RADIO LICENSE CORPORATION)
- KPWR (105.9 FM; LOS ANGELES, CA; Owner: EMMIS RADIO LICENSE CORPORATION)
- KLSX (97.1 FM; LOS ANGELES, CA; Owner: INFINITY BROADCASTING OPERATIONS, INC.)
- KUSC (91.5 FM; LOS ANGELES, CA; Owner: UNIVERSITY OF SOUTHERN CALIFORNIA)
- KKLA-FM (99.5 FM; LOS ANGELES, CA; Owner: NEW INSPIRATION BROADCASTING CO., INC.)
- KROQ-FM (106.7 FM; PASADENA, CA; Owner: INFINITY BROADCASTING CORP. OF LOS ANGELES)
- KCBS-FM (93.1 FM; LOS ANGELES, CA; Owner: INFINITY BROADCASTING OPERATIONS, INC.)
- KSCA (101.9 FM; GLENDALE, CA; Owner: HBC LICENSE CORPORATION)
- K212FA (90.3 FM; TEMPLE CITY, CA; Owner: EDUCATIONAL MEDIA FOUNDATION)
- KLOS (95.5 FM; LOS ANGELES, CA; Owner: KLOS-FM RADIO, INC.)
- KOST (103.5 FM; LOS ANGELES, CA; Owner: CAPSTAR TX LIMITED PARTNERSHIP)
- KLVE (107.5 FM; LOS ANGELES, CA; Owner: KLVE-FM LICENSE CORP.)
- KIIS-FM (102.7 FM; LOS ANGELES, CA; Owner: CITICASTERS LICENSES, L.P.)
- KPCC (89.3 FM; PASADENA, CA; Owner: PASADENA AREA COMMUNITY COLLEGE DISTRICT)
- KHHT (92.3 FM; LOS ANGELES, CA; Owner: AMFM RADIO LICENSES, L.L.C.)
- KBIG-FM (104.3 FM; LOS ANGELES, CA; Owner: AMFM RADIO LICENSES, L.L.C.)
TV broadcast stations around West Hollywood:
- KTRO-LP (Channel 50; LANCASTER, CA; Owner: ROBERT D. ADELMAN)
- KCBS-TV (Channel 2; LOS ANGELES, CA; Owner: CBS BROADCASTING INC.)
- KTLA-TV (Channel 5; LOS ANGELES, CA; Owner: KTLA INC.)
- KABC-TV (Channel 7; LOS ANGELES, CA; Owner: ABC HOLDING COMPANY, INC.)
- KCAL-TV (Channel 9; LOS ANGELES, CA; Owner: VIACOM TELEVISION STATIONS GROUP OF LOS ANGELES LLC)
- KNBC (Channel 4; LOS ANGELES, CA; Owner: NBC SUBSIDIARY (KNBC-TV), INC.)
- K38CY (Channel 38; VAN NUYS, CA; Owner: CAPITAL BROADCASTING CORPORATION)
- KWJD-LP (Channel 25; VAN NUYS, CA; Owner: FRIENDLY BROADCASTING COMPANY)
- KMEX-TV (Channel 34; LOS ANGELES, CA; Owner: KMEX LICENSE PARTNERSHIP, G.P.)
- KAZA-TV (Channel 54; AVALON, CA; Owner: PAPPAS SOUTHERN CALIFORNIA LICENSE LLC)
- KDOC-TV (Channel 56; ANAHEIM, CA; Owner: GOLDEN ORANGE BROADCASTING CO., INC.)
- KOCE-TV (Channel 50; HUNTINGTON BEACH, CA; Owner: BD. OF TRUSTEES, COAST COMMUNITY COLLEGE DIST.)
- KSCI (Channel 18; LONG BEACH, CA; Owner: KSLS, INC.)
- KXLA (Channel 44; RANCHO PALOS VERDES, CA; Owner: RANCHO PALOS VERDES BROADCASTERS, INC.)
- KCET (Channel 28; LOS ANGELES, CA; Owner: COMMUNITY TELEVISION OF SOUTHERN CALIFORNIA)
- KFTR (Channel 46; ONTARIO, CA; Owner: TELEFUTURA LOS ANGELES LLC)
- KSMV-LP (Channel 33; LOS ANGELES, CA; Owner: KJLA, LLC)
- KTTV (Channel 11; LOS ANGELES, CA; Owner: FOX TELEVISION STATIONS, INC.)
- KWHY-TV (Channel 22; LOS ANGELES, CA; Owner: TELEMUNDO OF LOS ANGELES LICENSE CORPORATION)
- KVEA (Channel 52; CORONA, CA; Owner: ESTRELLA LICENSE CORPORATION)
- KCOP-TV (Channel 13; LOS ANGELES, CA; Owner: FOX TELEVISION STATIONS, INC.)
FCC Registered Broadcast Land Mobile Towers: 36 (See the full list of FCC Registered Broadcast Land Mobile Towers in West Hollywood, CA)
FCC Registered Microwave Towers: 37 (See the full list of FCC Registered Microwave Towers in this town)
FCC Registered Amateur Radio Licenses: 55 (See the full list of FCC Registered Amateur Radio Licenses in West Hollywood)
FAA Registered Aircraft: 12 (See the full list of FAA Registered Aircraft in West Hollywood)
2005 - 2018 National Fire Incident Reporting System (NFIRS) incidents
- Fire incident types reported to NFIRS in West Hollywood, CA
- 42647.8%Structure Fires
- 32636.6%Outside Fires
- 9410.5%Mobile Property/Vehicle Fires
- 455.1%Other
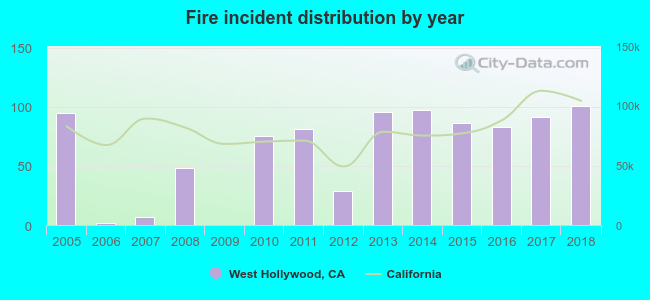 According to the data from the years 2005 - 2018 the average number of fire incidents per year is 64. The highest number of fire incidents - 101 took place in 2018, and the least - 0 in 2009. The data has a growing trend.
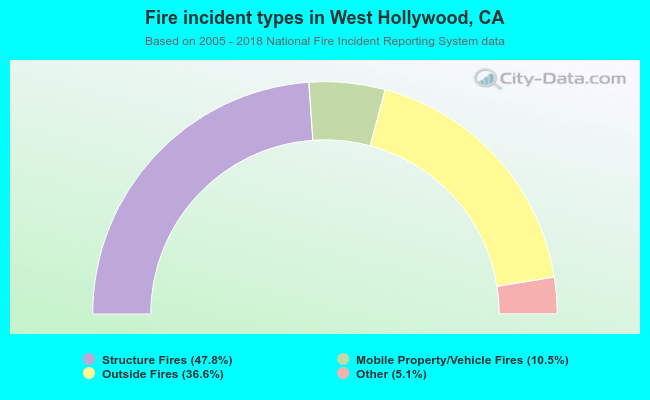 When looking into fire subcategories, the most reports belonged to: Structure Fires (47.8%), and Outside Fires (36.6%).
Fire-safe hotels and motels in West Hollywood, California:
- The Grafton On Sunset, 8462 W Sunset Blvd, West Hollywood, California 90069 , Phone: (323) 654-4600, Fax: (323) 654-2286
- Mondrian Los Angeles, 8440 Sunset Blvd, West Hollywood, California 90069 , Phone: (323) 650-8999, Fax: (323) 650-5215
- Palihouse Holloway, 8465 Holloway Dr, West Hollywood, California 90069 , Phone: (323) 656-4100, Fax: (323) 656-4500
- 1 Hotel West Hollywood, 8490 W Sunset Blvd, West Hollywood, California 90069 , Phone: (310) 424-1600
| Most common first names in West Hollywood, CA among deceased individuals | ||
| Name | Count | Lived (average) |
|---|---|---|
| John | 104 | 67.8 years |
| Robert | 103 | 67.9 years |
| William | 96 | 72.4 years |
| Joseph | 88 | 77.7 years |
| Harry | 77 | 77.9 years |
| Mary | 76 | 81.1 years |
| David | 73 | 64.5 years |
| George | 72 | 74.1 years |
| Louis | 67 | 76.5 years |
| Rose | 63 | 81.8 years |
| Most common last names in West Hollywood, CA among deceased individuals | ||
| Last name | Count | Lived (average) |
|---|---|---|
| Smith | 45 | 70.9 years |
| Cohen | 35 | 76.5 years |
| Miller | 25 | 75.9 years |
| Brown | 23 | 74.1 years |
| Schwartz | 23 | 77.1 years |
| Goldstein | 22 | 78.6 years |
| Shapiro | 21 | 78.8 years |
| Davis | 21 | 69.9 years |
| Katz | 19 | 80.2 years |
| Greenberg | 18 | 82.7 years |
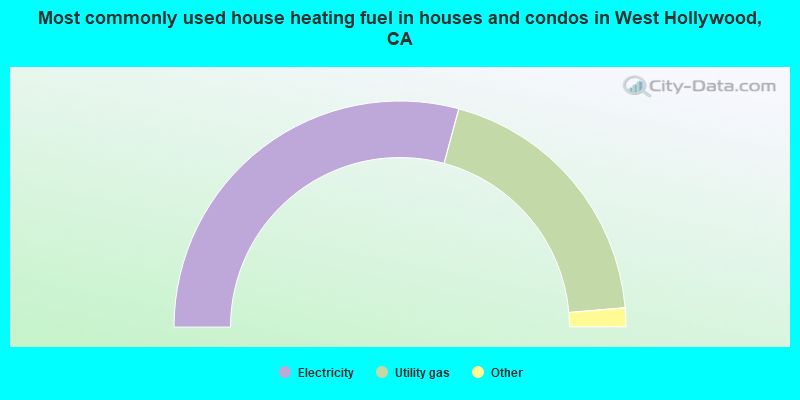
- 58.4%Electricity
- 38.9%Utility gas
- 1.8%Bottled, tank, or LP gas
- 0.9%No fuel used
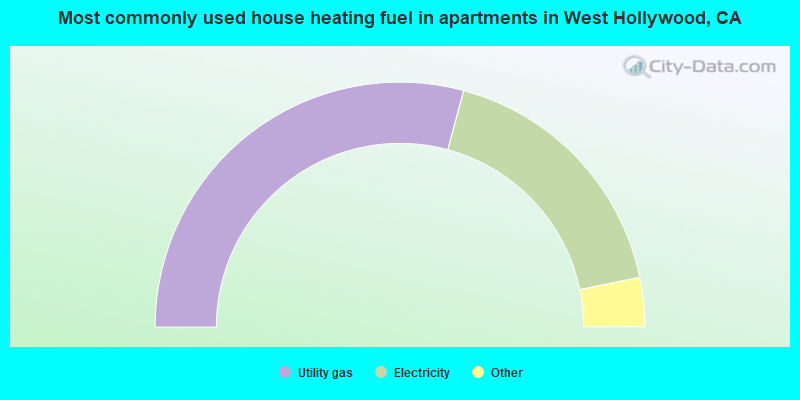
- 58.4%Utility gas
- 35.1%Electricity
- 3.7%No fuel used
- 2.3%Bottled, tank, or LP gas
- 0.3%Wood
- 0.2%Fuel oil, kerosene, etc.
West Hollywood compared to California state average:
- Unemployed percentage below state average.
- Hispanic race population percentage significantly below state average.
- Median age significantly above state average.
- Renting percentage above state average.
- Number of rooms per house significantly below state average.
- Percentage of population with a bachelor's degree or higher significantly above state average.
West Hollywood on our top lists:
- #1 on the list of "Top 101 cities with largest percentage of males in industries: information (population 5,000+)"
- #1 on the list of "Top 101 cities with largest percentage of females in industries: information (population 5,000+)"
- #2 on the list of "Top 101 cities with largest percentage of males in occupations: arts, design, entertainment, sports, and media occupations (population 5,000+)"
- #3 on the list of "Top 101 cities with the largest percentage of likely homosexual households (counted as self-reported same-sex unmarried-partner households) (population 5,000+)"
- #3 on the list of "Top 101 cities with the largest percentage of likely gay men couples (counted as self-reported male-male unmarried-partner households) (population 5,000+)"
- #3 on the list of "Top 101 cities with largest percentage of females in occupations: arts, design, entertainment, sports, and media occupations (population 5,000+)"
- #4 on the list of "Top 101 cities with the lowest percentage of family households, population 10,000+"
- #6 on the list of "Top 101 cities with the smallest percentage of one, detached housing units in structures (20,000+ housing units)"
- #8 on the list of "Top 100 cities with smallest houses (pop. 5,000+)"
- #9 on the list of "Top 101 cities with the most local government spending on current operations of parking facilities per resident (population 10,000+)"
- #9 on the list of "Top 101 cities with the lowest percentage of family households, population 1,000+"
- #9 on the list of "Top 101 cities with the highest housing density (population 2,000+)"
- #11 on the list of "Top 101 cities where the highest percentage of males (15+ years) which never married (with at least 10,000 males in this group)"
- #12 on the list of "Top 101 cities with the most residents born in Ukraine (population 500+)"
- #21 on the list of "Top 101 cities with the most residents born in Europe (population 500+)"
- #23 on the list of "Top 100 cities with highest ratio of median house value to median household income (pop. 5,000+)"
- #26 on the list of "Top 101 cities with the most residents born in Eastern Europe (population 500+)"
- #35 on the list of "Top 101 cities with the most residents born in Russia (population 500+)"
- #48 on the list of "Top 101 cities with the smallest percentage of one, detached housing units in structures (2,000+ housing units)"
- #51 on the list of "Top 101 cities with largest percentage of males in industries: arts, entertainment, and recreation (population 5,000+)"
- #42 (90069) on the list of "Top 101 zip codes with the most beauty salons in 2005"
- #49 (90069) on the list of "Top 101 zip codes with the largest percentage of taxpayers reporting profit/loss from business in 2012 (pop 5,000+)"
- #1 on the list of "Top 101 counties with the most Evangelical Protestant congregations"
- #1 on the list of "Top 101 counties with the most Mainline Protestant congregations"
- #1 on the list of "Top 101 counties with the most Orthodox adherents"
- #1 on the list of "Top 101 counties with the highest ground withdrawal of fresh water for public supply (pop. 50,000+)"
- #1 on the list of "Top 101 counties with the most Catholic adherents (pop. 50,000+)"

|
|
Total of 385 patent applications in 2008-2024.