Glendale: Fire Incidents, California (CA)
Where are fire incidents reported in Glendale, CA
Something went wrong! Please refresh the page.
| Fire incidents reported | |
|---|---|
| Sreet name | Count |
| BRAND BLVD | 114 |
| GLENOAKS BLVD | 104 |
| CENTRAL AVE | 92 |
| COLORADO ST | 84 |
| GLENDALE AVE | 82 |
| VERDUGO RD | 80 |
| CHEVY CHASE DR | 66 |
| ADAMS ST | 60 |
| BROADWAY | 60 |
| SAN FERNANDO RD | 60 |
| MAPLE ST | 50 |
| MOUNTAIN ST | 42 |
| ACACIA AVE | 38 |
| COLUMBUS AVE | 38 |
| CALIFORNIA AVE | 36 |
| PALMER AVE | 36 |
| WILSON AVE | 36 |
| LOUISE ST | 34 |
| WINDSOR RD | 34 |
| ELK AVE | 32 |
| HARVARD ST | 32 |
| THOMPSON AVE | 30 |
| JACKSON ST | 28 |
| DORAN ST | 26 |
| DRYDEN DR | 26 |
| GARFIELD AVE | 26 |
| MARYLAND AVE | 26 |
| GLENWOOD RD | 24 |
| LEXINGTON DR | 24 |
| LINDEN AVE | 24 |
| Other | 808 |
2005 - 2018 National Fire Incident Reporting System (NFIRS) incidents
- Incident types reported to NFIRS in Glendale, CA
- 50,80676.9%Rescue & EMS
- 4,0706.2%Good Intent Call
- 3,3615.1%False Alarm
- 3,1684.8%Hazardous Condition
- 2,2523.4%Fire
- 2,2363.4%Service Call
- 1130.2%Severe Weather
- Fire incident types reported to NFIRS in Glendale, CA
- 74833.2%Structure Fires
- 64028.4%Outside Fires
- 49121.8%Mobile Property/Vehicle Fires
- 37316.6%Other
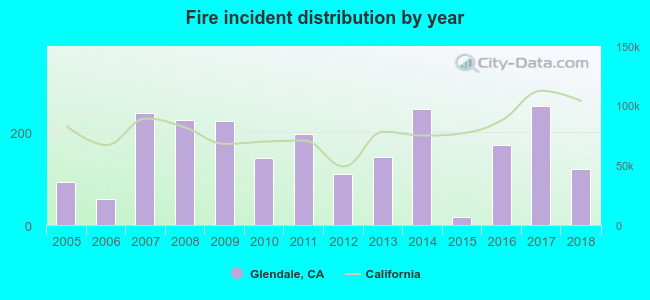 Based on the data from the years 2005 - 2018 the average number of fire incidents per year is 161. The highest number of fires - 257 took place in 2017, and the least - 17 in 2015. The data has a rising trend.
The average number of yearly fire incidents per 10k residents in Glendale, CA compared to nearest cities:
(Note: Based on data for the last 3 years, including only cities with population 5,000 and above)
| Glendale: | 9.1 |
| La Canada Flintridge: | 0.5 |
| Burbank: | 18.2 |
| Altadena: | 15.2 |
| South Pasadena: | 16.9 |
| Pasadena: | 20.6 |
| San Marino: | 11.7 |
| Alhambra: | 13.2 |
| West Hollywood: | 25.5 |
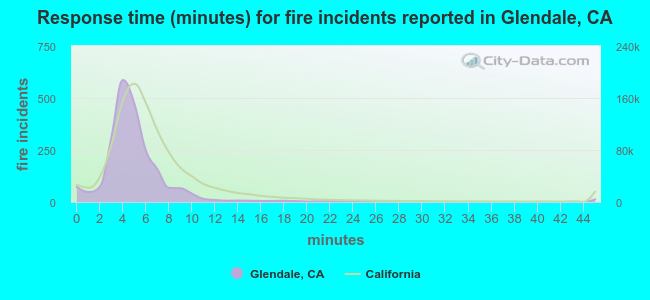 The median response time based on all reported fire incidents is 5 minutes. This is lower than the state median value.
The median response time in Glendale, CA compared to nearest cities:
(Note: Based on data for all years, including only cities with at least 500 fire incidents)
| Glendale: | 5 minutes |
| Burbank: | 4 minutes |
| Altadena: | 5 minutes |
| Pasadena: | 5 minutes |
| Alhambra: | 5 minutes |
| West Hollywood: | 4 minutes |
| Los Angeles: | 5 minutes |
| Monterey Park: | 5 minutes |
| East Los Angeles: | 5 minutes |
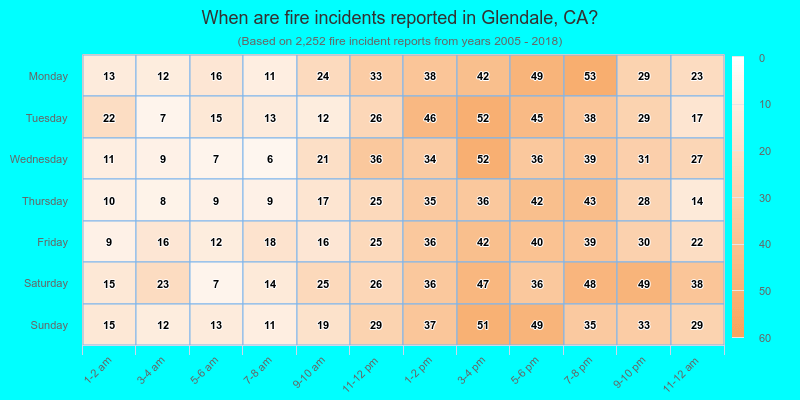
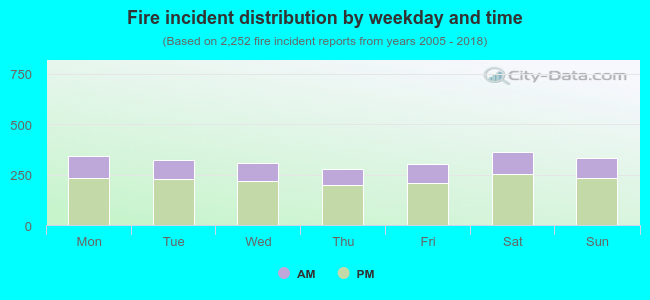 30.1% incidents where reported in the morning and 69.9% in the evening. The most fires (16.2%) took place on Saturday, and the least (12.3%) on Thursday.
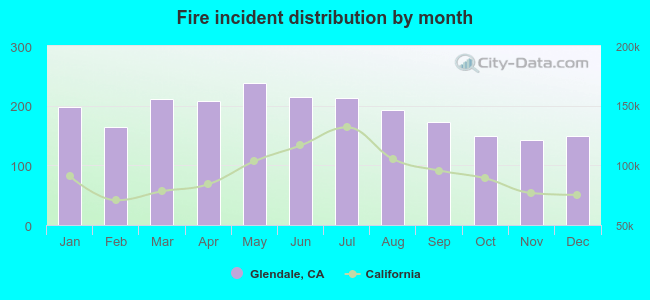 According to the 2,252 fires from years 2005 - 2018 most fires (10.6%) took place during May, and the least (6.3%) in November.
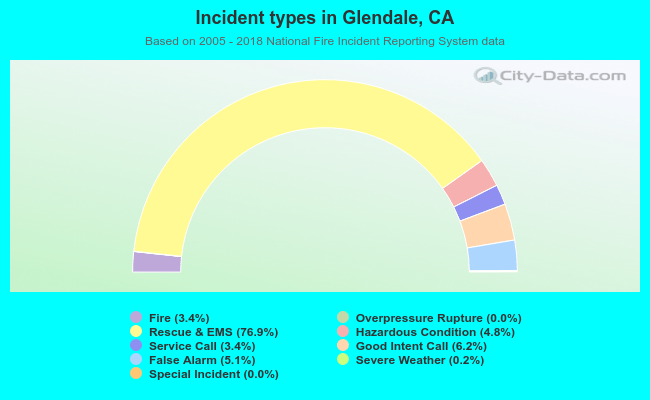 Out of all 66,062 cases reported during the years 2005 - 2018, the most belonged to the categories: Rescue & EMS (76.9%), Good Intent Call (6.2%), and False Alarm (5.1%).
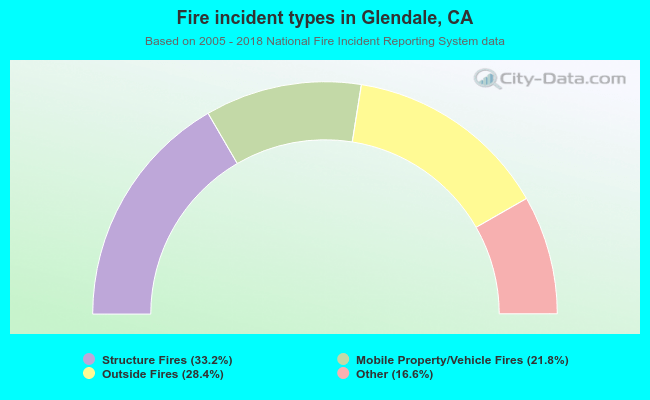 When looking into fire subcategories, the most incidents belonged to: Structure Fires (33.2%), and Outside Fires (28.4%).