San Marino: Fire Incidents, California (CA)
Where are fire incidents reported in San Marino, CA
Something went wrong! Please refresh the page.
|
| |||||||||||||||||||||||||||||||||||||||||||||||||||||||||||||||||||||||||||||||||||||||||||||||||||||||||||||
2005 - 2018 National Fire Incident Reporting System (NFIRS) incidents
- Incident types reported to NFIRS in San Marino, CA
- 70944.2%Rescue & EMS
- 29118.1%Good Intent Call
- 21013.1%Hazardous Condition
- 19812.3%Fire
- 1368.5%False Alarm
- 553.4%Service Call
- 50.3%Special Incident
- Fire incident types reported to NFIRS in San Marino, CA
- 13568.2%Structure Fires
- 4020.2%Outside Fires
- 178.6%Other
- 63.0%Mobile Property/Vehicle Fires
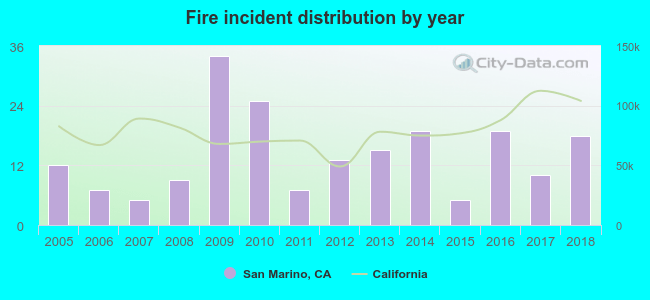 According to the data from the years 2005 - 2018 the average number of fire incidents per year is 14. The highest number of fires - 34 took place in 2009, and the least - 5 in 2007. The data has a rising trend.
The average number of yearly fire incidents per 10k residents in San Marino, CA compared to nearest cities:
(Note: Based on data for the last 3 years, including only cities with population 5,000 and above)
| San Marino: | 11.7 |
| East San Gabriel: | 1.7 |
| San Gabriel: | 15.8 |
| South Pasadena: | 16.9 |
| Pasadena: | 20.6 |
| Alhambra: | 13.2 |
| Temple City: | 7.8 |
| Rosemead: | 13.7 |
| Arcadia: | 12.9 |
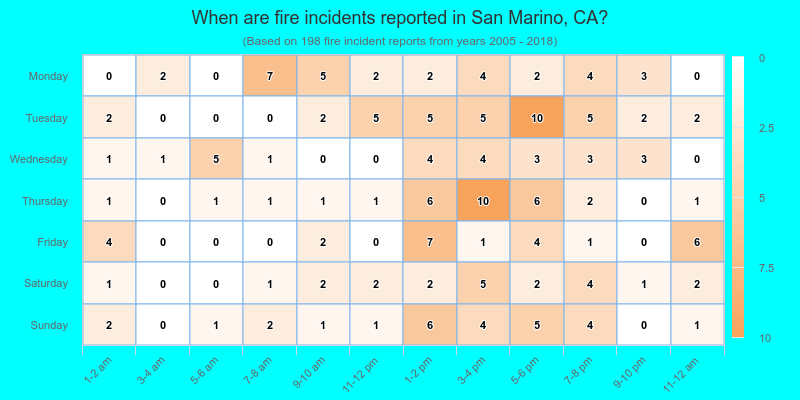
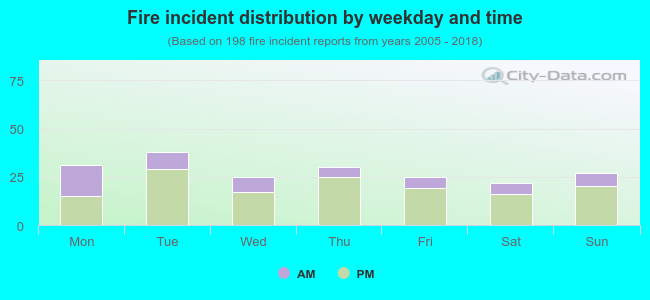 28.8% incidents where reported in the morning and 71.2% in the evening. The most fires (19.2%) took place on Tuesday, and the least (11.1%) on Saturday.
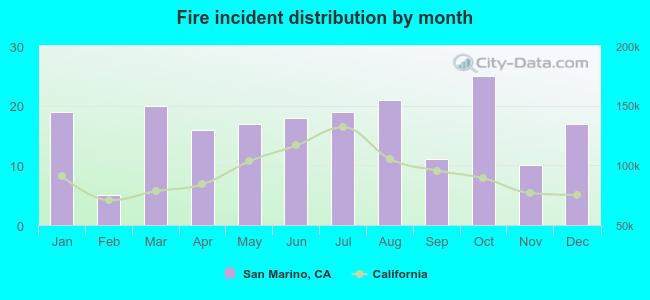 According to the 198 fire incident reports from years 2005 - 2018 most fires (12.6%) took place during October, and the least (2.5%) in February.
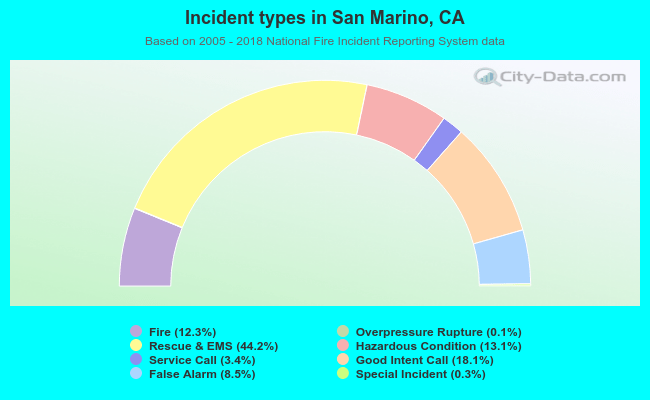 Out of all 1,605 cases reported during the years 2005 - 2018, the most belonged to the categories: Rescue & EMS (44.2%), Good Intent Call (18.1%), and Hazardous Condition (13.1%).
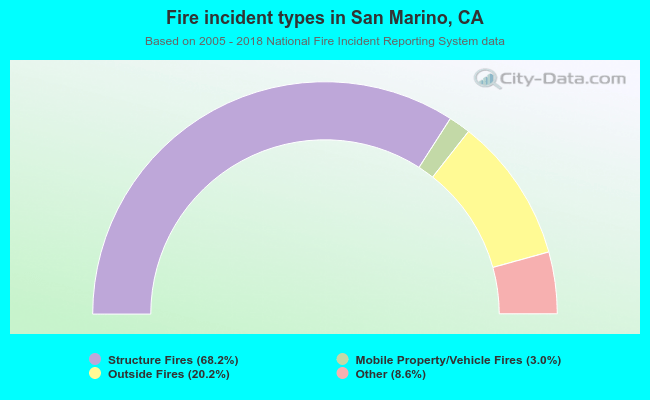 When looking into fire subcategories, the most incidents belonged to: Structure Fires (68.2%), and Outside Fires (20.2%).