Rosemead: Fire Incidents, California (CA)
Where are fire incidents reported in Rosemead, CA
Something went wrong! Please refresh the page.
|
| |||||||||||||||||||||||||||||||||||||||||||||||||||||||||||||||||||||||||||||||||||||||||||||||||||||||||||||
2005 - 2018 National Fire Incident Reporting System (NFIRS) incidents
- Incident types reported to NFIRS in Rosemead, CA
- 10,22467.4%Rescue & EMS
- 2,49316.4%Good Intent Call
- 9266.1%False Alarm
- 7414.9%Fire
- 4432.9%Hazardous Condition
- 3112.1%Service Call
- Fire incident types reported to NFIRS in Rosemead, CA
- 27637.2%Outside Fires
- 21629.1%Mobile Property/Vehicle Fires
- 20027.0%Structure Fires
- 496.6%Other
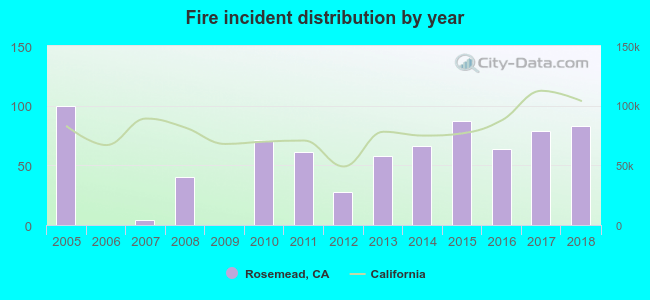 According to the data from the years 2005 - 2018 the average number of fires per year is 53. The highest number of reported fire incidents - 100 took place in 2005, and the least - 0 in 2006. The data has a decreasing trend.
The average number of yearly fire incidents per 10k residents in Rosemead, CA compared to nearest cities:
(Note: Based on data for the last 3 years, including only cities with population 5,000 and above)
| Rosemead: | 13.7 |
| South San Gabriel: | 12.4 |
| San Gabriel: | 15.8 |
| South El Monte: | 26.1 |
| Temple City: | 7.8 |
| Alhambra: | 13.2 |
| El Monte: | 14.1 |
| East San Gabriel: | 1.7 |
| Monterey Park: | 3.6 |
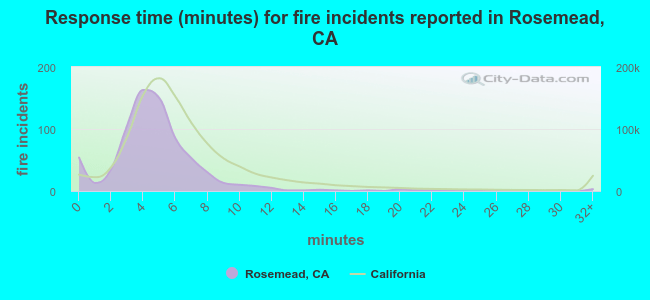 The median response time based on all reported fire incidents is 4 minutes. This is lower compared to the California median value.
The median response time in Rosemead, CA compared to nearest cities:
(Note: Based on data for all years, including only cities with at least 500 fire incidents)
| Rosemead: | 4 minutes |
| Alhambra: | 5 minutes |
| El Monte: | 4 minutes |
| Monterey Park: | 5 minutes |
| Montebello: | 7 minutes |
| Arcadia: | 5 minutes |
| East Los Angeles: | 5 minutes |
| Pico Rivera: | 5 minutes |
| Commerce: | 5 minutes |
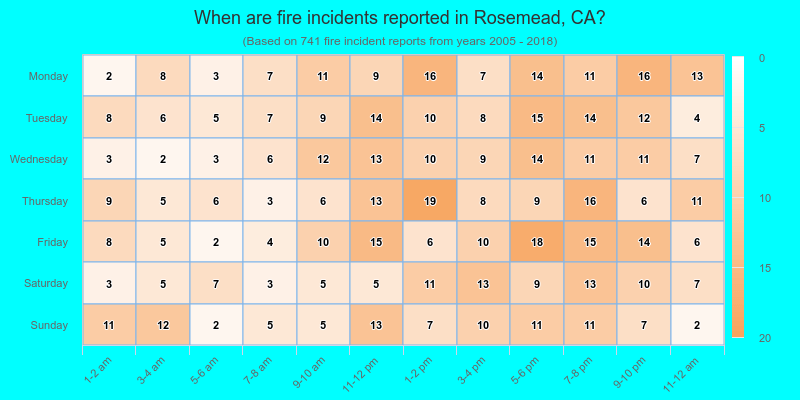
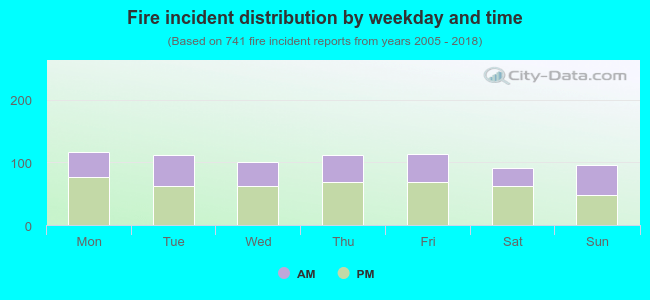 39.1% incidents where reported in the morning and 60.9% in the evening. The most fires (15.8%) took place on Monday, and the least (12.3%) on Saturday.
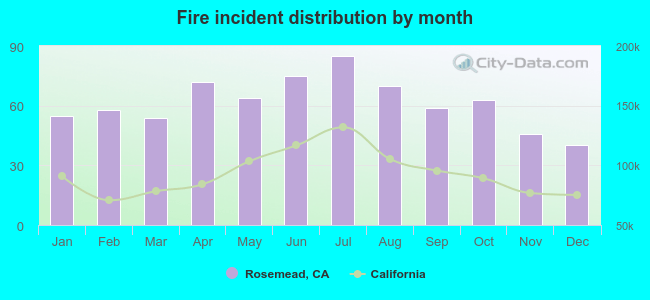 Based on the 741 fire incidents from years 2005 - 2018 most fires (11.5%) took place during July, and the least (5.4%) in December.
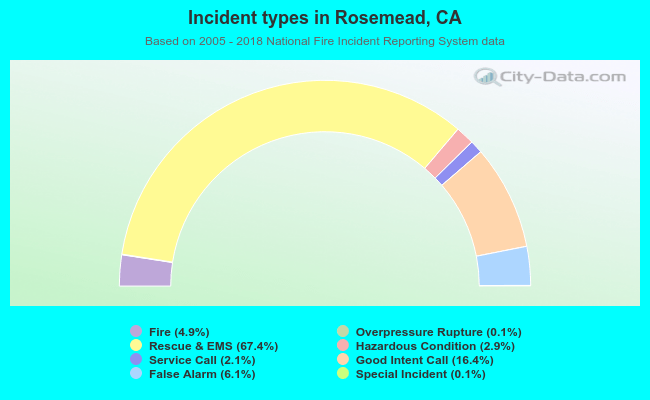 Out of all 15,159 cases reported during the years 2005 - 2018, the most belonged to the categories: Rescue & EMS (67.4%), Good Intent Call (16.4%), and False Alarm (6.1%).
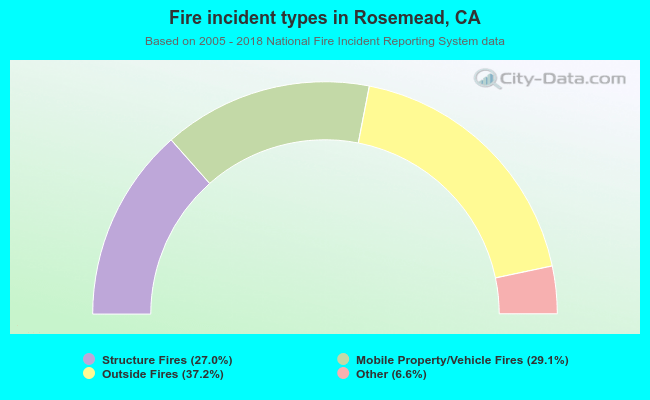 When looking into fire subcategories, the most reports belonged to: Outside Fires (37.2%), and Mobile Property/Vehicle Fires (29.1%).