San Gabriel: Fire Incidents, California (CA)
Where are fire incidents reported in San Gabriel, CA
Something went wrong! Please refresh the page.
|
| |||||||||||||||||||||||||||||||||||||||||||||||||||||||||||||||||||||||||||||||||||||||||||||||||||||||||||||
2005 - 2018 National Fire Incident Reporting System (NFIRS) incidents
- Incident types reported to NFIRS in San Gabriel, CA
- 4,31268.1%Rescue & EMS
- 6009.5%Good Intent Call
- 4507.1%Fire
- 3786.0%False Alarm
- 3325.2%Service Call
- 2303.6%Hazardous Condition
- 200.3%Special Incident
- 90.1%Severe Weather
- Fire incident types reported to NFIRS in San Gabriel, CA
- 28864.0%Structure Fires
- 10122.4%Outside Fires
- 368.0%Mobile Property/Vehicle Fires
- 255.6%Other
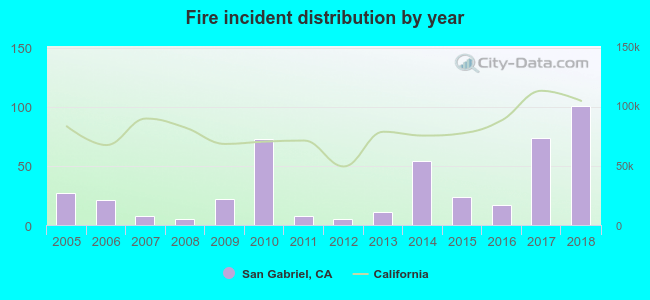 Based on the data from the years 2005 - 2018 the average number of fire incidents per year is 32. The highest number of reported fire incidents - 101 took place in 2018, and the least - 5 in 2008. The data has a rising trend.
The average number of yearly fire incidents per 10k residents in San Gabriel, CA compared to nearest cities:
(Note: Based on data for the last 3 years, including only cities with population 5,000 and above)
| San Gabriel: | 15.8 |
| Rosemead: | 13.7 |
| East San Gabriel: | 1.7 |
| San Marino: | 11.7 |
| Alhambra: | 13.2 |
| Temple City: | 7.8 |
| South San Gabriel: | 12.4 |
| South Pasadena: | 16.9 |
| Monterey Park: | 3.6 |
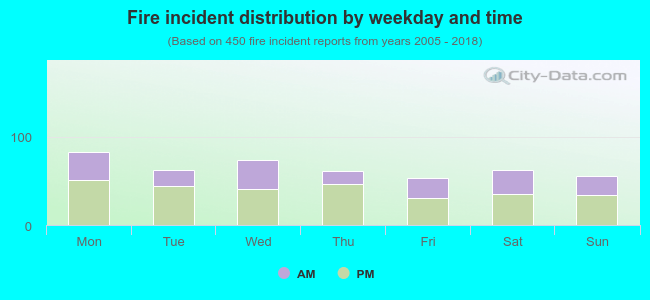 37.3% incidents where reported in the morning and 62.7% in the evening. The most fires (18.4%) took place on Monday, and the least (11.8%) on Friday.
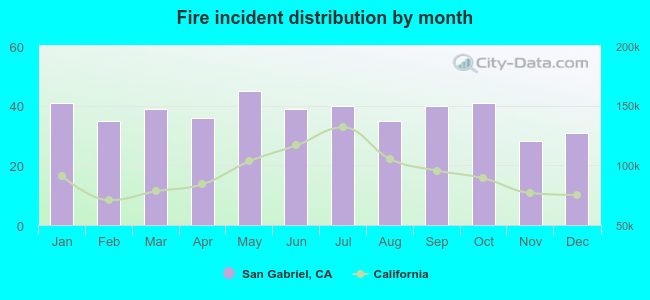 Based on the 450 fire incident reports from years 2005 - 2018 most fires (10.0%) took place during May, and the least (6.2%) in November.
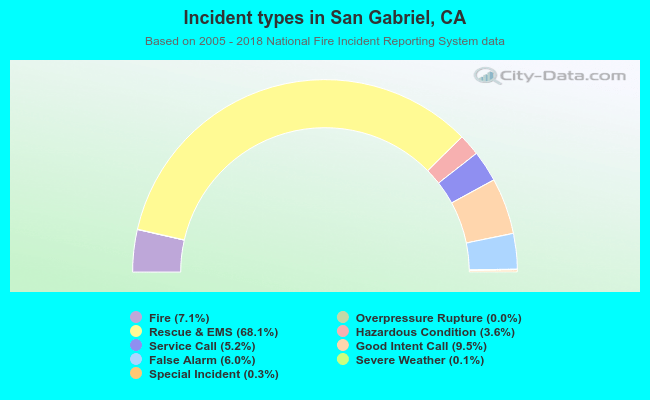 Out of all 6,334 cases reported during the years 2005 - 2018, the most belonged to the categories: Rescue & EMS (68.1%), Good Intent Call (9.5%), and Fire (7.1%).
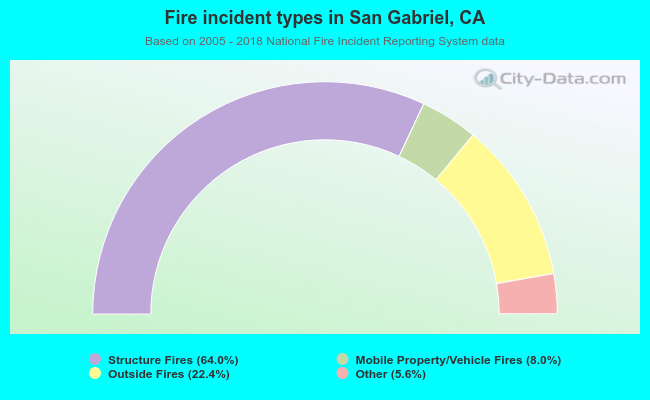 When looking into fire subcategories, the most reports belonged to: Structure Fires (64.0%), and Outside Fires (22.4%).