Arcadia: Fire Incidents, California (CA)
Where are fire incidents reported in Arcadia, CA
Something went wrong! Please refresh the page.
| Fire incidents reported | |
|---|---|
| Sreet name | Count |
| BALDWIN AVE | 114 |
| HUNTINGTON DR | 102 |
| DUARTE RD | 72 |
| LIVE OAK AVE | 48 |
| FAIRVIEW AVE | 46 |
| HUNTINGTON | 44 |
| SANTA ANITA AVE | 44 |
| BALDWIN | 42 |
| PECK RD | 40 |
| LIVE OAK | 38 |
| 210 FWY | 36 |
| SECOND AVE | 34 |
| FAIRVIEW | 30 |
| FOOTHILL BL | 30 |
| EB 210 FWY | 28 |
| ARCADIA AVE | 26 |
| CAMINO REAL | 26 |
| WB 210 FWY | 26 |
| CLARK ST | 24 |
| DUARTE | 24 |
| FIRST AVE | 24 |
| LONGDEN AVE | 22 |
| CAMPUS DR | 20 |
| LEMON AVE | 20 |
| SANTA ANITA | 20 |
| FANO ST | 18 |
| ARCADIA | 16 |
| BONITA ST | 16 |
| FOOTHILL | 16 |
| GOLDEN WEST AVE | 16 |
2005 - 2018 National Fire Incident Reporting System (NFIRS) incidents
- Incident types reported to NFIRS in Arcadia, CA
- 8,83361.8%Rescue & EMS
- 1,47010.3%False Alarm
- 1,3159.2%Good Intent Call
- 1,0427.3%Fire
- 9696.8%Hazardous Condition
- 6354.4%Service Call
- 150.1%Special Incident
- Fire incident types reported to NFIRS in Arcadia, CA
- 60257.8%Structure Fires
- 26025.0%Outside Fires
- 12011.5%Mobile Property/Vehicle Fires
- 605.8%Other
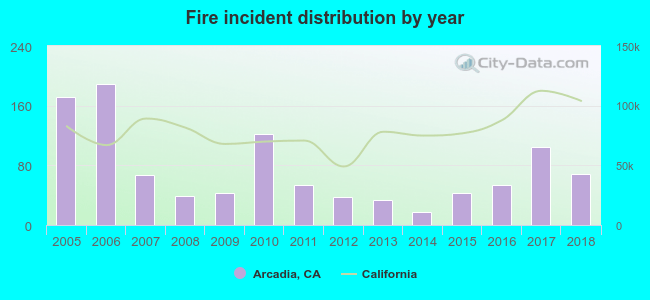 According to the data from the years 2005 - 2018 the average number of fire incidents per year is 74. The highest number of reported fires - 189 took place in 2006, and the least - 17 in 2014. The data has a decreasing trend.
The average number of yearly fire incidents per 10k residents in Arcadia, CA compared to nearest cities:
(Note: Based on data for the last 3 years, including only cities with population 5,000 and above)
| Arcadia: | 12.9 |
| Monrovia: | 21.6 |
| Sierra Madre: | 20.6 |
| Temple City: | 7.8 |
| East San Gabriel: | 1.7 |
| El Monte: | 14.1 |
| Duarte: | 13.0 |
| San Marino: | 11.7 |
| San Gabriel: | 15.8 |
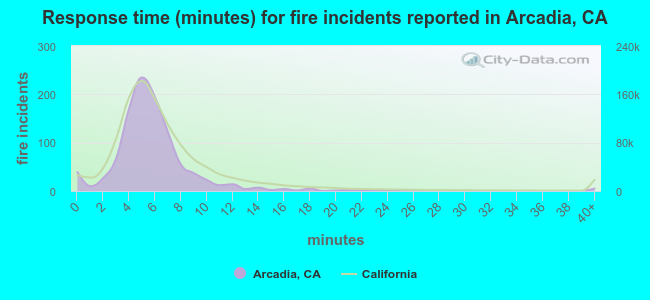 The median response time based on all reported fire incidents is 5 minutes. This is lower compared to the state median value.
The median response time in Arcadia, CA compared to nearest cities:
(Note: Based on data for all years, including only cities with at least 500 fire incidents)
| Arcadia: | 5 minutes |
| Monrovia: | 5 minutes |
| El Monte: | 4 minutes |
| Rosemead: | 4 minutes |
| Baldwin Park: | 5 minutes |
| Pasadena: | 5 minutes |
| Alhambra: | 5 minutes |
| Altadena: | 5 minutes |
| Azusa: | 5 minutes |
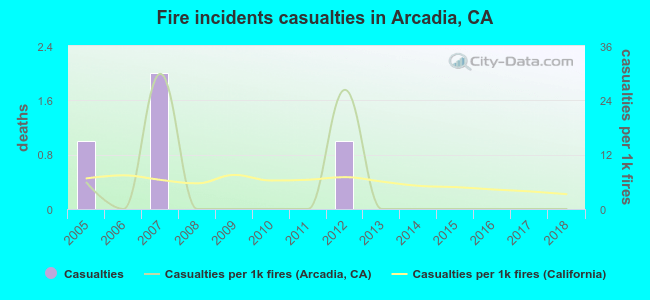 According to the data from the years 2005 - 2018 the average number of fire-related yearly casualties is 0. The highest number of reported injuries - 2 took place in 2007, and the lowest - 0 in 2006. The data has a declining trend.
The average number of injuries per 1,000 fire incidents is 4. This indicator was the highest - 30 in 2007, and the lowest 0 in 2006. The trend for casualties per 1,000 incidents is decreasing. Compared to the California value the number of injuries per 1,000 fire incidents is lower.
According to the data from the years 2005 - 2018 the average number of fire-related yearly casualties is 0. The highest number of reported injuries - 2 took place in 2007, and the lowest - 0 in 2006. The data has a declining trend.
The average number of injuries per 1,000 fire incidents is 4. This indicator was the highest - 30 in 2007, and the lowest 0 in 2006. The trend for casualties per 1,000 incidents is decreasing. Compared to the California value the number of injuries per 1,000 fire incidents is lower.
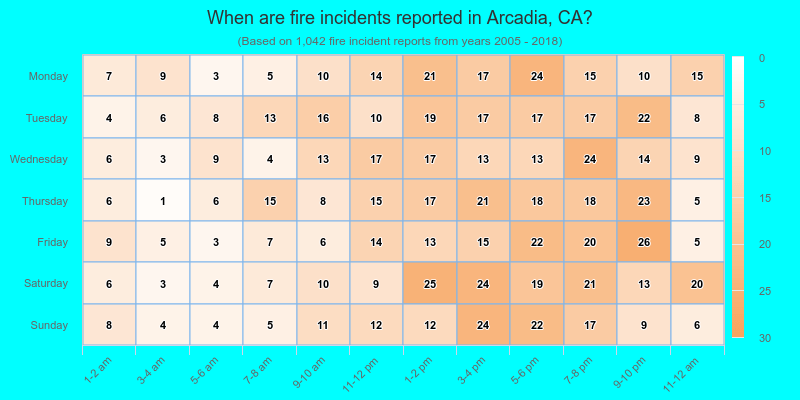
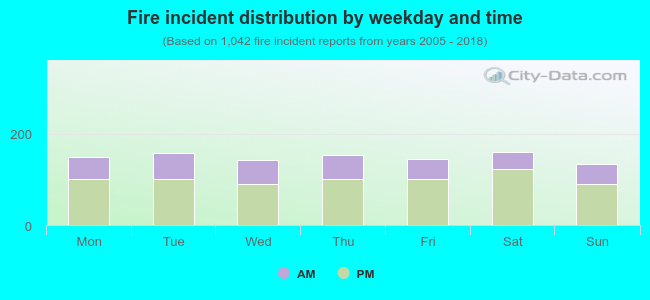 32.1% incidents where reported in the morning and 67.9% in the evening. The most fires (15.5%) took place on Saturday, and the least (12.9%) on Sunday.
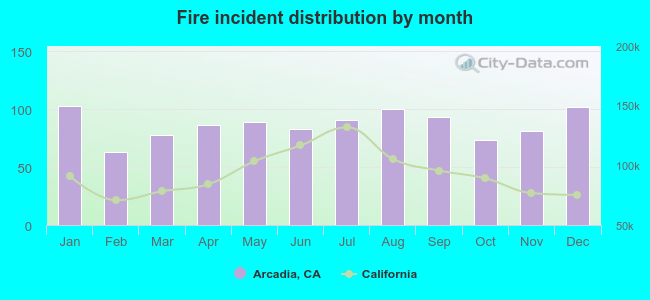 According to the 1,042 incident reports from years 2005 - 2018 most fires (9.9%) took place during January, and the least (6.0%) in February.
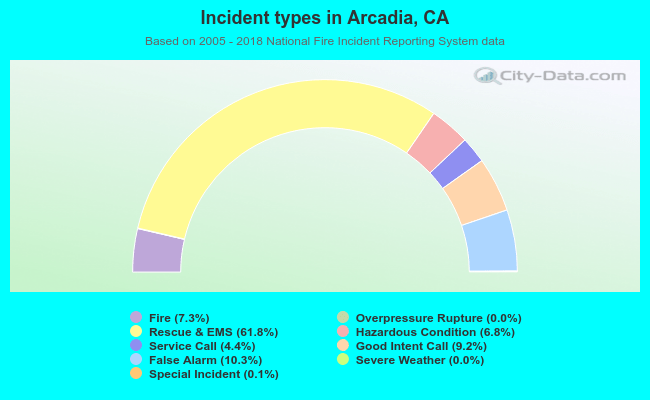 Out of all 14,290 cases reported during the years 2005 - 2018, the most belonged to the categories: Rescue & EMS (61.8%), False Alarm (10.3%), and Good Intent Call (9.2%).
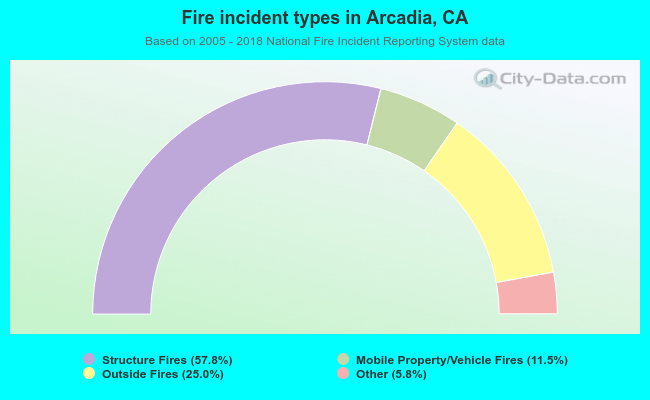 When looking into fire subcategories, the most incidents belonged to: Structure Fires (57.8%), and Outside Fires (25.0%).