Pasadena: Fire Incidents, California (CA)
Where are fire incidents reported in Pasadena, CA
Something went wrong! Please refresh the page.
| Fire incidents reported | |
|---|---|
| Sreet name | Count |
| 210 FWY | 322 |
| COLORADO BLVD | 228 |
| COLORADO BL | 218 |
| LAKE AVE | 154 |
| FAIR OAKS AV | 130 |
| FAIR OAKS AVE | 124 |
| LAKE AV | 124 |
| CALIFORNIA BLVD | 112 |
| RAYMOND AV | 112 |
| GREEN ST | 106 |
| VILLA ST | 104 |
| RAYMOND AVE | 96 |
| LOS ROBLES AVE | 90 |
| MARENGO AV | 86 |
| FOOTHILL BLVD | 84 |
| MOUNTAIN ST | 84 |
| MARENGO AVE | 82 |
| ARROYO PKWY | 78 |
| LOS ROBLES AV | 78 |
| ORANGE GROVE BLVD | 78 |
| FOOTHILL BL | 76 |
| 134 FWY | 74 |
| WALNUT ST | 74 |
| CALIFORNIA BL | 70 |
| DEL MAR BL | 70 |
| CORSON ST | 68 |
| EL MOLINO AVE | 68 |
| WASHINGTON BL | 66 |
| ALTADENA DR | 64 |
| EB 210 FWY | 62 |
| Other | 747 |
2005 - 2018 National Fire Incident Reporting System (NFIRS) incidents
- Incident types reported to NFIRS in Pasadena, CA
- 55,30570.8%Rescue & EMS
- 8,72011.2%False Alarm
- 4,0885.2%Good Intent Call
- 3,9295.0%Fire
- 2,9503.8%Service Call
- 2,8593.7%Hazardous Condition
- 1330.2%Overpressure Rupture
- 910.1%Special Incident
- Fire incident types reported to NFIRS in Pasadena, CA
- 1,89248.2%Structure Fires
- 95324.3%Outside Fires
- 87922.4%Mobile Property/Vehicle Fires
- 2055.2%Other
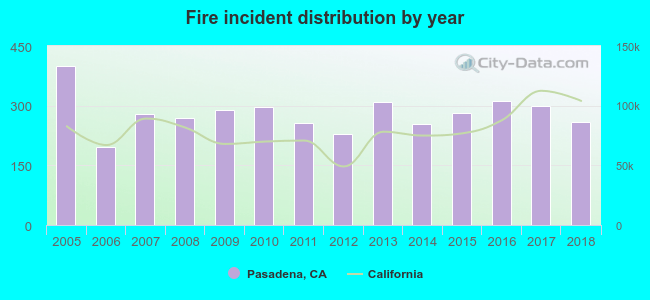 According to the data from the years 2005 - 2018 the average number of fires per year is 281. The highest number of fire incidents - 400 took place in 2005, and the least - 197 in 2006. The data has a declining trend.
The average number of yearly fire incidents per 10k residents in Pasadena, CA compared to nearest cities:
(Note: Based on data for the last 3 years, including only cities with population 5,000 and above)
| Pasadena: | 20.6 |
| Altadena: | 15.2 |
| San Marino: | 11.7 |
| South Pasadena: | 16.9 |
| East San Gabriel: | 1.7 |
| Sierra Madre: | 20.6 |
| San Gabriel: | 15.8 |
| Alhambra: | 13.2 |
| La Canada Flintridge: | 0.5 |
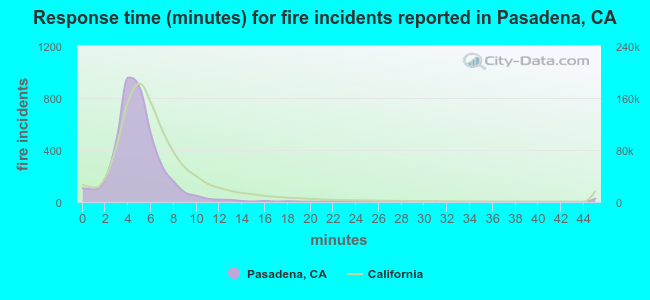 The median response time based on all reported fire incidents is 5 minutes. This is lower compared to the state median value.
The median response time in Pasadena, CA compared to nearest cities:
(Note: Based on data for all years, including only cities with at least 500 fire incidents)
| Pasadena: | 5 minutes |
| Altadena: | 5 minutes |
| Alhambra: | 5 minutes |
| Arcadia: | 5 minutes |
| Rosemead: | 4 minutes |
| Glendale: | 5 minutes |
| Monterey Park: | 5 minutes |
| Monrovia: | 5 minutes |
| El Monte: | 4 minutes |
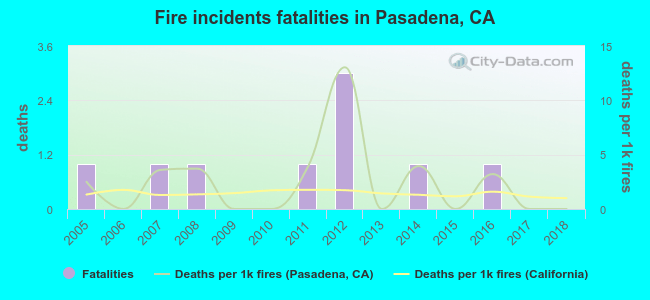 According to the data from the years 2005 - 2018 the average number of fire-related yearly deaths is 1. The highest number of deaths - 3 took place in 2012, and the lowest - 0 in 2006. The data has a decreasing trend.
The average number of fatalities per 1,000 fire incidents is 2. This indicator was the highest - 13 in 2012, and the lowest 0 in 2006. The trend for deaths per 1,000 fires is dropping. Compared to the state value the number of deaths per 1,000 fire incidents is higher.
According to the data from the years 2005 - 2018 the average number of fire-related yearly deaths is 1. The highest number of deaths - 3 took place in 2012, and the lowest - 0 in 2006. The data has a decreasing trend.
The average number of fatalities per 1,000 fire incidents is 2. This indicator was the highest - 13 in 2012, and the lowest 0 in 2006. The trend for deaths per 1,000 fires is dropping. Compared to the state value the number of deaths per 1,000 fire incidents is higher.Deaths per 1,000 incidents in Pasadena, CA compared to nearest cities:
(Note: Based on data for all years, including only cities with at least 2,500 fire incidents)
| Pasadena: | 2.3 |
| Burbank: | 1.2 |
| Los Angeles: | 2.0 |
| Inglewood: | 0.7 |
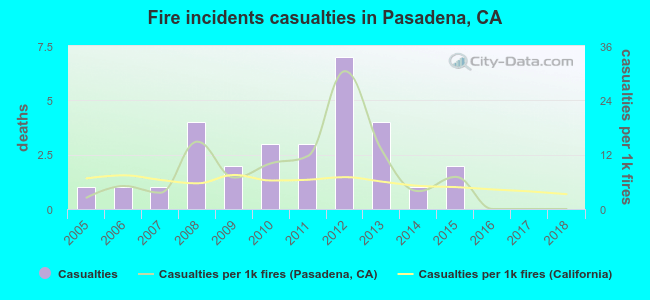 According to the data from the years 2005 - 2018 the average number of fire-related yearly casualties is 2. The highest number of reported casualties - 7 took place in 2012, and the lowest - 0 in 2016. The data has a declining trend.
The average number of casualties per 1,000 fires is 8. This indicator was the highest - 30 in 2012, and the lowest 0 in 2016. The trend for casualties per 1,000 fires is declining. Compared to the California value the number of casualties per 1,000 fires is higher.
According to the data from the years 2005 - 2018 the average number of fire-related yearly casualties is 2. The highest number of reported casualties - 7 took place in 2012, and the lowest - 0 in 2016. The data has a declining trend.
The average number of casualties per 1,000 fires is 8. This indicator was the highest - 30 in 2012, and the lowest 0 in 2016. The trend for casualties per 1,000 fires is declining. Compared to the California value the number of casualties per 1,000 fires is higher.
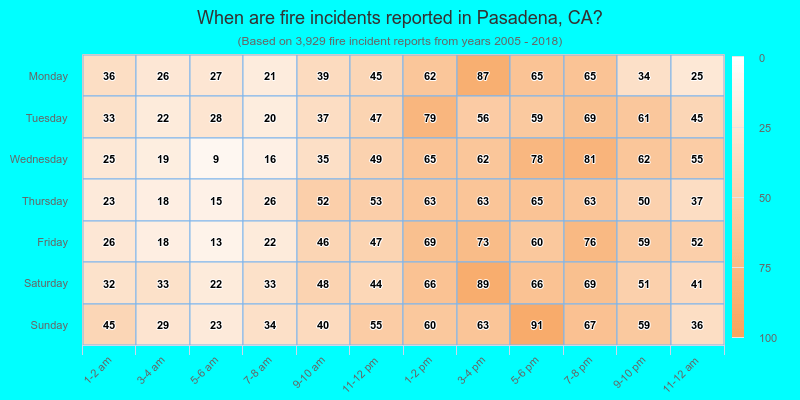
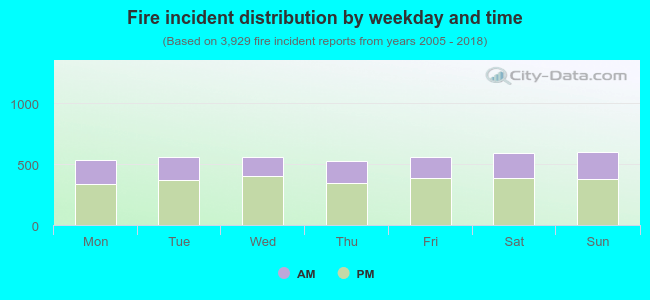 33.9% incidents where reported in the morning and 66.1% in the evening. The most fires (15.3%) took place on Sunday, and the least (13.4%) on Thursday.
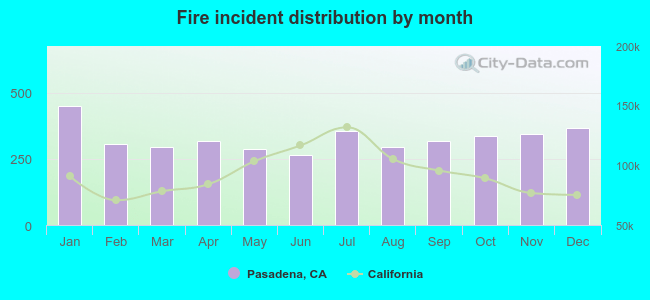 Based on the 3,929 fire incident reports from years 2005 - 2018 most fires (11.5%) took place during January, and the least (6.7%) in June.
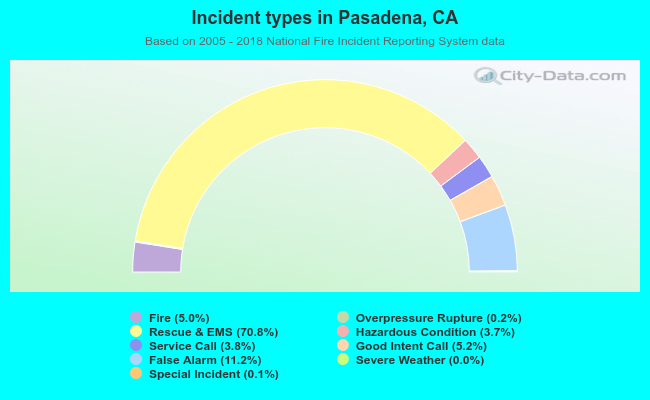 Out of all 78,087 cases reported during the years 2005 - 2018, the most belonged to the categories: Rescue & EMS (70.8%), False Alarm (11.2%), and Good Intent Call (5.2%).
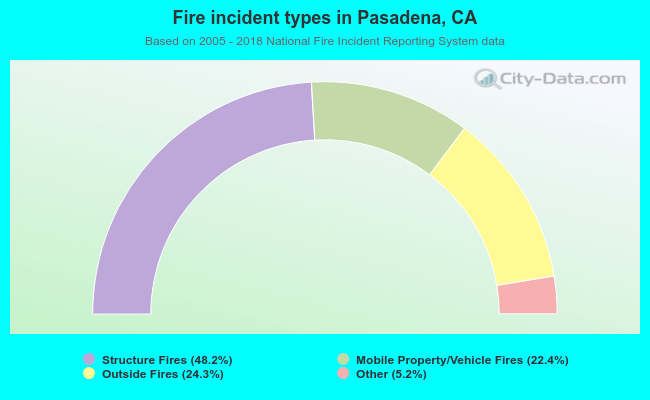 When looking into fire subcategories, the most reports belonged to: Structure Fires (48.2%), and Outside Fires (24.3%).