Altadena: Fire Incidents, California (CA)
Where are fire incidents reported in Altadena, CA
Something went wrong! Please refresh the page.
|
| |||||||||||||||||||||||||||||||||||||||||||||||||||||||||||||||||||||||||||||||||||||||||||||||||||||||||||||
2005 - 2018 National Fire Incident Reporting System (NFIRS) incidents
- Incident types reported to NFIRS in Altadena, CA
- 10,60565.8%Rescue & EMS
- 2,54715.8%Good Intent Call
- 9726.0%False Alarm
- 7574.7%Hazardous Condition
- 6514.0%Fire
- 5353.3%Service Call
- 450.3%Special Incident
- Fire incident types reported to NFIRS in Altadena, CA
- 27141.6%Structure Fires
- 19129.3%Outside Fires
- 12318.9%Mobile Property/Vehicle Fires
- 6610.1%Other
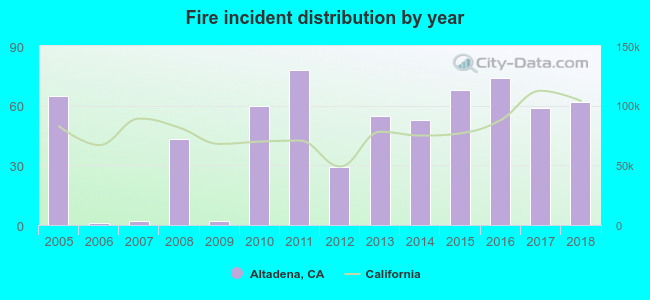 According to the data from the years 2005 - 2018 the average number of fires per year is 47. The highest number of reported fire incidents - 78 took place in 2011, and the least - 1 in 2006. The data has a dropping trend.
The average number of yearly fire incidents per 10k residents in Altadena, CA compared to nearest cities:
(Note: Based on data for the last 3 years, including only cities with population 5,000 and above)
| Altadena: | 15.2 |
| Pasadena: | 20.6 |
| La Canada Flintridge: | 0.5 |
| San Marino: | 11.7 |
| Sierra Madre: | 20.6 |
| South Pasadena: | 16.9 |
| East San Gabriel: | 1.7 |
| Glendale: | 9.1 |
| Arcadia: | 12.9 |
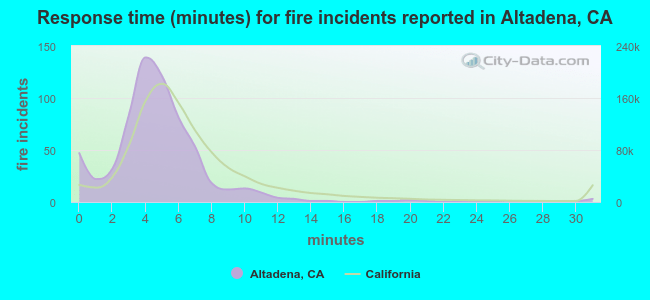 The median response time based on all reported fire incidents is 5 minutes. This is lower compared to the California median value.
The median response time in Altadena, CA compared to nearest cities:
(Note: Based on data for all years, including only cities with at least 500 fire incidents)
| Altadena: | 5 minutes |
| Pasadena: | 5 minutes |
| Glendale: | 5 minutes |
| Arcadia: | 5 minutes |
| Alhambra: | 5 minutes |
| Monrovia: | 5 minutes |
| Rosemead: | 4 minutes |
| Monterey Park: | 5 minutes |
| El Monte: | 4 minutes |
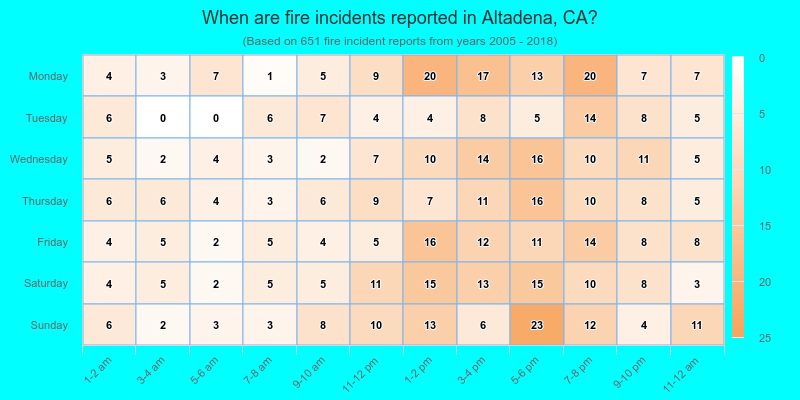
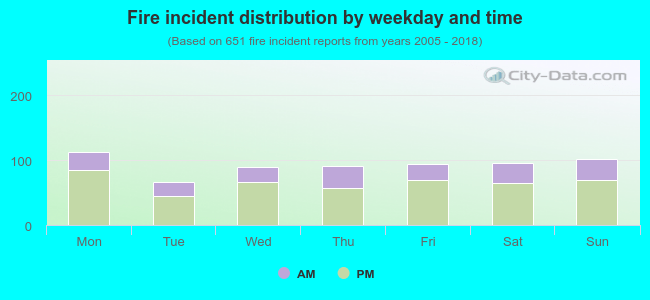 30.4% incidents where reported in the morning and 69.6% in the evening. The most fires (17.4%) took place on Monday, and the least (10.3%) on Tuesday.
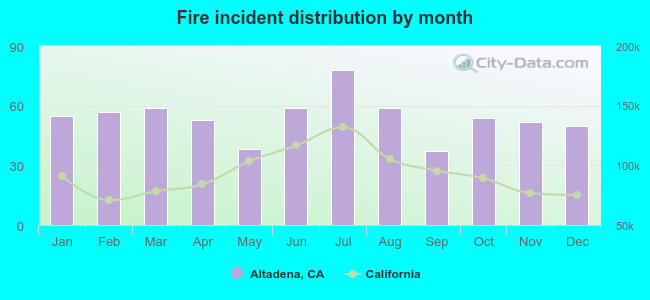 Based on the 651 fires from years 2005 - 2018 most fires (12.0%) took place during July, and the least (5.7%) in September.
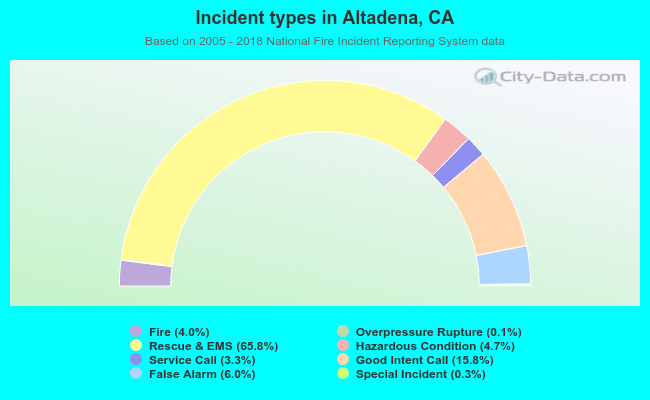 Out of all 16,128 cases reported during the years 2005 - 2018, the most belonged to the categories: Rescue & EMS (65.8%), Good Intent Call (15.8%), and False Alarm (6.0%).
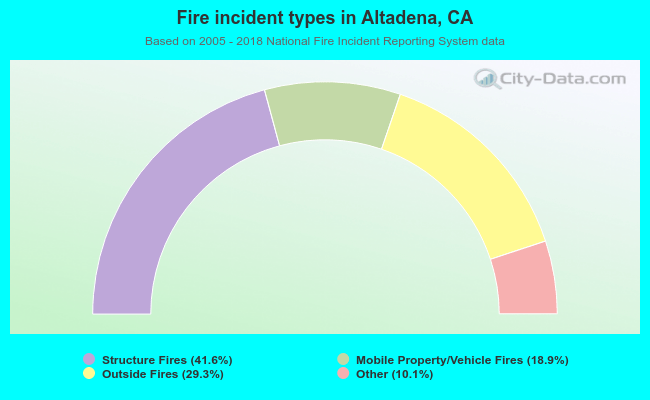 When looking into fire subcategories, the most incidents belonged to: Structure Fires (41.6%), and Outside Fires (29.3%).