Monrovia: Fire Incidents, California (CA)
Where are fire incidents reported in Monrovia, CA
Something went wrong! Please refresh the page.
| Fire incidents reported | |
|---|---|
| Sreet name | Count |
| HUNTINGTON DR | 144 |
| DUARTE RD | 100 |
| WB 210 FWY | 66 |
| MYRTLE AVE | 64 |
| OLIVE AVE | 50 |
| COLORADO BL | 48 |
| CALIFORNIA AVE | 46 |
| EB 210 FWY | 44 |
| FOOTHILL BL | 36 |
| MOUNTAIN AVE | 30 |
| NORUMBEGA DR | 28 |
| PECK RD | 28 |
| HUNTINGTON | 26 |
| CALIFORNIA | 24 |
| FOOTHILL | 24 |
| ROYAL OAKS DR | 24 |
| WALNUT AVE | 24 |
| ALTA VISTA AVE | 22 |
| CENTRAL AVE | 22 |
| DUARTE | 22 |
| LIME AVE | 22 |
| MAGNOLIA AVE | 22 |
| MAYFLOWER AVE | 22 |
| MONTEREY AVE | 22 |
| LEMON AVE | 20 |
| PALM AVE | 20 |
| CANYON BL | 18 |
| ALAMITAS AVE | 16 |
| CHESTNUT AVE | 16 |
| EVERGREEN AVE | 16 |
2005 - 2018 National Fire Incident Reporting System (NFIRS) incidents
- Incident types reported to NFIRS in Monrovia, CA
- 7,93662.1%Rescue & EMS
- 1,2329.6%Hazardous Condition
- 1,0117.9%Fire
- 9547.5%Good Intent Call
- 8876.9%False Alarm
- 7165.6%Service Call
- 180.1%Overpressure Rupture
- Fire incident types reported to NFIRS in Monrovia, CA
- 46846.3%Structure Fires
- 30430.1%Outside Fires
- 18518.3%Mobile Property/Vehicle Fires
- 545.3%Other
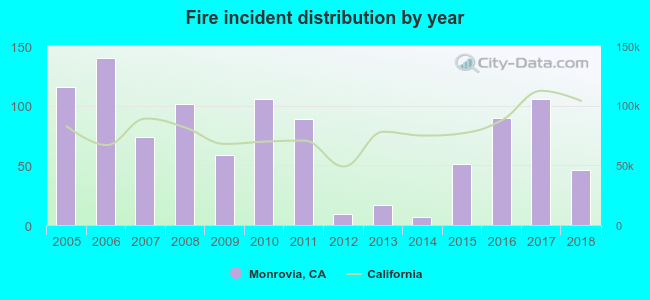 Based on the data from the years 2005 - 2018 the average number of fires per year is 72. The highest number of fires - 140 took place in 2006, and the least - 7 in 2014. The data has a declining trend.
The average number of yearly fire incidents per 10k residents in Monrovia, CA compared to nearest cities:
(Note: Based on data for the last 3 years, including only cities with population 5,000 and above)
| Monrovia: | 21.6 |
| Arcadia: | 12.9 |
| Duarte: | 13.0 |
| Sierra Madre: | 20.6 |
| Temple City: | 7.8 |
| Baldwin Park: | 8.9 |
| East San Gabriel: | 1.7 |
| El Monte: | 14.1 |
| Azusa: | 13.9 |
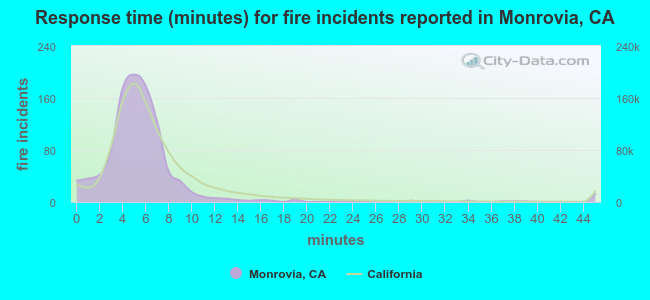 The median response time based on all reported fire incidents is 5 minutes. This is lower compared to the state median value.
The median response time in Monrovia, CA compared to nearest cities:
(Note: Based on data for all years, including only cities with at least 500 fire incidents)
| Monrovia: | 5 minutes |
| Arcadia: | 5 minutes |
| Baldwin Park: | 5 minutes |
| El Monte: | 4 minutes |
| Azusa: | 5 minutes |
| Rosemead: | 4 minutes |
| Pasadena: | 5 minutes |
| West Covina: | 6 minutes |
| Covina: | 4 minutes |
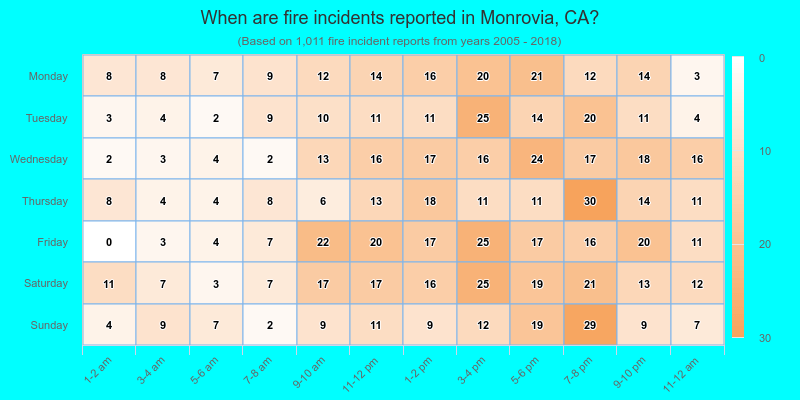
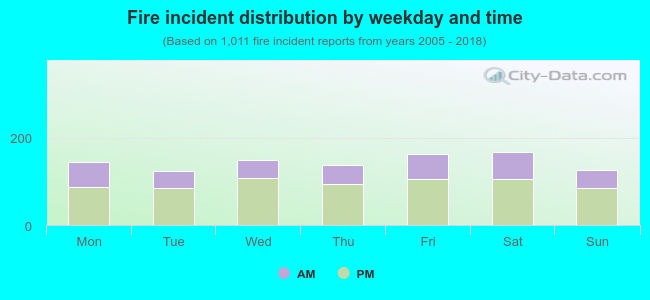 33.6% incidents where reported in the morning and 66.4% in the evening. The most fires (16.6%) took place on Saturday, and the least (12.3%) on Tuesday.
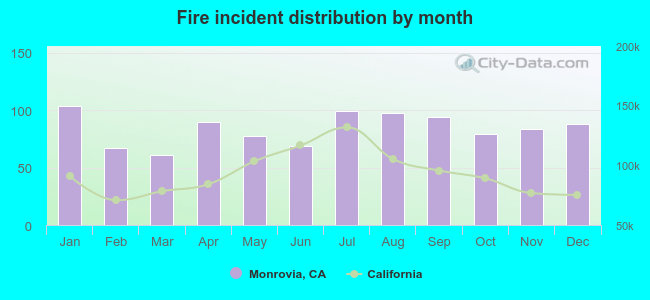 Based on the 1,011 incident reports from years 2005 - 2018 most fires (10.3%) took place during January, and the least (6.0%) in March.
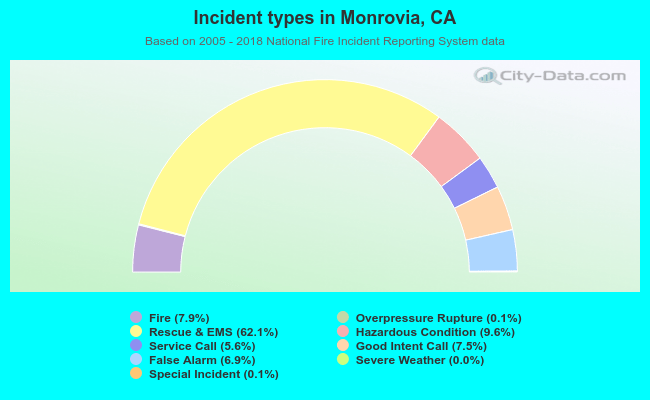 Out of all 12,770 cases reported during the years 2005 - 2018, the most belonged to the categories: Rescue & EMS (62.1%), Hazardous Condition (9.6%), and Fire (7.9%).
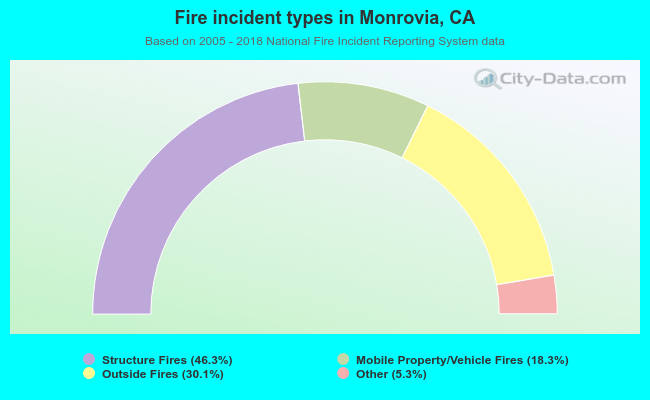 When looking into fire subcategories, the most incidents belonged to: Structure Fires (46.3%), and Outside Fires (30.1%).