Monrovia, California Submit your own pictures of this city and show them to the world
OSM Map
General Map
Google Map
MSN Map
OSM Map
General Map
Google Map
MSN Map
OSM Map
General Map
Google Map
MSN Map
OSM Map
General Map
Google Map
MSN Map
Please wait while loading the map...
Population in 2022: 36,893 (99% urban, 1% rural). Population change since 2000: -0.1%Males: 17,971 Females: 18,922
March 2022 cost of living index in Monrovia: 141.7 (very high, U.S. average is 100) Percentage of residents living in poverty in 2022: 10.1%for White Non-Hispanic residents , 11.4% for Black residents , 11.3% for Hispanic or Latino residents , 5.3% for American Indian residents , 8.5% for other race residents , 7.9% for two or more races residents )
Profiles of local businesses
Business Search - 14 Million verified businesses
Data:
Median household income ($)
Median household income (% change since 2000)
Household income diversity
Ratio of average income to average house value (%)
Ratio of average income to average rent
Median household income ($) - White
Median household income ($) - Black or African American
Median household income ($) - Asian
Median household income ($) - Hispanic or Latino
Median household income ($) - American Indian and Alaska Native
Median household income ($) - Multirace
Median household income ($) - Other Race
Median household income for houses/condos with a mortgage ($)
Median household income for apartments without a mortgage ($)
Races - White alone (%)
Races - White alone (% change since 2000)
Races - Black alone (%)
Races - Black alone (% change since 2000)
Races - American Indian alone (%)
Races - American Indian alone (% change since 2000)
Races - Asian alone (%)
Races - Asian alone (% change since 2000)
Races - Hispanic (%)
Races - Hispanic (% change since 2000)
Races - Native Hawaiian and Other Pacific Islander alone (%)
Races - Native Hawaiian and Other Pacific Islander alone (% change since 2000)
Races - Two or more races (%)
Races - Two or more races (% change since 2000)
Races - Other race alone (%)
Races - Other race alone (% change since 2000)
Racial diversity
Unemployment (%)
Unemployment (% change since 2000)
Unemployment (%) - White
Unemployment (%) - Black or African American
Unemployment (%) - Asian
Unemployment (%) - Hispanic or Latino
Unemployment (%) - American Indian and Alaska Native
Unemployment (%) - Multirace
Unemployment (%) - Other Race
Population density (people per square mile)
Population - Males (%)
Population - Females (%)
Population - Males (%) - White
Population - Males (%) - Black or African American
Population - Males (%) - Asian
Population - Males (%) - Hispanic or Latino
Population - Males (%) - American Indian and Alaska Native
Population - Males (%) - Multirace
Population - Males (%) - Other Race
Population - Females (%) - White
Population - Females (%) - Black or African American
Population - Females (%) - Asian
Population - Females (%) - Hispanic or Latino
Population - Females (%) - American Indian and Alaska Native
Population - Females (%) - Multirace
Population - Females (%) - Other Race
Coronavirus confirmed cases (May 08, 2024)
Deaths caused by coronavirus (May 08, 2024)
Coronavirus confirmed cases (per 100k population) (May 08, 2024)
Deaths caused by coronavirus (per 100k population) (May 08, 2024)
Daily increase in number of cases (May 08, 2024)
Weekly increase in number of cases (May 08, 2024)
Cases doubled (in days) (May 08, 2024)
Hospitalized patients (Apr 18, 2022)
Negative test results (Apr 18, 2022)
Total test results (Apr 18, 2022)
COVID Vaccine doses distributed (per 100k population) (Sep 19, 2023)
COVID Vaccine doses administered (per 100k population) (Sep 19, 2023)
COVID Vaccine doses distributed (Sep 19, 2023)
COVID Vaccine doses administered (Sep 19, 2023)
Likely homosexual households (%)
Likely homosexual households (% change since 2000)
Likely homosexual households - Lesbian couples (%)
Likely homosexual households - Lesbian couples (% change since 2000)
Likely homosexual households - Gay men (%)
Likely homosexual households - Gay men (% change since 2000)
Cost of living index
Median gross rent ($)
Median contract rent ($)
Median monthly housing costs ($)
Median house or condo value ($)
Median house or condo value ($ change since 2000)
Mean house or condo value by units in structure - 1, detached ($)
Mean house or condo value by units in structure - 1, attached ($)
Mean house or condo value by units in structure - 2 ($)
Mean house or condo value by units in structure by units in structure - 3 or 4 ($)
Mean house or condo value by units in structure - 5 or more ($)
Mean house or condo value by units in structure - Boat, RV, van, etc. ($)
Mean house or condo value by units in structure - Mobile home ($)
Median house or condo value ($) - White
Median house or condo value ($) - Black or African American
Median house or condo value ($) - Asian
Median house or condo value ($) - Hispanic or Latino
Median house or condo value ($) - American Indian and Alaska Native
Median house or condo value ($) - Multirace
Median house or condo value ($) - Other Race
Median resident age
Resident age diversity
Median resident age - Males
Median resident age - Females
Median resident age - White
Median resident age - Black or African American
Median resident age - Asian
Median resident age - Hispanic or Latino
Median resident age - American Indian and Alaska Native
Median resident age - Multirace
Median resident age - Other Race
Median resident age - Males - White
Median resident age - Males - Black or African American
Median resident age - Males - Asian
Median resident age - Males - Hispanic or Latino
Median resident age - Males - American Indian and Alaska Native
Median resident age - Males - Multirace
Median resident age - Males - Other Race
Median resident age - Females - White
Median resident age - Females - Black or African American
Median resident age - Females - Asian
Median resident age - Females - Hispanic or Latino
Median resident age - Females - American Indian and Alaska Native
Median resident age - Females - Multirace
Median resident age - Females - Other Race
Commute - mean travel time to work (minutes)
Travel time to work - Less than 5 minutes (%)
Travel time to work - Less than 5 minutes (% change since 2000)
Travel time to work - 5 to 9 minutes (%)
Travel time to work - 5 to 9 minutes (% change since 2000)
Travel time to work - 10 to 19 minutes (%)
Travel time to work - 10 to 19 minutes (% change since 2000)
Travel time to work - 20 to 29 minutes (%)
Travel time to work - 20 to 29 minutes (% change since 2000)
Travel time to work - 30 to 39 minutes (%)
Travel time to work - 30 to 39 minutes (% change since 2000)
Travel time to work - 40 to 59 minutes (%)
Travel time to work - 40 to 59 minutes (% change since 2000)
Travel time to work - 60 to 89 minutes (%)
Travel time to work - 60 to 89 minutes (% change since 2000)
Travel time to work - 90 or more minutes (%)
Travel time to work - 90 or more minutes (% change since 2000)
Marital status - Never married (%)
Marital status - Now married (%)
Marital status - Separated (%)
Marital status - Widowed (%)
Marital status - Divorced (%)
Median family income ($)
Median family income (% change since 2000)
Median non-family income ($)
Median non-family income (% change since 2000)
Median per capita income ($)
Median per capita income (% change since 2000)
Median family income ($) - White
Median family income ($) - Black or African American
Median family income ($) - Asian
Median family income ($) - Hispanic or Latino
Median family income ($) - American Indian and Alaska Native
Median family income ($) - Multirace
Median family income ($) - Other Race
Median year house/condo built
Median year apartment built
Year house built - Built 2005 or later (%)
Year house built - Built 2000 to 2004 (%)
Year house built - Built 1990 to 1999 (%)
Year house built - Built 1980 to 1989 (%)
Year house built - Built 1970 to 1979 (%)
Year house built - Built 1960 to 1969 (%)
Year house built - Built 1950 to 1959 (%)
Year house built - Built 1940 to 1949 (%)
Year house built - Built 1939 or earlier (%)
Average household size
Household density (households per square mile)
Average household size - White
Average household size - Black or African American
Average household size - Asian
Average household size - Hispanic or Latino
Average household size - American Indian and Alaska Native
Average household size - Multirace
Average household size - Other Race
Occupied housing units (%)
Vacant housing units (%)
Owner occupied housing units (%)
Renter occupied housing units (%)
Vacancy status - For rent (%)
Vacancy status - For sale only (%)
Vacancy status - Rented or sold, not occupied (%)
Vacancy status - For seasonal, recreational, or occasional use (%)
Vacancy status - For migrant workers (%)
Vacancy status - Other vacant (%)
Residents with income below the poverty level (%)
Residents with income below 50% of the poverty level (%)
Children below poverty level (%)
Poor families by family type - Married-couple family (%)
Poor families by family type - Male, no wife present (%)
Poor families by family type - Female, no husband present (%)
Poverty status for native-born residents (%)
Poverty status for foreign-born residents (%)
Poverty among high school graduates not in families (%)
Poverty among people who did not graduate high school not in families (%)
Residents with income below the poverty level (%) - White
Residents with income below the poverty level (%) - Black or African American
Residents with income below the poverty level (%) - Asian
Residents with income below the poverty level (%) - Hispanic or Latino
Residents with income below the poverty level (%) - American Indian and Alaska Native
Residents with income below the poverty level (%) - Multirace
Residents with income below the poverty level (%) - Other Race
Air pollution - Air Quality Index (AQI)
Air pollution - CO
Air pollution - NO2
Air pollution - SO2
Air pollution - Ozone
Air pollution - PM10
Air pollution - PM25
Air pollution - Pb
Crime - Murders per 100,000 population
Crime - Rapes per 100,000 population
Crime - Robberies per 100,000 population
Crime - Assaults per 100,000 population
Crime - Burglaries per 100,000 population
Crime - Thefts per 100,000 population
Crime - Auto thefts per 100,000 population
Crime - Arson per 100,000 population
Crime - City-data.com crime index
Crime - Violent crime index
Crime - Property crime index
Crime - Murders per 100,000 population (5 year average)
Crime - Rapes per 100,000 population (5 year average)
Crime - Robberies per 100,000 population (5 year average)
Crime - Assaults per 100,000 population (5 year average)
Crime - Burglaries per 100,000 population (5 year average)
Crime - Thefts per 100,000 population (5 year average)
Crime - Auto thefts per 100,000 population (5 year average)
Crime - Arson per 100,000 population (5 year average)
Crime - City-data.com crime index (5 year average)
Crime - Violent crime index (5 year average)
Crime - Property crime index (5 year average)
1996 Presidential Elections Results (%) - Democratic Party (Clinton)
1996 Presidential Elections Results (%) - Republican Party (Dole)
1996 Presidential Elections Results (%) - Other
2000 Presidential Elections Results (%) - Democratic Party (Gore)
2000 Presidential Elections Results (%) - Republican Party (Bush)
2000 Presidential Elections Results (%) - Other
2004 Presidential Elections Results (%) - Democratic Party (Kerry)
2004 Presidential Elections Results (%) - Republican Party (Bush)
2004 Presidential Elections Results (%) - Other
2008 Presidential Elections Results (%) - Democratic Party (Obama)
2008 Presidential Elections Results (%) - Republican Party (McCain)
2008 Presidential Elections Results (%) - Other
2012 Presidential Elections Results (%) - Democratic Party (Obama)
2012 Presidential Elections Results (%) - Republican Party (Romney)
2012 Presidential Elections Results (%) - Other
2016 Presidential Elections Results (%) - Democratic Party (Clinton)
2016 Presidential Elections Results (%) - Republican Party (Trump)
2016 Presidential Elections Results (%) - Other
2020 Presidential Elections Results (%) - Democratic Party (Biden)
2020 Presidential Elections Results (%) - Republican Party (Trump)
2020 Presidential Elections Results (%) - Other
Ancestries Reported - Arab (%)
Ancestries Reported - Czech (%)
Ancestries Reported - Danish (%)
Ancestries Reported - Dutch (%)
Ancestries Reported - English (%)
Ancestries Reported - French (%)
Ancestries Reported - French Canadian (%)
Ancestries Reported - German (%)
Ancestries Reported - Greek (%)
Ancestries Reported - Hungarian (%)
Ancestries Reported - Irish (%)
Ancestries Reported - Italian (%)
Ancestries Reported - Lithuanian (%)
Ancestries Reported - Norwegian (%)
Ancestries Reported - Polish (%)
Ancestries Reported - Portuguese (%)
Ancestries Reported - Russian (%)
Ancestries Reported - Scotch-Irish (%)
Ancestries Reported - Scottish (%)
Ancestries Reported - Slovak (%)
Ancestries Reported - Subsaharan African (%)
Ancestries Reported - Swedish (%)
Ancestries Reported - Swiss (%)
Ancestries Reported - Ukrainian (%)
Ancestries Reported - United States (%)
Ancestries Reported - Welsh (%)
Ancestries Reported - West Indian (%)
Ancestries Reported - Other (%)
Educational Attainment - No schooling completed (%)
Educational Attainment - Less than high school (%)
Educational Attainment - High school or equivalent (%)
Educational Attainment - Less than 1 year of college (%)
Educational Attainment - 1 or more years of college (%)
Educational Attainment - Associate degree (%)
Educational Attainment - Bachelor's degree (%)
Educational Attainment - Master's degree (%)
Educational Attainment - Professional school degree (%)
Educational Attainment - Doctorate degree (%)
School Enrollment - Nursery, preschool (%)
School Enrollment - Kindergarten (%)
School Enrollment - Grade 1 to 4 (%)
School Enrollment - Grade 5 to 8 (%)
School Enrollment - Grade 9 to 12 (%)
School Enrollment - College undergrad (%)
School Enrollment - Graduate or professional (%)
School Enrollment - Not enrolled in school (%)
School enrollment - Public schools (%)
School enrollment - Private schools (%)
School enrollment - Not enrolled (%)
Median number of rooms in houses and condos
Median number of rooms in apartments
Housing units lacking complete plumbing facilities (%)
Housing units lacking complete kitchen facilities (%)
Density of houses
Urban houses (%)
Rural houses (%)
Households with people 60 years and over (%)
Households with people 65 years and over (%)
Households with people 75 years and over (%)
Households with one or more nonrelatives (%)
Households with no nonrelatives (%)
Population in households (%)
Family households (%)
Nonfamily households (%)
Population in families (%)
Family households with own children (%)
Median number of bedrooms in owner occupied houses
Mean number of bedrooms in owner occupied houses
Median number of bedrooms in renter occupied houses
Mean number of bedrooms in renter occupied houses
Median number of vehichles in owner occupied houses
Mean number of vehichles in owner occupied houses
Median number of vehichles in renter occupied houses
Mean number of vehichles in renter occupied houses
Mortgage status - with mortgage (%)
Mortgage status - with second mortgage (%)
Mortgage status - with home equity loan (%)
Mortgage status - with both second mortgage and home equity loan (%)
Mortgage status - without a mortgage (%)
Average family size
Average family size - White
Average family size - Black or African American
Average family size - Asian
Average family size - Hispanic or Latino
Average family size - American Indian and Alaska Native
Average family size - Multirace
Average family size - Other Race
Geographical mobility - Same house 1 year ago (%)
Geographical mobility - Moved within same county (%)
Geographical mobility - Moved from different county within same state (%)
Geographical mobility - Moved from different state (%)
Geographical mobility - Moved from abroad (%)
Place of birth - Born in state of residence (%)
Place of birth - Born in other state (%)
Place of birth - Native, outside of US (%)
Place of birth - Foreign born (%)
Housing units in structures - 1, detached (%)
Housing units in structures - 1, attached (%)
Housing units in structures - 2 (%)
Housing units in structures - 3 or 4 (%)
Housing units in structures - 5 to 9 (%)
Housing units in structures - 10 to 19 (%)
Housing units in structures - 20 to 49 (%)
Housing units in structures - 50 or more (%)
Housing units in structures - Mobile home (%)
Housing units in structures - Boat, RV, van, etc. (%)
House/condo owner moved in on average (years ago)
Renter moved in on average (years ago)
Year householder moved into unit - Moved in 1999 to March 2000 (%)
Year householder moved into unit - Moved in 1995 to 1998 (%)
Year householder moved into unit - Moved in 1990 to 1994 (%)
Year householder moved into unit - Moved in 1980 to 1989 (%)
Year householder moved into unit - Moved in 1970 to 1979 (%)
Year householder moved into unit - Moved in 1969 or earlier (%)
Means of transportation to work - Drove car alone (%)
Means of transportation to work - Carpooled (%)
Means of transportation to work - Public transportation (%)
Means of transportation to work - Bus or trolley bus (%)
Means of transportation to work - Streetcar or trolley car (%)
Means of transportation to work - Subway or elevated (%)
Means of transportation to work - Railroad (%)
Means of transportation to work - Ferryboat (%)
Means of transportation to work - Taxicab (%)
Means of transportation to work - Motorcycle (%)
Means of transportation to work - Bicycle (%)
Means of transportation to work - Walked (%)
Means of transportation to work - Other means (%)
Working at home (%)
Industry diversity
Most Common Industries - Agriculture, forestry, fishing and hunting, and mining (%)
Most Common Industries - Agriculture, forestry, fishing and hunting (%)
Most Common Industries - Mining, quarrying, and oil and gas extraction (%)
Most Common Industries - Construction (%)
Most Common Industries - Manufacturing (%)
Most Common Industries - Wholesale trade (%)
Most Common Industries - Retail trade (%)
Most Common Industries - Transportation and warehousing, and utilities (%)
Most Common Industries - Transportation and warehousing (%)
Most Common Industries - Utilities (%)
Most Common Industries - Information (%)
Most Common Industries - Finance and insurance, and real estate and rental and leasing (%)
Most Common Industries - Finance and insurance (%)
Most Common Industries - Real estate and rental and leasing (%)
Most Common Industries - Professional, scientific, and management, and administrative and waste management services (%)
Most Common Industries - Professional, scientific, and technical services (%)
Most Common Industries - Management of companies and enterprises (%)
Most Common Industries - Administrative and support and waste management services (%)
Most Common Industries - Educational services, and health care and social assistance (%)
Most Common Industries - Educational services (%)
Most Common Industries - Health care and social assistance (%)
Most Common Industries - Arts, entertainment, and recreation, and accommodation and food services (%)
Most Common Industries - Arts, entertainment, and recreation (%)
Most Common Industries - Accommodation and food services (%)
Most Common Industries - Other services, except public administration (%)
Most Common Industries - Public administration (%)
Occupation diversity
Most Common Occupations - Management, business, science, and arts occupations (%)
Most Common Occupations - Management, business, and financial occupations (%)
Most Common Occupations - Management occupations (%)
Most Common Occupations - Business and financial operations occupations (%)
Most Common Occupations - Computer, engineering, and science occupations (%)
Most Common Occupations - Computer and mathematical occupations (%)
Most Common Occupations - Architecture and engineering occupations (%)
Most Common Occupations - Life, physical, and social science occupations (%)
Most Common Occupations - Education, legal, community service, arts, and media occupations (%)
Most Common Occupations - Community and social service occupations (%)
Most Common Occupations - Legal occupations (%)
Most Common Occupations - Education, training, and library occupations (%)
Most Common Occupations - Arts, design, entertainment, sports, and media occupations (%)
Most Common Occupations - Healthcare practitioners and technical occupations (%)
Most Common Occupations - Health diagnosing and treating practitioners and other technical occupations (%)
Most Common Occupations - Health technologists and technicians (%)
Most Common Occupations - Service occupations (%)
Most Common Occupations - Healthcare support occupations (%)
Most Common Occupations - Protective service occupations (%)
Most Common Occupations - Fire fighting and prevention, and other protective service workers including supervisors (%)
Most Common Occupations - Law enforcement workers including supervisors (%)
Most Common Occupations - Food preparation and serving related occupations (%)
Most Common Occupations - Building and grounds cleaning and maintenance occupations (%)
Most Common Occupations - Personal care and service occupations (%)
Most Common Occupations - Sales and office occupations (%)
Most Common Occupations - Sales and related occupations (%)
Most Common Occupations - Office and administrative support occupations (%)
Most Common Occupations - Natural resources, construction, and maintenance occupations (%)
Most Common Occupations - Farming, fishing, and forestry occupations (%)
Most Common Occupations - Construction and extraction occupations (%)
Most Common Occupations - Installation, maintenance, and repair occupations (%)
Most Common Occupations - Production, transportation, and material moving occupations (%)
Most Common Occupations - Production occupations (%)
Most Common Occupations - Transportation occupations (%)
Most Common Occupations - Material moving occupations (%)
People in Group quarters - Institutionalized population (%)
People in Group quarters - Correctional institutions (%)
People in Group quarters - Federal prisons and detention centers (%)
People in Group quarters - Halfway houses (%)
People in Group quarters - Local jails and other confinement facilities (including police lockups) (%)
People in Group quarters - Military disciplinary barracks (%)
People in Group quarters - State prisons (%)
People in Group quarters - Other types of correctional institutions (%)
People in Group quarters - Nursing homes (%)
People in Group quarters - Hospitals/wards, hospices, and schools for the handicapped (%)
People in Group quarters - Hospitals/wards and hospices for chronically ill (%)
People in Group quarters - Hospices or homes for chronically ill (%)
People in Group quarters - Military hospitals or wards for chronically ill (%)
People in Group quarters - Other hospitals or wards for chronically ill (%)
People in Group quarters - Hospitals or wards for drug/alcohol abuse (%)
People in Group quarters - Mental (Psychiatric) hospitals or wards (%)
People in Group quarters - Schools, hospitals, or wards for the mentally retarded (%)
People in Group quarters - Schools, hospitals, or wards for the physically handicapped (%)
People in Group quarters - Institutions for the deaf (%)
People in Group quarters - Institutions for the blind (%)
People in Group quarters - Orthopedic wards and institutions for the physically handicapped (%)
People in Group quarters - Wards in general hospitals for patients who have no usual home elsewhere (%)
People in Group quarters - Wards in military hospitals for patients who have no usual home elsewhere (%)
People in Group quarters - Juvenile institutions (%)
People in Group quarters - Long-term care (%)
People in Group quarters - Homes for abused, dependent, and neglected children (%)
People in Group quarters - Residential treatment centers for emotionally disturbed children (%)
People in Group quarters - Training schools for juvenile delinquents (%)
People in Group quarters - Short-term care, detention or diagnostic centers for delinquent children (%)
People in Group quarters - Type of juvenile institution unknown (%)
People in Group quarters - Noninstitutionalized population (%)
People in Group quarters - College dormitories (includes college quarters off campus) (%)
People in Group quarters - Military quarters (%)
People in Group quarters - On base (%)
People in Group quarters - Barracks, unaccompanied personnel housing (UPH), (Enlisted/Officer), ;and similar group living quarters for military personnel (%)
People in Group quarters - Transient quarters for temporary residents (%)
People in Group quarters - Military ships (%)
People in Group quarters - Group homes (%)
People in Group quarters - Homes or halfway houses for drug/alcohol abuse (%)
People in Group quarters - Homes for the mentally ill (%)
People in Group quarters - Homes for the mentally retarded (%)
People in Group quarters - Homes for the physically handicapped (%)
People in Group quarters - Other group homes (%)
People in Group quarters - Religious group quarters (%)
People in Group quarters - Dormitories (%)
People in Group quarters - Agriculture workers' dormitories on farms (%)
People in Group quarters - Job Corps and vocational training facilities (%)
People in Group quarters - Other workers' dormitories (%)
People in Group quarters - Crews of maritime vessels (%)
People in Group quarters - Other nonhousehold living situations (%)
People in Group quarters - Other noninstitutional group quarters (%)
Residents speaking English at home (%)
Residents speaking English at home - Born in the United States (%)
Residents speaking English at home - Native, born elsewhere (%)
Residents speaking English at home - Foreign born (%)
Residents speaking Spanish at home (%)
Residents speaking Spanish at home - Born in the United States (%)
Residents speaking Spanish at home - Native, born elsewhere (%)
Residents speaking Spanish at home - Foreign born (%)
Residents speaking other language at home (%)
Residents speaking other language at home - Born in the United States (%)
Residents speaking other language at home - Native, born elsewhere (%)
Residents speaking other language at home - Foreign born (%)
Class of Workers - Employee of private company (%)
Class of Workers - Self-employed in own incorporated business (%)
Class of Workers - Private not-for-profit wage and salary workers (%)
Class of Workers - Local government workers (%)
Class of Workers - State government workers (%)
Class of Workers - Federal government workers (%)
Class of Workers - Self-employed workers in own not incorporated business and Unpaid family workers (%)
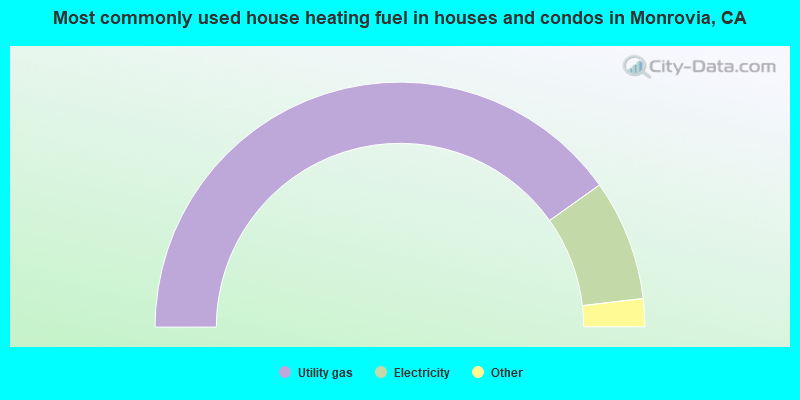
House heating fuel used in houses and condos - Utility gas (%)
House heating fuel used in houses and condos - Bottled, tank, or LP gas (%)
House heating fuel used in houses and condos - Electricity (%)
House heating fuel used in houses and condos - Fuel oil, kerosene, etc. (%)
House heating fuel used in houses and condos - Coal or coke (%)
House heating fuel used in houses and condos - Wood (%)
House heating fuel used in houses and condos - Solar energy (%)
House heating fuel used in houses and condos - Other fuel (%)
House heating fuel used in houses and condos - No fuel used (%)
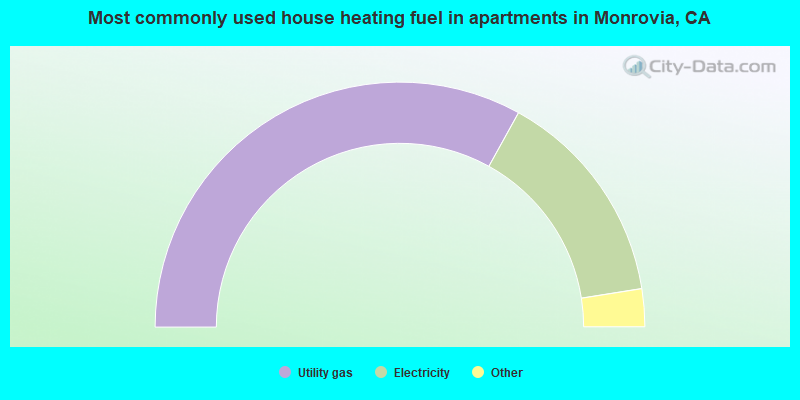
House heating fuel used in apartments - Utility gas (%)
House heating fuel used in apartments - Bottled, tank, or LP gas (%)
House heating fuel used in apartments - Electricity (%)
House heating fuel used in apartments - Fuel oil, kerosene, etc. (%)
House heating fuel used in apartments - Coal or coke (%)
House heating fuel used in apartments - Wood (%)
House heating fuel used in apartments - Solar energy (%)
House heating fuel used in apartments - Other fuel (%)
House heating fuel used in apartments - No fuel used (%)
Armed forces status - In Armed Forces (%)
Armed forces status - Civilian (%)
Armed forces status - Civilian - Veteran (%)
Armed forces status - Civilian - Nonveteran (%)
Fatal accidents locations in years 2005-2021
Fatal accidents locations in 2005
Fatal accidents locations in 2006
Fatal accidents locations in 2007
Fatal accidents locations in 2008
Fatal accidents locations in 2009
Fatal accidents locations in 2010
Fatal accidents locations in 2011
Fatal accidents locations in 2012
Fatal accidents locations in 2013
Fatal accidents locations in 2014
Fatal accidents locations in 2015
Fatal accidents locations in 2016
Fatal accidents locations in 2017
Fatal accidents locations in 2018
Fatal accidents locations in 2019
Fatal accidents locations in 2020
Fatal accidents locations in 2021
Alcohol use - People drinking some alcohol every month (%)
Alcohol use - People not drinking at all (%)
Alcohol use - Average days/month drinking alcohol
Alcohol use - Average drinks/week
Alcohol use - Average days/year people drink much
Audiometry - Average condition of hearing (%)
Audiometry - People that can hear a whisper from across a quiet room (%)
Audiometry - People that can hear normal voice from across a quiet room (%)
Audiometry - Ears ringing, roaring, buzzing (%)
Audiometry - Had a job exposure to loud noise (%)
Audiometry - Had off-work exposure to loud noise (%)
Blood Pressure & Cholesterol - Has high blood pressure (%)
Blood Pressure & Cholesterol - Checking blood pressure at home (%)
Blood Pressure & Cholesterol - Frequently checking blood cholesterol (%)
Blood Pressure & Cholesterol - Has high cholesterol level (%)
Consumer Behavior - Money monthly spent on food at supermarket/grocery store
Consumer Behavior - Money monthly spent on food at other stores
Consumer Behavior - Money monthly spent on eating out
Consumer Behavior - Money monthly spent on carryout/delivered foods
Consumer Behavior - Income spent on food at supermarket/grocery store (%)
Consumer Behavior - Income spent on food at other stores (%)
Consumer Behavior - Income spent on eating out (%)
Consumer Behavior - Income spent on carryout/delivered foods (%)
Current Health Status - General health condition (%)
Current Health Status - Blood donors (%)
Current Health Status - Has blood ever tested for HIV virus (%)
Current Health Status - Left-handed people (%)
Dermatology - People using sunscreen (%)
Diabetes - Diabetics (%)
Diabetes - Had a blood test for high blood sugar (%)
Diabetes - People taking insulin (%)
Diet Behavior & Nutrition - Diet health (%)
Diet Behavior & Nutrition - Milk product consumption (# of products/month)
Diet Behavior & Nutrition - Meals not home prepared (#/week)
Diet Behavior & Nutrition - Meals from fast food or pizza place (#/week)
Diet Behavior & Nutrition - Ready-to-eat foods (#/month)
Diet Behavior & Nutrition - Frozen meals/pizza (#/month)
Drug Use - People that ever used marijuana or hashish (%)
Drug Use - Ever used hard drugs (%)
Drug Use - Ever used any form of cocaine (%)
Drug Use - Ever used heroin (%)
Drug Use - Ever used methamphetamine (%)
Health Insurance - People covered by health insurance (%)
Kidney Conditions-Urology - Avg. # of times urinating at night
Medical Conditions - People with asthma (%)
Medical Conditions - People with anemia (%)
Medical Conditions - People with psoriasis (%)
Medical Conditions - People with overweight (%)
Medical Conditions - Elderly people having difficulties in thinking or remembering (%)
Medical Conditions - People who ever received blood transfusion (%)
Medical Conditions - People having trouble seeing even with glass/contacts (%)
Medical Conditions - People with arthritis (%)
Medical Conditions - People with gout (%)
Medical Conditions - People with congestive heart failure (%)
Medical Conditions - People with coronary heart disease (%)
Medical Conditions - People with angina pectoris (%)
Medical Conditions - People who ever had heart attack (%)
Medical Conditions - People who ever had stroke (%)
Medical Conditions - People with emphysema (%)
Medical Conditions - People with thyroid problem (%)
Medical Conditions - People with chronic bronchitis (%)
Medical Conditions - People with any liver condition (%)
Medical Conditions - People who ever had cancer or malignancy (%)
Mental Health - People who have little interest in doing things (%)
Mental Health - People feeling down, depressed, or hopeless (%)
Mental Health - People who have trouble sleeping or sleeping too much (%)
Mental Health - People feeling tired or having little energy (%)
Mental Health - People with poor appetite or overeating (%)
Mental Health - People feeling bad about themself (%)
Mental Health - People who have trouble concentrating on things (%)
Mental Health - People moving or speaking slowly or too fast (%)
Mental Health - People having thoughts they would be better off dead (%)
Oral Health - Average years since last visit a dentist
Oral Health - People embarrassed because of mouth (%)
Oral Health - People with gum disease (%)
Oral Health - General health of teeth and gums (%)
Oral Health - Average days a week using dental floss/device
Oral Health - Average days a week using mouthwash for dental problem
Oral Health - Average number of teeth
Pesticide Use - Households using pesticides to control insects (%)
Pesticide Use - Households using pesticides to kill weeds (%)
Physical Activity - People doing vigorous-intensity work activities (%)
Physical Activity - People doing moderate-intensity work activities (%)
Physical Activity - People walking or bicycling (%)
Physical Activity - People doing vigorous-intensity recreational activities (%)
Physical Activity - People doing moderate-intensity recreational activities (%)
Physical Activity - Average hours a day doing sedentary activities
Physical Activity - Average hours a day watching TV or videos
Physical Activity - Average hours a day using computer
Physical Functioning - People having limitations keeping them from working (%)
Physical Functioning - People limited in amount of work they can do (%)
Physical Functioning - People that need special equipment to walk (%)
Physical Functioning - People experiencing confusion/memory problems (%)
Physical Functioning - People requiring special healthcare equipment (%)
Prescription Medications - Average number of prescription medicines taking
Preventive Aspirin Use - Adults 40+ taking low-dose aspirin (%)
Reproductive Health - Vaginal deliveries (%)
Reproductive Health - Cesarean deliveries (%)
Reproductive Health - Deliveries resulted in a live birth (%)
Reproductive Health - Pregnancies resulted in a delivery (%)
Reproductive Health - Women breastfeeding newborns (%)
Reproductive Health - Women that had a hysterectomy (%)
Reproductive Health - Women that had both ovaries removed (%)
Reproductive Health - Women that have ever taken birth control pills (%)
Reproductive Health - Women taking birth control pills (%)
Reproductive Health - Women that have ever used Depo-Provera or injectables (%)
Reproductive Health - Women that have ever used female hormones (%)
Sexual Behavior - People 18+ that ever had sex (vaginal, anal, or oral) (%)
Sexual Behavior - Males 18+ that ever had vaginal sex with a woman (%)
Sexual Behavior - Males 18+ that ever performed oral sex on a woman (%)
Sexual Behavior - Males 18+ that ever had anal sex with a woman (%)
Sexual Behavior - Males 18+ that ever had any sex with a man (%)
Sexual Behavior - Females 18+ that ever had vaginal sex with a man (%)
Sexual Behavior - Females 18+ that ever performed oral sex on a man (%)
Sexual Behavior - Females 18+ that ever had anal sex with a man (%)
Sexual Behavior - Females 18+ that ever had any kind of sex with a woman (%)
Sexual Behavior - Average age people first had sex
Sexual Behavior - Average number of female sex partners in lifetime (males 18+)
Sexual Behavior - Average number of female vaginal sex partners in lifetime (males 18+)
Sexual Behavior - Average age people first performed oral sex on a woman (18+)
Sexual Behavior - Average number of woman performed oral sex on in lifetime (18+)
Sexual Behavior - Average number of male sex partners in lifetime (males 18+)
Sexual Behavior - Average number of male anal sex partners in lifetime (males 18+)
Sexual Behavior - Average age people first performed oral sex on a man (18+)
Sexual Behavior - Average number of male oral sex partners in lifetime (18+)
Sexual Behavior - People using protection when performing oral sex (%)
Sexual Behavior - Average number of times people have vaginal or anal sex a year
Sexual Behavior - People having sex without condom (%)
Sexual Behavior - Average number of male sex partners in lifetime (females 18+)
Sexual Behavior - Average number of male vaginal sex partners in lifetime (females 18+)
Sexual Behavior - Average number of female sex partners in lifetime (females 18+)
Sexual Behavior - Circumcised males 18+ (%)
Sleep Disorders - Average hours sleeping at night
Sleep Disorders - People that has trouble sleeping (%)
Smoking-Cigarette Use - People smoking cigarettes (%)
Taste & Smell - People 40+ having problems with smell (%)
Taste & Smell - People 40+ having problems with taste (%)
Taste & Smell - People 40+ that ever had wisdom teeth removed (%)
Taste & Smell - People 40+ that ever had tonsils teeth removed (%)
Taste & Smell - People 40+ that ever had a loss of consciousness because of a head injury (%)
Taste & Smell - People 40+ that ever had a broken nose or other serious injury to face or skull (%)
Taste & Smell - People 40+ that ever had two or more sinus infections (%)
Weight - Average height (inches)
Weight - Average weight (pounds)
Weight - Average BMI
Weight - People that are obese (%)
Weight - People that ever were obese (%)
Weight - People trying to lose weight (%)
16,736 45.4% Hispanic 10,495 28.5% White alone 5,456 14.8% Asian alone 1,979 5.4% Black alone 1,551 4.2% Two or more races 279 0.8% Native Hawaiian and Other 295 0.8% Other race alone 72 0.2% American Indian alone
According to our research of California and other state lists, there were 20 registered sex offenders living in Monrovia, California as of May 08, 2024 . The ratio of all residents to sex offenders in Monrovia is 1,869 to 1.The ratio of registered sex offenders to all residents in this city is much lower than the state average.
Officers per 1,000 residents here:
1.21California average:
2.30
Latest news from Monrovia, CA collected exclusively by city-data.com from local newspapers, TV, and radio stations
Ancestries: English (2.6%), Irish (2.1%), Italian (2.1%), German (1.9%), American (1.3%), European (1.3%).
Current Local Time:
Land area: 13.7 square miles.
Population density: 2,684 people per square mile (average).
9,235 residents are foreign born (12.7% Latin America , 10.4% Asia ).
This city:
25.1%California:
26.5%
Median real estate property taxes paid for housing units with mortgages in 2022: $6,561 (0.7%)Median real estate property taxes paid for housing units with no mortgage in 2022: $4,084 (0.5%)
Nearest city with pop. 50,000+: Arcadia, CA
Nearest city with pop. 200,000+: Upper San Gabriel Valley, CA (2.8 miles
Nearest city with pop. 1,000,000+: Los Angeles, CA
Nearest cities:
Latitude: 34.14 N, Longitude: 118.00 W
Daytime population change due to commuting: +791 (+2.1%)Workers who live and work in this city: 4,860 (25.3%)
Property values in Monrovia, CA
Single-family new house construction building permits:
2022: 55 buildings , average cost: $103,3002021: 37 buildings , average cost: $89,1002020: 24 buildings , average cost: $145,5002019: 18 buildings , average cost: $155,1002018: 24 buildings , average cost: $207,3002017: 26 buildings , average cost: $178,9002016: 17 buildings , average cost: $229,0002015: 5 buildings , average cost: $408,1002014: 34 buildings , average cost: $211,5002013: 24 buildings , average cost: $273,3002012: 18 buildings , average cost: $288,1002010: 8 buildings , average cost: $188,8002009: 4 buildings , average cost: $219,8002008: 18 buildings , average cost: $346,1002007: 55 buildings , average cost: $203,0002006: 51 buildings , average cost: $191,9002005: 90 buildings , average cost: $193,4002004: 35 buildings , average cost: $192,5002003: 38 buildings , average cost: $165,6002002: 37 buildings , average cost: $152,5002001: 47 buildings , average cost: $158,9002000: 56 buildings , average cost: $193,1001999: 81 buildings , average cost: $161,4001998: 77 buildings , average cost: $147,4001997: 36 buildings , average cost: $150,900Unemployment in December 2023:
Population change in the 1990s: +1,338 (+3.8%).
Most common occupations in Monrovia, CA (%)
Both Males Females
Other sales and related occupations, including supervisors (4.4%)
Other office and administrative support workers, including supervisors (4.3%)
Building and grounds cleaning and maintenance occupations (4.2%)
Secretaries and administrative assistants (4.1%)
Preschool, kindergarten, elementary, and middle school teachers (3.9%)
Other management occupations, except farmers and farm managers (3.8%)
Retail sales workers, except cashiers (2.7%)
Other sales and related occupations, including supervisors (5.3%)
Building and grounds cleaning and maintenance occupations (4.9%)
Other management occupations, except farmers and farm managers (4.4%)
Electrical equipment mechanics and other installation, maintenance, and repair workers, including supervisors (4.4%)
Driver/sales workers and truck drivers (4.2%)
Top executives (3.3%)
Material recording, scheduling, dispatching, and distributing workers (3.2%)
Secretaries and administrative assistants (8.1%)
Other office and administrative support workers, including supervisors (7.1%)
Preschool, kindergarten, elementary, and middle school teachers (5.9%)
Information and record clerks, except customer service representatives (4.6%)
Bookkeeping, accounting, and auditing clerks (3.7%)
Building and grounds cleaning and maintenance occupations (3.5%)
Other sales and related occupations, including supervisors (3.5%)
Earthquake activity:
Monrovia-area historical earthquake activity is significantly above California state average. It is 7208% greater than the overall U.S. average. On 7/21/1952 at 11:52:14, a magnitude 7.7 (7.7 UK, Class: Major, Intensity: VIII - XII) earthquake occurred 82.1 miles away from Monrovia center, causing $50,000,000 total damage On 6/28/1992 at 11:57:34, a magnitude 7.6 (6.2 MB, 7.6 MS, 7.3 MW, Depth: 0.7 mi) earthquake occurred 84.2 miles away from Monrovia center, causing 3 deaths ( 1 shaking deaths, 2 other deaths) and 400 injuries, causing $100,000,000 total damage and $40,000,000 insured lossesOn 10/16/1999 at 09:46:44, a magnitude 7.4 (6.3 MB, 7.4 MS, 7.2 MW, 7.3 ML) earthquake occurred 93.1 miles away from the city center On 11/4/1927 at 13:51:53, a magnitude 7.5 (7.5 UK) earthquake occurred 180.6 miles away from Monrovia center On 1/17/1994 at 12:30:55, a magnitude 6.8 (6.4 MB, 6.8 MS, 6.7 MW, Depth: 11.4 mi, Class: Strong, Intensity: VII - IX) earthquake occurred 32.8 miles away from Monrovia center, causing 60 deaths ( 60 shaking deaths) and 7000 injuriesOn 4/21/1918 at 22:32:30, a magnitude 6.8 (6.8 UK) earthquake occurred 39.6 miles away from Monrovia center Magnitude types: body-wave magnitude (MB), local magnitude (ML), surface-wave magnitude (MS), moment magnitude (MW) Natural disasters: The number of natural disasters in Los Angeles County (57) is a lot greater than the US average (15).Major Disasters (Presidential) Declared: 27Emergencies Declared: 3Fires: 37, Floods: 16, Storms: 9, Winter Storms: 6, Landslides: 5, Mudslides: 5, Earthquakes: 3, Freeze: 1, Heavy Rain: 1, Hurricane: 1, Snow: 1, Tornado: 1, Wind: 1, Other: 1 (Note: some incidents may be assigned to more than one category). Main business address for: SEEBEYOND TECHNOLOGY CORP SERVICES-PREPACKAGED SOFTWARE ), STAAR SURGICAL CO OPHTHALMIC GOODS ).
Hospitals and medical centers in Monrovia: COUNTRY VILLA MONROVIA HEALTHCARE CENTER (615 W. DUARTE RD.)
MOUNTAIN VIEW DIALYSIS CENTER, INC. (900 S. MOUNTAIN AVENUE)
MODERN HEALTH (604 E HUNTINGTON DR)
Amtrak stations near Monrovia: 8 miles: PASADENA (150 S. ROBLES AVE.) - Bus Station Services: fully wheelchair accessible, enclosed waiting area, public restrooms, public payphones, full-service food facilities, paid short-term parking, paid long-term parking, taxi stand, public transit connection.
15 miles: GLENDALE (400 W. CERRITOS AVE.) Services: fully wheelchair accessible, public payphones, free short-term parking, free long-term parking, call for taxi service, intercity bus service, public transit connection.
15 miles: LOS ANGELES (800 N. ALAMEDA ST.) Services: ticket office, fully wheelchair accessible, enclosed waiting area, public restrooms, public payphones, snack bar, free short-term parking, paid long-term parking, car rental agency, taxi stand, public transit connection.
College/University in Monrovia: Mt Sierra College Full-time enrollment: 487; Location: 101 E Huntington Dr; Private, for-profit; Website: www.mtsierra.edu)
Colleges/universities with over 2000 students nearest to Monrovia:
Azusa Pacific University (about 7 miles; Azusa, CA ; Full-time enrollment: 9,427)
Pasadena City College (about 7 miles; Pasadena, CA ; FT enrollment: 14,712)
Citrus College (about 7 miles; Glendora, CA ; FT enrollment: 8,456)
California Institute of Technology (about 8 miles; Pasadena, CA ; FT enrollment: 2,246)
Le Cordon Bleu College of Culinary Arts-Pasadena (about 8 miles; Pasadena, CA ; FT enrollment: 2,934)
Rio Hondo College (about 9 miles; Whittier, CA ; FT enrollment: 9,610)
Hacienda La Puente Adult Education (about 10 miles; La Puente, CA ; FT enrollment: 2,750)
Public high schools in Monrovia:
Private high school in Monrovia: CALVARY ROAD BAPTIST ACADEMY Students: 23, Location: 319 W OLIVE AVE, Grades: 1-12)
Public elementary/middle schools in Monrovia: CLIFTON MIDDLE Students: 682, Location: 226 S. IVY AVE., Grades: 6-8)SANTA FE MIDDLE Students: 580, Location: 148 W. DUARTE RD., Grades: 6-8)BRADOAKS ELEMENTARY Students: 391, Location: 930 E. LEMON AVE., Grades: KG-5)MAYFLOWER ELEMENTARY Students: 373, Location: 210 N. MAYFLOWER AVE., Grades: KG-5)WILD ROSE ELEMENTARY Students: 337, Location: 232 JASMINE AVE., Grades: KG-5)PLYMOUTH ELEMENTARY Students: 274, Location: 1300 BOLEY ST., Grades: KG-5)MONROE ELEMENTARY Location: 402 W. COLORADO BLVD., Grades: KG-5)
Private elementary/middle school in Monrovia: ICA CATHOLIC SCHOOL Students: 156, Location: 726 S SHAMROCK AVE, Grades: KG-8)
See full list of schools located in Monrovia Library in Monrovia: MONROVIA PUBLIC LIBRARY Operating income: $1,541,675; Location: 321 S. MYRTLE AVE.; 116,401 books ; 2,298 audio materials ; 177 video materials ; 6 local licensed databases ; 1 state licensed databases ; 1 other licensed databases ; 288 print serial subscriptions ; 1 electronic serial subscriptions )
Notable locations in Monrovia: (A) , Monrovia City Hall (B) , Medic 1 Ambulance Service Monrovia (C) , Medic 1 Ambulance Service Headquarters (D) , Monarc Ambulance (E) , Aegis Ambulance Service (F) , City of Monrovia Fire Department Station 102 (G) , City of Monrovia Fire Department Station 101 Headquarters (H) . Display/hide their locations on the map
Shopping Centers: (1) , Huntington Oaks Shopping Center (2) , Foothill Park Plaza Shopping Center (3) , Arcadia Specialty Center Shopping Center (4) . Display/hide their locations on the map
Main business address in Monrovia include: (A) , STAAR SURGICAL CO (B) . Display/hide their locations on the map
Churches in Monrovia include: (A) , Antioch Church (B) , Bethlehem Temple Apostolic Church (C) , Calvary Road Baptist Church (D) , First Baptist Church (E) , First Church of the Nazarene (F) , Greater Ambassador Church of God (G) , Immaculate Conception Church (H) , Kingdom Hall of Jehovahs Witnesses (I) . Display/hide their locations on the map
Cemetery: (1) . Display/hide its location on the map
Streams, rivers, and creeks: (A) . Display/hide its location on the map
Parks in Monrovia include: (1) , Olive Park (2) , Grand Avenue Park (3) , Julian Fisher Park (4) , Library Park (5) , Recreation Park (6) , Longden Avenue Park (7) , Oak Park (8) . Display/hide their locations on the map
Hotel:
Birthplace of: Corie Blount - Basketball player, Juma Sultan - Musician, Bryant Markson - College basketball player (Utah Utes), Chris Hale - Football player, Jackie Warner (baseball) - Baseball player, Kenny Baker (entertainer) - Actor, Mike Connelly - Football player, Daniel Kahl - Television personality, Tom Newell (baseball) - Baseball player.
Los Angeles County has a predicted average indoor radon screening level between 2 and 4 pCi/L (pico curies per liter) - Moderate Potential Drinking water stations with addresses in Monrovia and their reported violations in the past:
TRASK SCOUT RESERVATION- SAN GABRIEL (Population served: 80, Surface water):
Past health violations:
MCL, Monthly (TCR) - In OCT-2011, Contaminant: Coliform. Follow-up actions: St AO (w/o penalty) issued (MAR-29-2012)
Past monitoring violations:
One routine major monitoring violation
Drinking water stations with addresses in Monrovia that have no violations reported:
CRAZZY S WASEWAGAN CAMP (Population served: 193, Primary Water Source Type: Surface water)
Average household size: This city:
2.6 peopleCalifornia:
2.9 people
Percentage of family households: This city:
66.5%Whole state:
68.7%
Percentage of households with unmarried partners: This city:
6.7%Whole state:
7.2%
Likely homosexual households (counted as self-reported same-sex unmarried-partner households)
Lesbian couples: 0.5% of all households Gay men: 0.5% of all households
People in group quarters in Monrovia in 2010:
76 people in nursing facilities/skilled-nursing facilities
53 people in other noninstitutional facilities
15 people in correctional residential facilities
8 people in residential treatment centers for adults
4 people in group homes for juveniles (non-correctional)
People in group quarters in Monrovia in 2000:
85 people in nursing homes
76 people in other group homes
73 people in other noninstitutional group quarters
34 people in religious group quarters
10 people in homes or halfway houses for drug/alcohol abuse
8 people in training schools for juvenile delinquents
5 people in homes for the mentally retarded
2 people in other nonhousehold living situations
Banks with branches in Monrovia (2011 data):
JPMorgan Chase Bank, National Association: Monrovia Branch at 102 W Foothill Boulevard, branch established on 1987/06/30; Monrovia Albertsons Banking Center at 725 East Huntington Drive, branch established on 2010/09/14. Info updated 2011/11/10: Bank assets: $1,811,678.0 mil, Deposits: $1,190,738.0 mil, headquarters in Columbus, OH, positive income , International Specialization, 5577 total offices , Holding Company: Jpmorgan Chase & Co.
Wells Fargo Bank, National Association: Monrovia Branch at 535 S Myrtle Ave, branch established on 2004/06/21. Info updated 2011/04/05: Bank assets: $1,161,490.0 mil, Deposits: $905,653.0 mil, headquarters in Sioux Falls, SD, positive income , 6395 total offices , Holding Company: Wells Fargo & Company
Citizens Business Bank: Monrovia Business Financial Center at 100 East Huntington Drive, branch established on 1984/05/21. Info updated 2011/03/30: Bank assets: $6,475.4 mil, Deposits: $4,625.6 mil, headquarters in Ontario, CA, positive income , Commercial Lending Specialization, 46 total offices , Holding Company: Cvb Financial Corp.
Citibank, National Association: 237 South Myrtle Avenue Branch at 237 South Myrtle Avenue, branch established on 1945/01/01. Info updated 2012/01/10: Bank assets: $1,288,658.0 mil, Deposits: $882,541.0 mil, headquarters in Sioux Falls, SD, positive income , International Specialization, 1048 total offices , Holding Company: Citigroup Inc.
Bank of America, National Association: Monrovia Branch at 230 South Myrtle Avenue, branch established on 1927/02/19. Info updated 2009/11/18: Bank assets: $1,451,969.3 mil, Deposits: $1,077,176.8 mil, headquarters in Charlotte, NC, positive income , 5782 total offices , Holding Company: Bank Of America Corporation
U.S. Bank National Association: Monrovia Branch at 252 West Foothill Boulevard, branch established on 2005/09/28. Info updated 2012/01/30: Bank assets: $330,470.8 mil, Deposits: $236,091.5 mil, headquarters in Cincinnati, OH, positive income , 3121 total offices , Holding Company: U.S. Bancorp
Pacific Western Bank: Monrovia Branch at 515 South Myrtle Avenue, branch established on 1999/04/15. Info updated 2011/03/14: Bank assets: $5,513.1 mil, Deposits: $4,614.5 mil, headquarters in Los Angeles, CA, positive income , Commercial Lending Specialization, 78 total offices , Holding Company: Capgen Capital Group Ii Lp
For population 15 years and over in Monrovia:
Never married: 36.9%Now married: 45.4%Separated: 1.6%Widowed: 5.2%Divorced: 10.9% For population 25 years and over in Monrovia:
High school or higher: 89.8%Bachelor's degree or higher: 43.2%Graduate or professional degree: 16.2%Unemployed: 6.9%Mean travel time to work (commute): 24.6 minutes
Education Gini index (Inequality in education) Here:
13.0California average:
15.5
Religion statistics for Monrovia, CA (based on Los Angeles County data)
Religion Adherents Congregations Catholic 3,542,994 275 Evangelical Protestant 814,611 3,249 Other 451,594 1,023 Mainline Protestant 229,056 860 Black Protestant 112,338 290 Orthodox 63,517 76 None 4,604,495 -
Source: Clifford Grammich, Kirk Hadaway, Richard Houseal, Dale E.Jones, Alexei Krindatch, Richie Stanley and Richard H.Taylor. 2012. 2010 U.S.Religion Census: Religious Congregations & Membership Study. Association of Statisticians of American Religious Bodies. Jones, Dale E., et al. 2002. Congregations and Membership in the United States 2000. Nashville, TN: Glenmary Research Center. Graphs represent county-level data
Food Environment Statistics: Number of grocery stores : 2,084Here :
2.12 / 10,000 pop.California :
2.14 / 10,000 pop.
Number of supercenters and club stores : 32This county :
0.03 / 10,000 pop.California :
0.04 / 10,000 pop.
Number of convenience stores (no gas) : 567Here :
0.58 / 10,000 pop.State :
0.62 / 10,000 pop.
Number of convenience stores (with gas) : 1,206This county :
1.23 / 10,000 pop.California :
1.49 / 10,000 pop.
Number of full-service restaurants : 7,008This county :
7.15 / 10,000 pop.State :
7.42 / 10,000 pop.
Adult diabetes rate : Los Angeles County :
7.5%California :
7.3%
Adult obesity rate : Los Angeles County :
20.4%California :
21.3%
Low-income preschool obesity rate : Los Angeles County :
18.6%California :
17.9%
Health and Nutrition: Healthy diet rate : Monrovia:
49.7%California:
49.4%
Average overall health of teeth and gums : Monrovia:
49.1%California:
48.0%
Average BMI : Monrovia:
28.4California:
28.1
People feeling badly about themselves : This city:
19.4%California:
20.2%
People not drinking alcohol at all : Monrovia:
11.1%State:
11.2%
Average hours sleeping at night : Overweight people : This city:
33.2%State:
31.5%
General health condition : Monrovia:
57.3%California:
56.4%
Average condition of hearing : Monrovia:
81.4%California:
80.9%
More about Health and Nutrition of Monrovia, CA Residents
Local government employment and payroll (March 2022)
Function
Full-time employees
Monthly full-time payroll
Average yearly full-time wage
Part-time employees
Monthly part-time payroll
Police Protection - Officers
47 $581,787 $148,541 2 $3,470 Firefighters
40 $494,554 $148,366 0 $0 Police - Other
28 $227,565 $97,528 4 $6,362 Housing and Community Development (Local)
22 $191,640 $104,531 2 $9,302 Parks and Recreation
16 $128,454 $96,341 31 $44,803 Water Supply
15 $115,680 $92,544 0 $0 Financial Administration
13 $127,255 $117,466 1 $1,738 Other Government Administration
12 $119,731 $119,731 3 $3,939 Local Libraries
8 $70,343 $105,515 14 $25,318 Other and Unallocable
5 $41,900 $100,560 0 $0 Streets and Highways
5 $34,369 $82,486 0 $0 Fire - Other
4 $46,128 $138,384 1 $2,513
Totals for Government
215 $2,179,406 $121,641 58 $97,444
Monrovia government finances - Expenditure in 2017 (per resident):
Construction - Housing and Community Development: $5,546,000 ($150.33)
Central Staff Services: $993,000 ($26.92)Police Protection: $611,000 ($16.56)Current Operations - Police Protection: $23,645,000 ($640.91)
Local Fire Protection: $10,662,000 ($289.00)Central Staff Services: $7,257,000 ($196.70)Water Utilities: $5,973,000 ($161.90)Regular Highways: $2,915,000 ($79.01)Libraries: $2,690,000 ($72.91)Housing and Community Development: $2,567,000 ($69.58)Parks and Recreation: $2,447,000 ($66.33)Transit Utilities: $1,928,000 ($52.26)Sewerage: $1,169,000 ($31.69)Financial Administration: $1,139,000 ($30.87)Health - Other: $343,000 ($9.30)Solid Waste Management: $221,000 ($5.99)General - Other: $176,000 ($4.77)General - Interest on Debt: $7,886,000 ($213.75)
Intergovernmental to Local - Other - Water Utilities: $905,000 ($24.53)
Other - General - Other: $732,000 ($19.84)Other Capital Outlay - Libraries: $977,000 ($26.48)
Local Fire Protection: $226,000 ($6.13)Health - Other: $42,000 ($1.14)Parks and Recreation: $29,000 ($0.79)Solid Waste Management: $5,000 ($0.14)
Monrovia government finances - Revenue in 2017 (per resident):
Charges - Other: $7,073,000 ($191.72)
Solid Waste Management: $2,251,000 ($61.01)Sewerage: $1,935,000 ($52.45)Parks and Recreation: $527,000 ($14.28)Regular Highways: $478,000 ($12.96)Federal Intergovernmental - Other: $6,840,000 ($185.40)
Local Intergovernmental - Other: $28,000 ($0.76)
Miscellaneous - General Revenue - Other: $1,705,000 ($46.21)
Fines and Forfeits: $677,000 ($18.35)Sale of Property: $643,000 ($17.43)Royalties: $390,000 ($10.57)Interest Earnings: $281,000 ($7.62)Donations From Private Sources: $168,000 ($4.55)Rents: $24,000 ($0.65)Revenue - Water Utilities: $7,695,000 ($208.58)
Transit Utilities: $606,000 ($16.43)State Intergovernmental - Highways: $629,000 ($17.05)
Other: $593,000 ($16.07)General Local Government Support: $88,000 ($2.39)Tax - Property: $26,021,000 ($705.31)
General Sales and Gross Receipts: $11,152,000 ($302.28)Other Selective Sales: $1,945,000 ($52.72)Other License: $938,000 ($25.42)Occupation and Business License - Other: $767,000 ($20.79)Public Utilities Sales: $616,000 ($16.70)Other: $425,000 ($11.52)Documentary and Stock Transfer: $232,000 ($6.29)
Monrovia government finances - Debt in 2017 (per resident):
Long Term Debt - Beginning Outstanding - Unspecified Public Purpose: $151,567,000 ($4108.29)
Outstanding Unspecified Public Purpose: $149,831,000 ($4061.23)Retired Unspecified Public Purpose: $29,465,000 ($798.66)Issue, Unspecified Public Purpose: $27,730,000 ($751.63)
Monrovia government finances - Cash and Securities in 2017 (per resident):
Bond Funds - Cash and Securities: $13,738,000 ($372.37)
Other Funds - Cash and Securities: $59,216,000 ($1605.07)
Sinking Funds - Cash and Securities: $6,852,000 ($185.73)
2.98% of this county's 2021 resident taxpayers lived in other counties in 2020 ($81,235 average adjusted gross income )
Here:
2.98%California average:
5.19%
0.01% of residents moved from foreign countries ($155 average AGI )Los Angeles County:
0.01%California average:
0.03%
Top counties from which taxpayers relocated into this county between 2020 and 2021:
4.68% of this county's 2020 resident taxpayers moved to other counties in 2021 ($97,324 average adjusted gross income )
Here:
4.68%California average:
6.14%
0.01% of residents moved to foreign countries ($196 average AGI )Los Angeles County:
0.01%California average:
0.02%
Top counties to which taxpayers relocated from this county between 2020 and 2021:
Businesses in Monrovia, CA
Name Count Name Count
24 Hour Fitness 1 Marriott 1 7-Eleven 2 Marshalls 1 Albertsons 1 MasterBrand Cabinets 7 Applebee's 1 Mazda 1 Avenue 1 McDonald's 1 BMW 1 New Balance 1 Baja Fresh Mexican Grill 1 Nike 1 Baskin-Robbins 1 Office Depot 1 Bed Bath & Beyond 1 Panda Express 1 Blockbuster 1 Popeyes 1 Burger King 1 Quality 1 CVS 1 Quiznos 2 Chevrolet 1 RadioShack 1 Chuck E. Cheese's 1 Red Lobster 1 Church's Chicken 1 Rite Aid 1 Cold Stone Creamery 1 Safeway 1 Decora Cabinetry 1 Sprint Nextel 1 Domino's Pizza 1 Starbucks 3 FedEx 6 Subaru 1 GNC 1 Taco Bell 2 H&R Block 1 Toys"R"Us 1 Hilton 1 Trader Joe's 1 Home Depot 1 U-Haul 1 Homestead Studio Suites 1 UPS 4 Honda 1 Vans 2 Jack In The Box 1 Vons 1 Kohl's 1 Walgreens 2 LensCrafters 1 Wendy's 1 Little Caesars Pizza 1 YMCA 1
Strongest AM radio stations in Monrovia:
KLAC (570 AM; 50 kW; LOS ANGELES, CA; Owner: AMFM RADIO LICENSES, L.L.C.)
KDIS (1110 AM; 50 kW; PASADENA, CA; Owner: ABC,INC.)
KTNQ (1020 AM; 50 kW; LOS ANGELES, CA; Owner: KTNQ-AM LICENSE CORP.)
KXTA (1150 AM; 50 kW; LOS ANGELES, CA; Owner: CITICASTERS LICENSES, L.P.)
KFWB (980 AM; 50 kW; LOS ANGELES, CA; Owner: INFINITY BROADCASTING OPERATIONS, INC.)
KMPC (1540 AM; 50 kW; LOS ANGELES, CA; Owner: ROSE CITY RADIO CORPORATION)
KFI (640 AM; 50 kW; LOS ANGELES, CA; Owner: CAPSTAR TX LIMITED PARTNERSHIP)
KAZN (1300 AM; 5 kW; PASADENA, CA; Owner: MULTICULTURAL RADIO BROADCASTING, INC.)
KMRB (1430 AM; 5 kW; SAN GABRIEL, CA; Owner: POLYETHNIC BROADCASTING, INC.)
KXMX (1190 AM; 25 kW; ANAHEIM, CA; Owner: NEW INSPIRATION BROADCASTING COMPANY)
KBLA (1580 AM; 50 kW; SANTA MONICA, CA)
KRLA (870 AM; 20 kW; GLENDALE, CA; Owner: NEW INSPIRATION BROADCASTING COMPANY)
KSPN (710 AM; 50 kW; LOS ANGELES, CA; Owner: KABC-AM RADIO, INC.)
Strongest FM radio stations in Monrovia:
KCBS-FM (93.1 FM; LOS ANGELES, CA; Owner: INFINITY BROADCASTING OPERATIONS, INC.)
KSCA (101.9 FM; GLENDALE, CA; Owner: HBC LICENSE CORPORATION)
KOST (103.5 FM; LOS ANGELES, CA; Owner: CAPSTAR TX LIMITED PARTNERSHIP)
KLOS (95.5 FM; LOS ANGELES, CA; Owner: KLOS-FM RADIO, INC.)
K212FA (90.3 FM; TEMPLE CITY, CA; Owner: EDUCATIONAL MEDIA FOUNDATION)
KIIS-FM (102.7 FM; LOS ANGELES, CA; Owner: CITICASTERS LICENSES, L.P.)
KTWV (94.7 FM; LOS ANGELES, CA; Owner: INFINITY BROADCASTING OPERATIONS, INC.)
KPCC (89.3 FM; PASADENA, CA; Owner: PASADENA AREA COMMUNITY COLLEGE DISTRICT)
KHHT (92.3 FM; LOS ANGELES, CA; Owner: AMFM RADIO LICENSES, L.L.C.)
KLVE (107.5 FM; LOS ANGELES, CA; Owner: KLVE-FM LICENSE CORP.)
KBIG-FM (104.3 FM; LOS ANGELES, CA; Owner: AMFM RADIO LICENSES, L.L.C.)
K216EM (91.1 FM; ARCADIA, CA; Owner: LIFE ON THE WAY COMMUNICATIONS, INC.)
KMZT-FM (105.1 FM; LOS ANGELES, CA; Owner: MOUNT WILSON FM BROADCASTERS, INC.)
KPFK (90.7 FM; LOS ANGELES, CA; Owner: PACIFICA FOUNDATION, INC)
KZLA-FM (93.9 FM; LOS ANGELES, CA; Owner: EMMIS RADIO LICENSE CORPORATION)
KPWR (105.9 FM; LOS ANGELES, CA; Owner: EMMIS RADIO LICENSE CORPORATION)
KLSX (97.1 FM; LOS ANGELES, CA; Owner: INFINITY BROADCASTING OPERATIONS, INC.)
KUSC (91.5 FM; LOS ANGELES, CA; Owner: UNIVERSITY OF SOUTHERN CALIFORNIA)
KKLA-FM (99.5 FM; LOS ANGELES, CA; Owner: NEW INSPIRATION BROADCASTING CO., INC.)
KRTH-FM (101.1 FM; LOS ANGELES, CA; Owner: INFINITY BROADCASTING OPERATIONS, INC.)
TV broadcast stations around Monrovia:
KCBS-TV (Channel 2; LOS ANGELES, CA; Owner: CBS BROADCASTING INC.)
KTLA-TV (Channel 5; LOS ANGELES, CA; Owner: KTLA INC.)
KABC-TV (Channel 7; LOS ANGELES, CA; Owner: ABC HOLDING COMPANY, INC.)
KNBC (Channel 4; LOS ANGELES, CA; Owner: NBC SUBSIDIARY (KNBC-TV), INC.)
KCAL-TV (Channel 9; LOS ANGELES, CA; Owner: VIACOM TELEVISION STATIONS GROUP OF LOS ANGELES LLC)
KSCI (Channel 18; LONG BEACH, CA; Owner: KSLS, INC.)
KMEX-TV (Channel 34; LOS ANGELES, CA; Owner: KMEX LICENSE PARTNERSHIP, G.P.)
KAZA-TV (Channel 54; AVALON, CA; Owner: PAPPAS SOUTHERN CALIFORNIA LICENSE LLC)
KTRO-LP (Channel 50; LANCASTER, CA; Owner: ROBERT D. ADELMAN)
KDOC-TV (Channel 56; ANAHEIM, CA; Owner: GOLDEN ORANGE BROADCASTING CO., INC.)
KOCE-TV (Channel 50; HUNTINGTON BEACH, CA; Owner: BD. OF TRUSTEES, COAST COMMUNITY COLLEGE DIST.)
KCET (Channel 28; LOS ANGELES, CA; Owner: COMMUNITY TELEVISION OF SOUTHERN CALIFORNIA)
KXLA (Channel 44; RANCHO PALOS VERDES, CA; Owner: RANCHO PALOS VERDES BROADCASTERS, INC.)
KFTR (Channel 46; ONTARIO, CA; Owner: TELEFUTURA LOS ANGELES LLC)
KTTV (Channel 11; LOS ANGELES, CA; Owner: FOX TELEVISION STATIONS, INC.)
KVEA (Channel 52; CORONA, CA; Owner: ESTRELLA LICENSE CORPORATION)
KWHY-TV (Channel 22; LOS ANGELES, CA; Owner: TELEMUNDO OF LOS ANGELES LICENSE CORPORATION)
KCOP-TV (Channel 13; LOS ANGELES, CA; Owner: FOX TELEVISION STATIONS, INC.)
KSFV-LP (Channel 26; SAN FERNANDO VALLEY, CA; Owner: VENTURE TECHNOLOGIES GROUP, LLC)
KTBN-TV (Channel 40; SANTA ANA, CA; Owner: TRINITY BROADCASTING NETWORK, INC.)
KLCS (Channel 58; LOS ANGELES, CA; Owner: LOS ANGELES UNIFIED SCHOOL DISTRICT)
KHIZ (Channel 64; BARSTOW, CA; Owner: SUNBELT TELEVISION, INC.)
KHTV-LP (Channel 48; INLAND EMPIRE, CA; Owner: VENTURE TECHNOLOGIES GROUP, LLC)
KLAU-LP (Channel 66; REDLANDS, CA; Owner: GERALD BENAVIDES)
KNET-LP (Channel 38; LOS ANGELES, CA; Owner: VENTURE TECHNOLOGIES GROUP, LLC)
National Bridge Inventory (NBI) Statistics 27 Number of bridges226ft / 68.5m Total length2,552,805 Total average daily traffic194,341 Total average daily truck traffic
New bridges - historical statistics
1 1920-1929 4 1950-1959 19 1960-1969 2 1970-1979 1 1980-1989
See full National Bridge Inventory statistics for Monrovia, CA
Home Mortgage Disclosure Act Aggregated Statistics For Year 2009(Based on 5 full and 4 partial tracts) A) FHA, FSA/RHS & VA B) Conventional C) Refinancings D) Home Improvement Loans E) Loans on Dwellings For 5+ Families F) Non-occupant Loans on G) Loans On Manufactured Number Average Value Number Average Value Number Average Value Number Average Value Number Average Value Number Average Value Number Average Value
LOANS ORIGINATED 65 $396,196 205 $332,197 879 $318,480 29 $252,473 4 $1,490,000 68 $288,377 0 $0 APPLICATIONS APPROVED, NOT ACCEPTED 8 $320,638 32 $292,327 98 $326,667 3 $147,333 0 $0 13 $250,028 0 $0 APPLICATIONS DENIED 18 $369,435 38 $329,674 243 $371,947 21 $255,513 0 $0 19 $339,839 2 $149,195 APPLICATIONS WITHDRAWN 12 $368,632 40 $323,906 154 $329,752 12 $166,891 2 $340,000 16 $302,032 0 $0 FILES CLOSED FOR INCOMPLETENESS 5 $354,034 6 $342,442 43 $358,589 3 $104,920 1 $540,000 4 $174,265 0 $0
Aggregated Statistics For Year 2008(Based on 5 full and 4 partial tracts) A) FHA, FSA/RHS & VA B) Conventional C) Refinancings D) Home Improvement Loans E) Loans on Dwellings For 5+ Families F) Non-occupant Loans on G) Loans On Manufactured Number Average Value Number Average Value Number Average Value Number Average Value Number Average Value Number Average Value Number Average Value
LOANS ORIGINATED 34 $442,544 239 $354,026 411 $326,314 57 $244,000 7 $1,294,286 80 $321,615 1 $70,880 APPLICATIONS APPROVED, NOT ACCEPTED 3 $364,310 55 $356,533 98 $364,326 4 $59,565 0 $0 11 $382,861 4 $65,455 APPLICATIONS DENIED 7 $406,429 71 $416,972 260 $365,321 36 $137,170 3 $439,000 40 $336,642 6 $44,330 APPLICATIONS WITHDRAWN 5 $353,124 48 $407,399 127 $334,004 15 $166,601 1 $160,000 21 $432,251 0 $0 FILES CLOSED FOR INCOMPLETENESS 0 $0 12 $423,073 40 $357,350 9 $88,288 0 $0 8 $315,419 0 $0
Aggregated Statistics For Year 2007(Based on 5 full and 4 partial tracts) B) Conventional C) Refinancings D) Home Improvement Loans E) Loans on Dwellings For 5+ Families F) Non-occupant Loans on G) Loans On Manufactured Number Average Value Number Average Value Number Average Value Number Average Value Number Average Value Number Average Value
LOANS ORIGINATED 415 $366,325 748 $365,758 105 $250,156 15 $1,007,492 114 $436,710 3 $85,583 APPLICATIONS APPROVED, NOT ACCEPTED 97 $361,886 167 $352,020 26 $228,977 0 $0 22 $361,987 4 $111,342 APPLICATIONS DENIED 147 $371,937 419 $367,627 52 $224,705 1 $900,000 44 $408,359 3 $110,400 APPLICATIONS WITHDRAWN 60 $357,286 211 $364,856 24 $315,616 0 $0 23 $364,210 0 $0 FILES CLOSED FOR INCOMPLETENESS 23 $409,254 61 $367,280 9 $227,467 0 $0 10 $396,152 0 $0
Aggregated Statistics For Year 2006(Based on 5 full and 4 partial tracts) A) FHA, FSA/RHS & VA B) Conventional C) Refinancings D) Home Improvement Loans E) Loans on Dwellings For 5+ Families F) Non-occupant Loans on G) Loans On Manufactured Number Average Value Number Average Value Number Average Value Number Average Value Number Average Value Number Average Value Number Average Value
LOANS ORIGINATED 0 $0 656 $352,387 894 $349,716 185 $218,736 22 $1,227,496 157 $344,455 4 $55,915 APPLICATIONS APPROVED, NOT ACCEPTED 2 $201,525 115 $372,090 211 $348,394 24 $175,012 1 $7,560,000 30 $400,863 7 $60,443 APPLICATIONS DENIED 0 $0 208 $370,650 414 $371,917 85 $231,616 2 $627,500 77 $355,972 2 $366,725 APPLICATIONS WITHDRAWN 1 $345,000 111 $303,635 293 $330,486 42 $261,266 1 $775,000 31 $302,543 2 $209,710 FILES CLOSED FOR INCOMPLETENESS 0 $0 31 $320,831 86 $373,750 6 $112,197 0 $0 4 $234,740 0 $0
Aggregated Statistics For Year 2005(Based on 5 full and 4 partial tracts) A) FHA, FSA/RHS & VA B) Conventional C) Refinancings D) Home Improvement Loans E) Loans on Dwellings For 5+ Families F) Non-occupant Loans on G) Loans On Manufactured Number Average Value Number Average Value Number Average Value Number Average Value Number Average Value Number Average Value Number Average Value
LOANS ORIGINATED 0 $0 702 $339,331 1,182 $319,261 200 $204,676 16 $1,091,675 187 $329,917 4 $176,375 APPLICATIONS APPROVED, NOT ACCEPTED 1 $579,590 118 $332,459 163 $294,001 25 $186,188 0 $0 31 $329,170 3 $68,593 APPLICATIONS DENIED 0 $0 181 $310,021 366 $323,097 79 $163,760 1 $610,000 46 $359,478 7 $92,197 APPLICATIONS WITHDRAWN 0 $0 141 $326,019 350 $316,269 65 $213,768 4 $565,545 48 $332,137 0 $0 FILES CLOSED FOR INCOMPLETENESS 0 $0 33 $312,512 139 $339,122 8 $213,500 0 $0 10 $392,863 1 $300,000
Aggregated Statistics For Year 2004(Based on 5 full and 4 partial tracts) A) FHA, FSA/RHS & VA B) Conventional C) Refinancings D) Home Improvement Loans E) Loans on Dwellings For 5+ Families F) Non-occupant Loans on G) Loans On Manufactured Number Average Value Number Average Value Number Average Value Number Average Value Number Average Value Number Average Value Number Average Value
LOANS ORIGINATED 0 $0 711 $296,463 1,452 $269,487 156 $169,384 20 $804,650 224 $267,659 2 $61,705 APPLICATIONS APPROVED, NOT ACCEPTED 1 $261,000 121 $304,793 216 $275,244 35 $166,412 1 $435,000 26 $316,095 0 $0 APPLICATIONS DENIED 2 $209,600 137 $299,270 396 $264,667 60 $157,523 1 $1,130,800 62 $276,982 5 $77,398 APPLICATIONS WITHDRAWN 1 $167,900 90 $310,546 345 $253,385 41 $181,195 1 $486,000 24 $308,841 0 $0 FILES CLOSED FOR INCOMPLETENESS 0 $0 27 $322,154 207 $245,124 10 $78,504 0 $0 9 $278,458 0 $0
Aggregated Statistics For Year 2003(Based on 5 full and 4 partial tracts) A) FHA, FSA/RHS & VA B) Conventional C) Refinancings D) Home Improvement Loans E) Loans on Dwellings For 5+ Families F) Non-occupant Loans on Number Average Value Number Average Value Number Average Value Number Average Value Number Average Value Number Average Value
LOANS ORIGINATED 6 $229,872 721 $245,527 2,925 $220,952 65 $70,245 26 $1,024,840 265 $207,205 APPLICATIONS APPROVED, NOT ACCEPTED 1 $228,610 73 $247,773 401 $215,344 13 $67,008 0 $0 63 $207,380 APPLICATIONS DENIED 1 $270,350 89 $242,337 486 $223,446 42 $57,860 5 $640,000 60 $211,332 APPLICATIONS WITHDRAWN 3 $249,057 92 $241,358 597 $226,979 17 $101,549 1 $215,000 38 $227,573 FILES CLOSED FOR INCOMPLETENESS 1 $144,550 14 $323,096 131 $214,250 5 $36,218 1 $1,325,000 15 $179,743
Aggregated Statistics For Year 2002(Based on 5 full and 4 partial tracts) A) FHA, FSA/RHS & VA B) Conventional C) Refinancings D) Home Improvement Loans E) Loans on Dwellings For 5+ Families F) Non-occupant Loans on Number Average Value Number Average Value Number Average Value Number Average Value Number Average Value Number Average Value
LOANS ORIGINATED 29 $191,926 706 $214,837 1,854 $206,068 54 $64,934 17 $719,294 209 $190,449 APPLICATIONS APPROVED, NOT ACCEPTED 4 $179,555 98 $208,347 262 $208,514 13 $43,118 1 $1,340,000 21 $192,210 APPLICATIONS DENIED 4 $202,282 92 $204,293 371 $190,298 39 $42,088 0 $0 34 $201,991 APPLICATIONS WITHDRAWN 4 $120,088 104 $192,189 408 $203,618 25 $75,772 2 $228,260 30 $208,143 FILES CLOSED FOR INCOMPLETENESS 0 $0 25 $261,801 184 $212,193 0 $0 0 $0 8 $214,165
Aggregated Statistics For Year 2001(Based on 5 full and 4 partial tracts) A) FHA, FSA/RHS & VA B) Conventional C) Refinancings D) Home Improvement Loans E) Loans on Dwellings For 5+ Families F) Non-occupant Loans on Number Average Value Number Average Value Number Average Value Number Average Value Number Average Value Number Average Value
LOANS ORIGINATED 59 $188,703 581 $192,136 1,244 $181,550 60 $58,312 12 $844,945 146 $168,940 APPLICATIONS APPROVED, NOT ACCEPTED 7 $165,323 64 $179,402 183 $186,575 12 $31,073 2 $425,000 14 $168,399 APPLICATIONS DENIED 14 $161,905 77 $175,002 389 $170,289 40 $45,898 1 $455,230 28 $166,906 APPLICATIONS WITHDRAWN 8 $172,704 83 $171,471 293 $175,231 25 $41,462 0 $0 24 $173,472 FILES CLOSED FOR INCOMPLETENESS 0 $0 25 $195,578 129 $190,188 2 $35,145 3 $1,034,000 8 $183,880
Aggregated Statistics For Year 2000(Based on 5 full and 4 partial tracts) A) FHA, FSA/RHS & VA B) Conventional C) Refinancings D) Home Improvement Loans E) Loans on Dwellings For 5+ Families F) Non-occupant Loans on Number Average Value Number Average Value Number Average Value Number Average Value Number Average Value Number Average Value
LOANS ORIGINATED 70 $170,658 493 $175,332 300 $148,584 60 $37,167 11 $570,034 52 $140,995 APPLICATIONS APPROVED, NOT ACCEPTED 7 $170,191 55 $172,582 69 $157,371 22 $39,191 0 $0 11 $141,685 APPLICATIONS DENIED 16 $143,639 97 $173,525 184 $154,082 36 $48,783 3 $574,140 20 $166,804 APPLICATIONS WITHDRAWN 11 $176,040 62 $179,303 112 $138,499 13 $35,054 2 $1,825,670 2 $134,180 FILES CLOSED FOR INCOMPLETENESS 2 $219,890 28 $216,552 76 $172,964 4 $13,372 3 $2,307,013 2 $125,370
Aggregated Statistics For Year 1999(Based on 4 full and 5 partial tracts) A) FHA, FSA/RHS & VA B) Conventional C) Refinancings D) Home Improvement Loans E) Loans on Dwellings For 5+ Families F) Non-occupant Loans on Number Average Value Number Average Value Number Average Value Number Average Value Number Average Value Number Average Value
LOANS ORIGINATED 81 $165,371 521 $167,823 679 $154,229 80 $29,589 18 $485,853 99 $136,809 APPLICATIONS APPROVED, NOT ACCEPTED 6 $167,517 63 $144,598 158 $145,843 34 $31,844 0 $0 24 $115,576 APPLICATIONS DENIED 21 $173,658 94 $148,575 276 $135,649 43 $29,214 2 $318,000 32 $137,898 APPLICATIONS WITHDRAWN 11 $152,443 84 $179,385 179 $130,434 6 $20,783 2 $207,240 12 $151,257 FILES CLOSED FOR INCOMPLETENESS 7 $170,893 24 $144,447 90 $155,943 0 $0 2 $1,530,170 9 $159,899
Detailed mortgage data for all 9 tracts in Monrovia, CA
Private Mortgage Insurance Companies Aggregated Statistics For Year 2009(Based on 5 full and 4 partial tracts) A) Conventional B) Refinancings Number Average Value Number Average Value
LOANS ORIGINATED 28 $379,502 7 $409,744 APPLICATIONS APPROVED, NOT ACCEPTED 2 $221,580 3 $419,150 APPLICATIONS DENIED 4 $405,750 2 $459,500 APPLICATIONS WITHDRAWN 4 $619,250 1 $502,000 FILES CLOSED FOR INCOMPLETENESS 2 $375,220 0 $0
Aggregated Statistics For Year 2008(Based on 5 full and 4 partial tracts) A) Conventional B) Refinancings C) Non-occupant Loans on Number Average Value Number Average Value Number Average Value
LOANS ORIGINATED 34 $388,654 6 $406,143 1 $222,000 APPLICATIONS APPROVED, NOT ACCEPTED 12 $391,194 7 $441,030 1 $222,000 APPLICATIONS DENIED 8 $361,584 1 $718,530 1 $522,000 APPLICATIONS WITHDRAWN 3 $273,907 0 $0 0 $0 FILES CLOSED FOR INCOMPLETENESS 0 $0 0 $0 0 $0
Aggregated Statistics For Year 2007(Based on 5 full and 4 partial tracts) A) Conventional B) Refinancings Number Average Value Number Average Value
LOANS ORIGINATED 22 $435,805 12 $445,939 APPLICATIONS APPROVED, NOT ACCEPTED 2 $480,500 4 $501,582 APPLICATIONS DENIED 2 $522,285 1 $439,200 APPLICATIONS WITHDRAWN 0 $0 1 $417,000 FILES CLOSED FOR INCOMPLETENESS 0 $0 0 $0
Aggregated Statistics For Year 2006(Based on 5 full and 2 partial tracts) A) Conventional B) Refinancings C) Non-occupant Loans on Number Average Value Number Average Value Number Average Value
LOANS ORIGINATED 21 $435,470 8 $424,282 1 $441,650 APPLICATIONS APPROVED, NOT ACCEPTED 1 $410,000 2 $453,590 0 $0 APPLICATIONS DENIED 0 $0 0 $0 0 $0 APPLICATIONS WITHDRAWN 2 $565,000 1 $370,000 0 $0 FILES CLOSED FOR INCOMPLETENESS 0 $0 0 $0 0 $0
Aggregated Statistics For Year 2005(Based on 5 full and 3 partial tracts) A) Conventional B) Refinancings Number Average Value Number Average Value
LOANS ORIGINATED 15 $401,745 13 $374,930 APPLICATIONS APPROVED, NOT ACCEPTED 0 $0 2 $483,315 APPLICATIONS DENIED 0 $0 0 $0 APPLICATIONS WITHDRAWN 0 $0 0 $0 FILES CLOSED FOR INCOMPLETENESS 0 $0 0 $0
Aggregated Statistics For Year 2004(Based on 5 full and 4 partial tracts) A) Conventional B) Refinancings C) Non-occupant Loans on Number Average Value Number Average Value Number Average Value
LOANS ORIGINATED 16 $326,608 6 $267,798 3 $255,333 APPLICATIONS APPROVED, NOT ACCEPTED 4 $379,348 8 $368,000 0 $0 APPLICATIONS DENIED 0 $0 0 $0 0 $0 APPLICATIONS WITHDRAWN 3 $305,803 2 $236,500 1 $283,000 FILES CLOSED FOR INCOMPLETENESS 0 $0 0 $0 0 $0
Aggregated Statistics For Year 2003(Based on 5 full and 4 partial tracts) A) Conventional B) Refinancings C) Non-occupant Loans on Number Average Value Number Average Value Number Average Value
LOANS ORIGINATED 63 $276,700 31 $234,835 8 $272,612 APPLICATIONS APPROVED, NOT ACCEPTED 12 $286,709 24 $239,079 0 $0 APPLICATIONS DENIED 1 $101,650 0 $0 1 $101,650 APPLICATIONS WITHDRAWN 3 $365,537 6 $265,072 1 $178,340 FILES CLOSED FOR INCOMPLETENESS 0 $0 0 $0 0 $0
Aggregated Statistics For Year 2002(Based on 5 full and 4 partial tracts) A) Conventional B) Refinancings C) Non-occupant Loans on Number Average Value Number Average Value Number Average Value
LOANS ORIGINATED 102 $236,847 58 $224,786 8 $260,462 APPLICATIONS APPROVED, NOT ACCEPTED 42 $206,380 35 $213,905 3 $238,667 APPLICATIONS DENIED 5 $300,400 1 $300,000 1 $360,000 APPLICATIONS WITHDRAWN 5 $242,596 6 $212,167 1 $288,000 FILES CLOSED FOR INCOMPLETENESS 1 $138,500 0 $0 0 $0
Aggregated Statistics For Year 2001(Based on 5 full and 4 partial tracts) A) Conventional B) Refinancings C) Non-occupant Loans on Number Average Value Number Average Value Number Average Value
LOANS ORIGINATED 124 $215,633 66 $204,536 4 $187,682 APPLICATIONS APPROVED, NOT ACCEPTED 28 $187,554 15 $182,069 3 $157,277 APPLICATIONS DENIED 6 $208,440 4 $274,090 2 $140,030 APPLICATIONS WITHDRAWN 5 $234,406 2 $170,890 0 $0 FILES CLOSED FOR INCOMPLETENESS 1 $165,000 0 $0 0 $0
Aggregated Statistics For Year 2000(Based on 5 full and 4 partial tracts) A) Conventional B) Refinancings C) Non-occupant Loans on Number Average Value Number Average Value Number Average Value
LOANS ORIGINATED 135 $188,403 26 $209,329 9 $160,416 APPLICATIONS APPROVED, NOT ACCEPTED 27 $181,509 5 $188,860 2 $186,000 APPLICATIONS DENIED 6 $169,007 2 $252,575 0 $0 APPLICATIONS WITHDRAWN 4 $162,482 0 $0 0 $0 FILES CLOSED FOR INCOMPLETENESS 0 $0 0 $0 0 $0
Aggregated Statistics For Year 1999(Based on 4 full and 5 partial tracts) A) Conventional B) Refinancings C) Non-occupant Loans on Number Average Value Number Average Value Number Average Value
LOANS ORIGINATED 148 $191,100 58 $173,350 3 $113,963 APPLICATIONS APPROVED, NOT ACCEPTED 16 $211,196 14 $173,207 1 $111,580 APPLICATIONS DENIED 6 $159,997 5 $131,434 0 $0 APPLICATIONS WITHDRAWN 5 $151,132 3 $131,497 0 $0 FILES CLOSED FOR INCOMPLETENESS 1 $225,350 0 $0 0 $0
Fire-safe hotels and motels in Monrovia, California:
Courtyard Los Angeles Pasadena/Monrovia, 700 W Huntington Dr, Monrovia, California 91016 Phone: (626) 357-5211, Fax: (626) 359-4862
DoubleTree by Hilton Monrovia - Pasadena Area, 924 W Huntington Dr, Monrovia, California 91016 Phone: (626) 357-1900, Fax: (626) 359-1386
Extended Stay America - Los Angeles - Monrovia, 930 S Fifth Ave, Monrovia, California 91016 Phone: (626) 256-6999, Fax: (626) 256-6969
All 3 fire-safe hotels and motels in Monrovia, California
Most common first names in Monrovia, CA among deceased individuals Name Count Lived (average)
John 240 74.9 years Mary 227 80.9 years Robert 189 71.1 years William 182 74.0 years James 152 71.5 years Charles 137 75.6 years George 125 78.8 years Helen 100 80.2 years Dorothy 94 79.0 years Joseph 94 73.6 years
Most common last names in Monrovia, CA among deceased individuals Last name Count Lived (average)
Smith 107 76.7 years Anderson 62 77.8 years Johnson 61 78.3 years Brown 58 75.4 years Williams 58 76.9 years Miller 45 78.5 years Davis 41 77.1 years Jones 39 78.0 years Wilson 37 77.9 years Moore 31 77.8 years
Monrovia compared to California state average:
Unemployed percentage below state average. Median age above state average. Length of stay since moving in significantly above state average. Percentage of population with a bachelor's degree or higher above state average.
#75 on the list of "Top 101 cities with the most residents born in Other Southern Europe (population 500+)"
#1 on the list of "Top 101 counties with the most Evangelical Protestant congregations"
#1 on the list of "Top 101 counties with the most Mainline Protestant congregations"
#1 on the list of "Top 101 counties with the most Orthodox adherents"
#1 on the list of "Top 101 counties with the highest ground withdrawal of fresh water for public supply (pop. 50,000+)"
#1 on the list of "Top 101 counties with the most Catholic adherents (pop. 50,000+)"
Top Patent Applicants
Omid Vafa (35)
Matthew J. Bernett (33)
Gregory L. Moore (25)
Kai-Wei Nieh (22)
Igor Vostiar (12)
Matthew Bernett (11)
Darin James Douma (10)
John C. Williams (9)
Po-Ying Li (8)
Christopher W. Heatherly (8)
Total of 536 patent applications in 2008-2024.

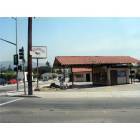
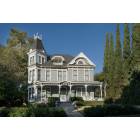
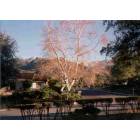

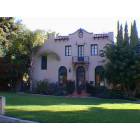
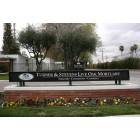
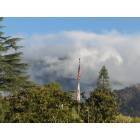
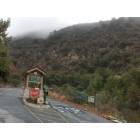
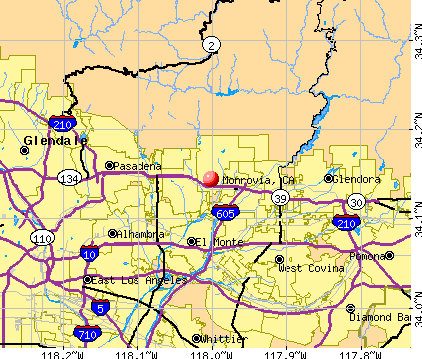


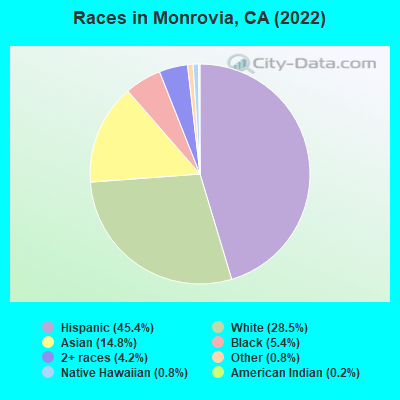
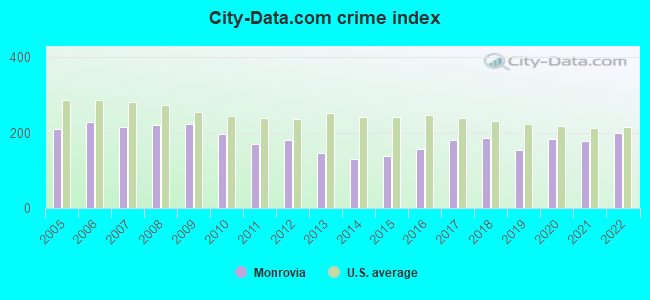
 Recent articles from our blog. Our writers, many of them Ph.D. graduates or candidates, create easy-to-read articles on a wide variety of topics.

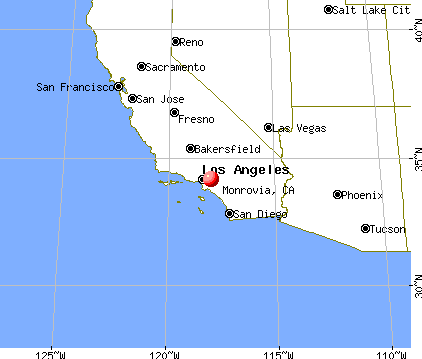
 (2.1 miles
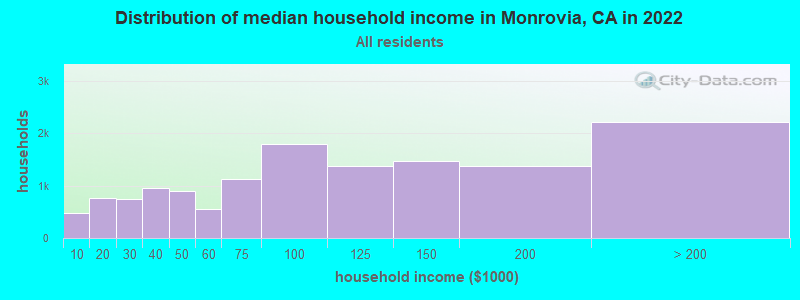
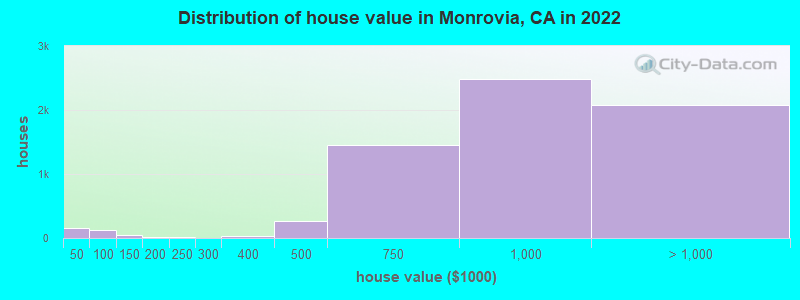
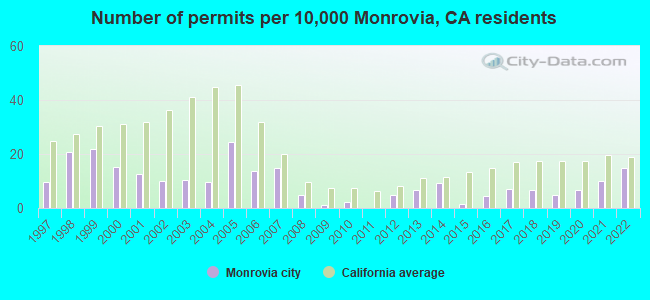
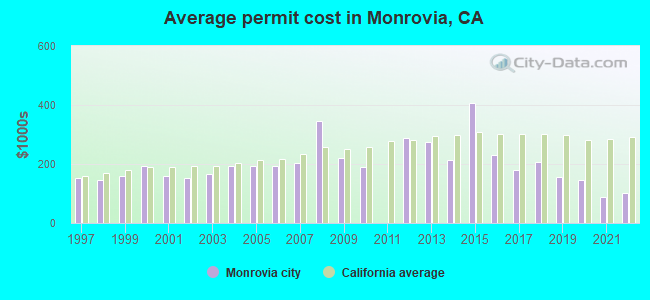
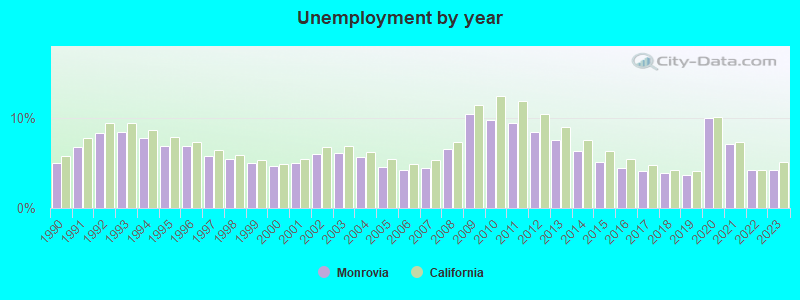
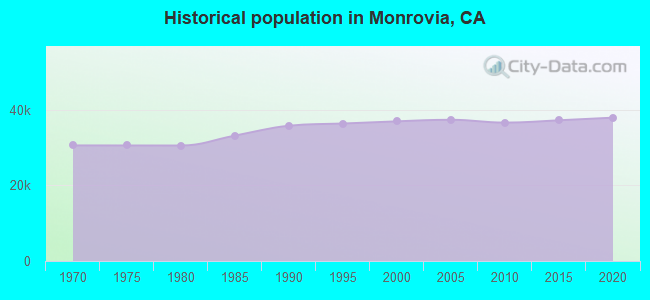
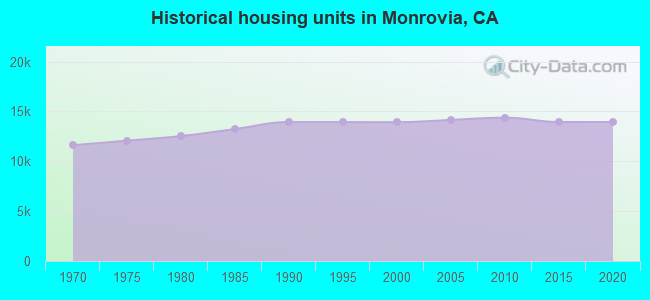
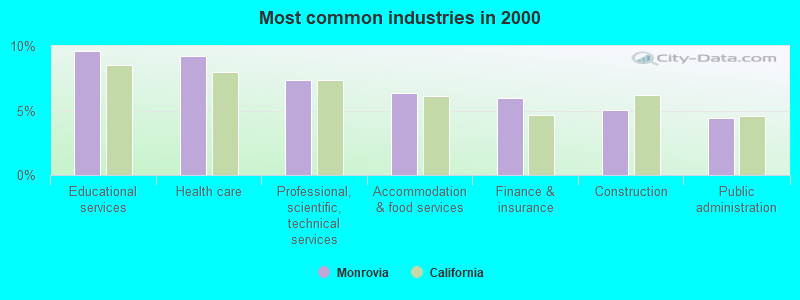
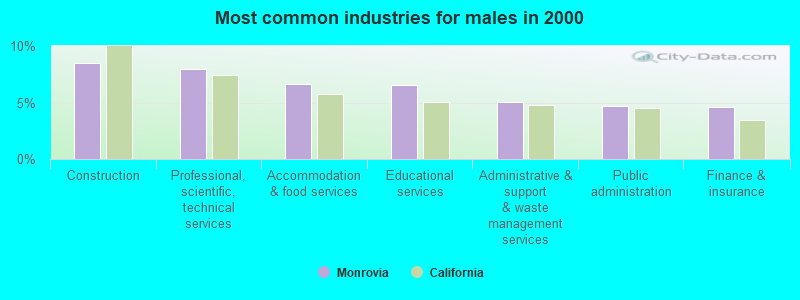
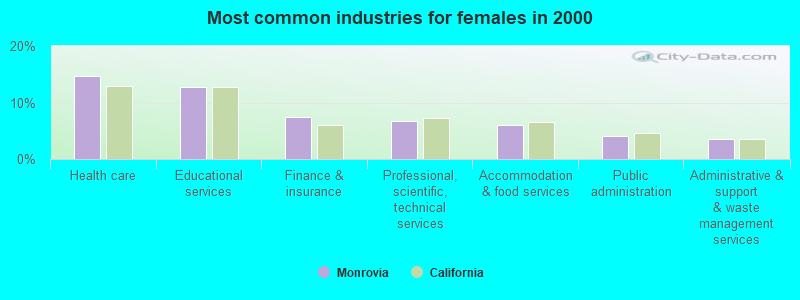
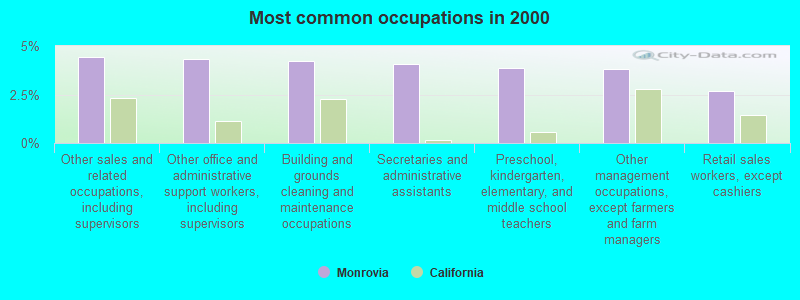
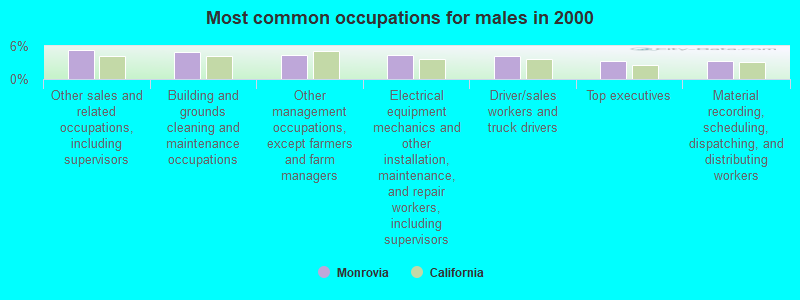
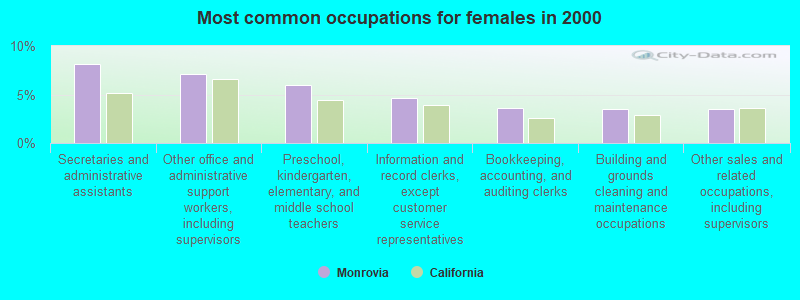
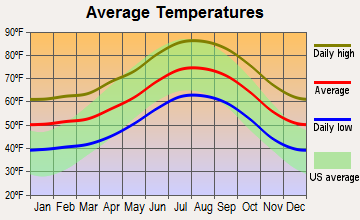
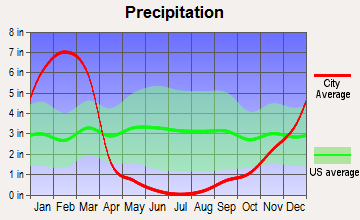
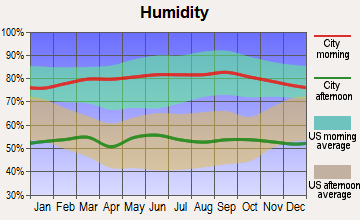
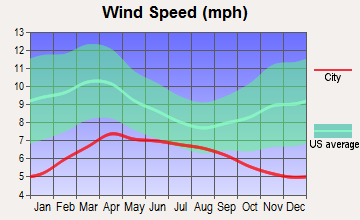
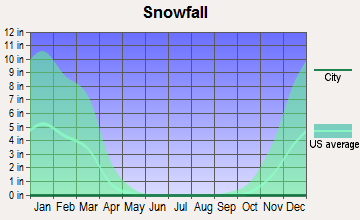
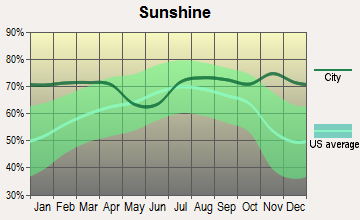
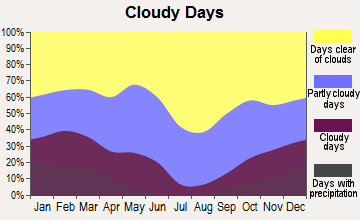
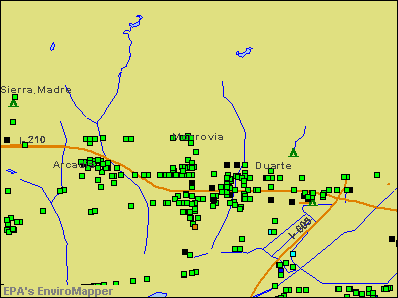

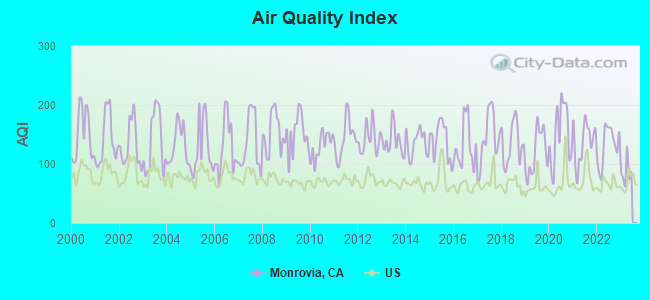
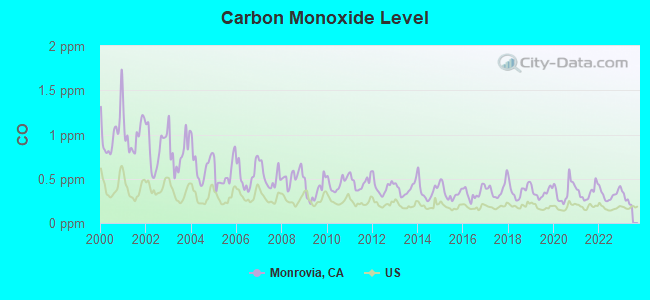
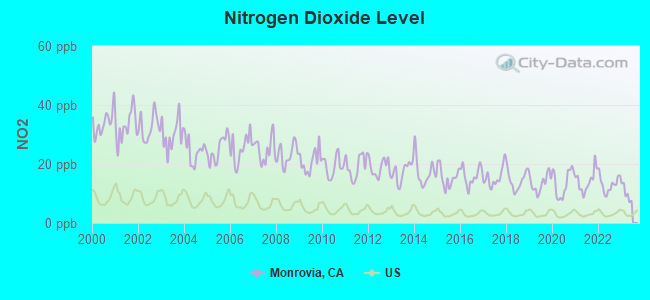
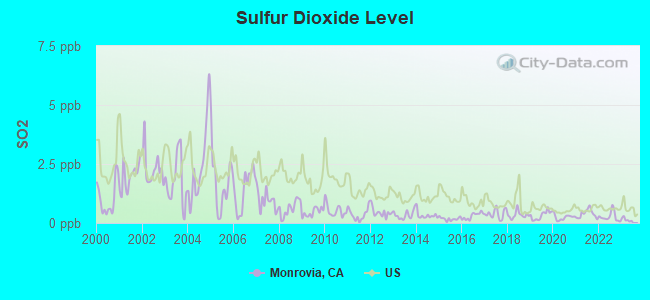
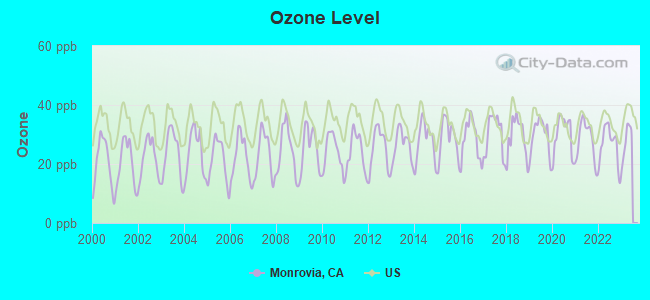
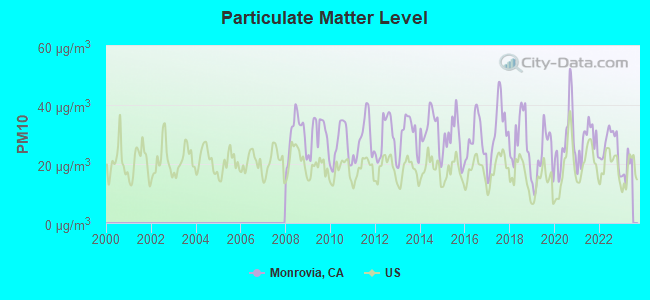
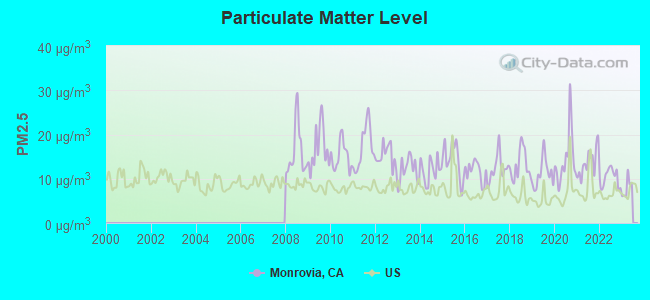
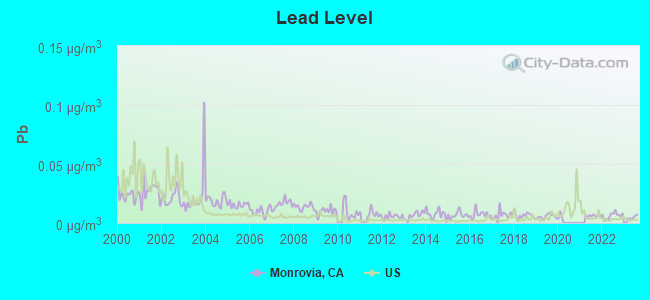
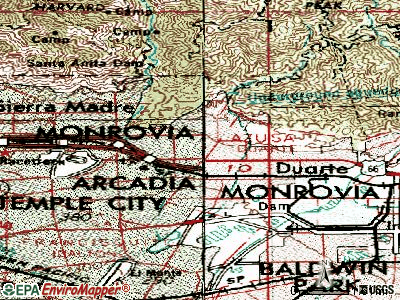
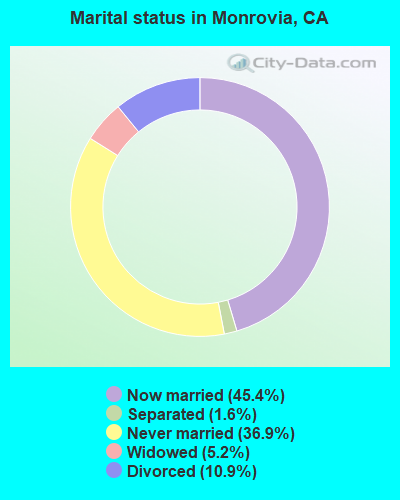
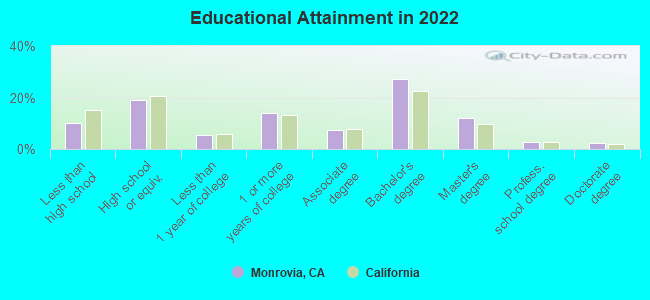
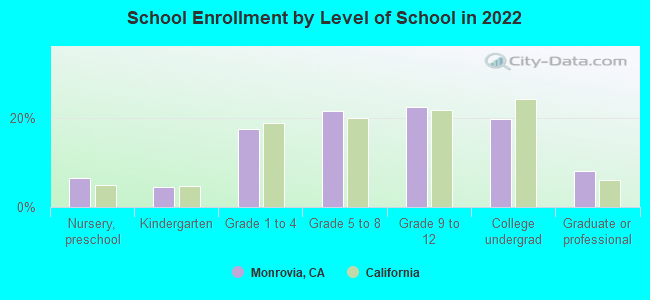
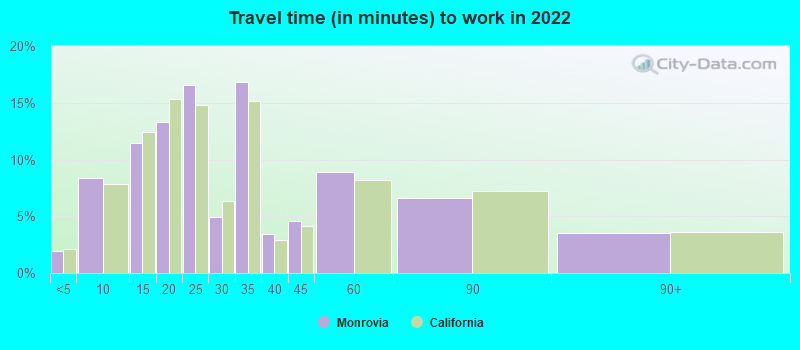
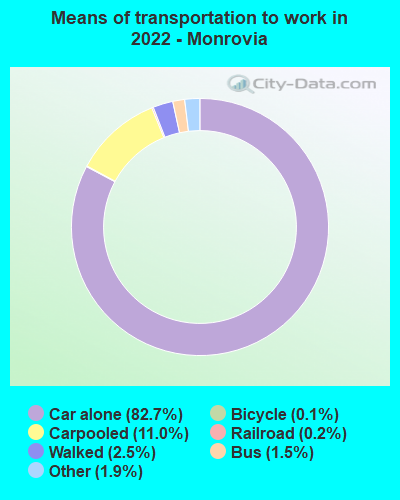


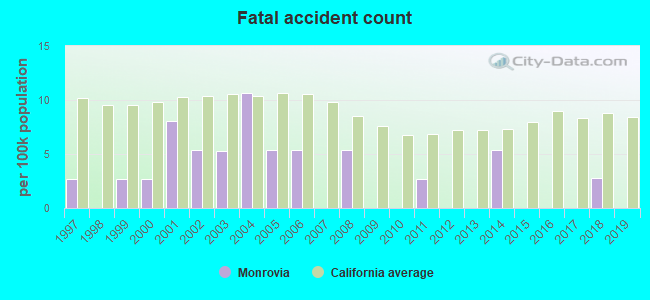
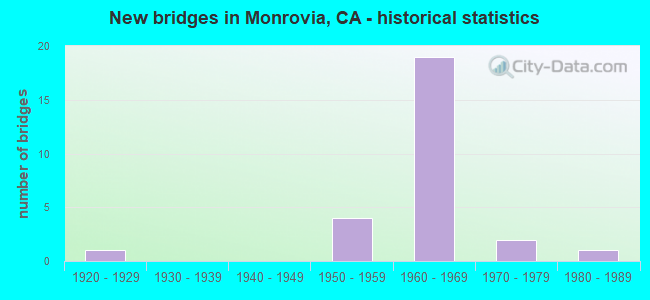
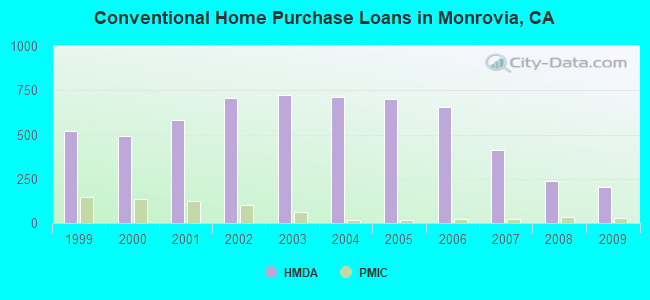
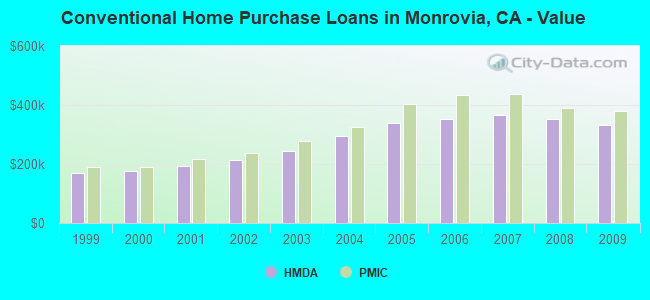
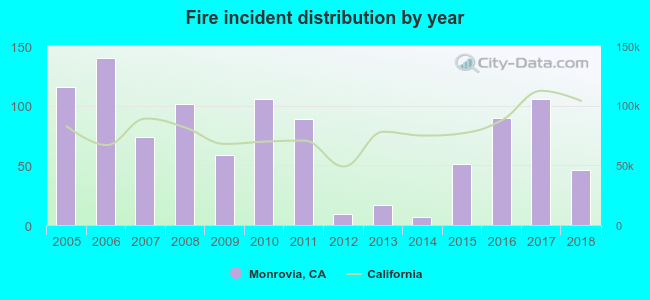 Based on the data from the years 2005 - 2018 the average number of fire incidents per year is 72. The highest number of reported fires - 140 took place in 2006, and the least - 7 in 2014. The data has a decreasing trend.
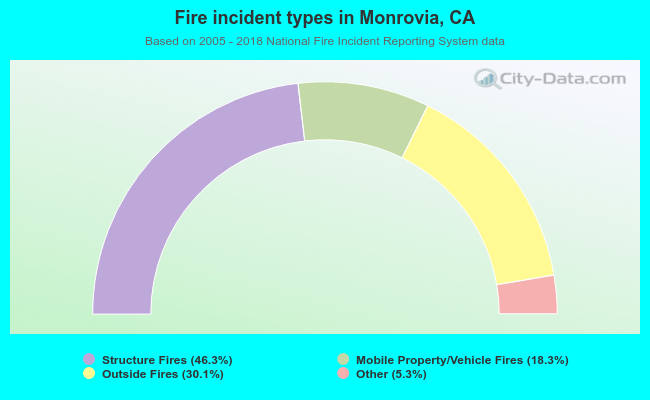 When looking into fire subcategories, the most incidents belonged to: Structure Fires (46.3%), and Outside Fires (30.1%).