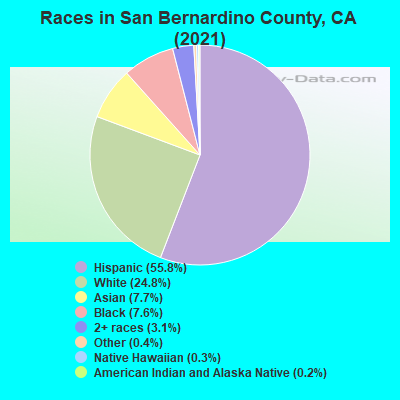
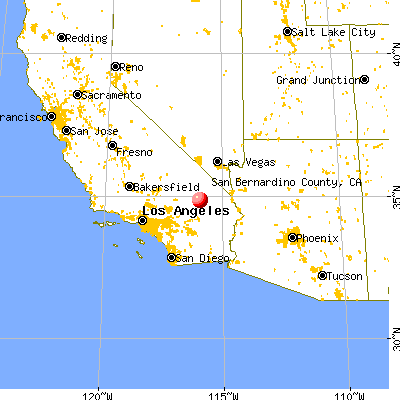
San Bernardino County, California (CA)
County owner-occupied free and clear houses and condos in 2010: 75,561
County owner-occupied houses and condos in 2000: 341,014
Renter-occupied apartments: 228,045 (it was 187,580 in 2000)
| % of renters here: | 35% |
| State: | 44% |
Land area: 20052 sq. mi.
Water area: 52.8 sq. mi.
Population density: 109 people per square mile (average).
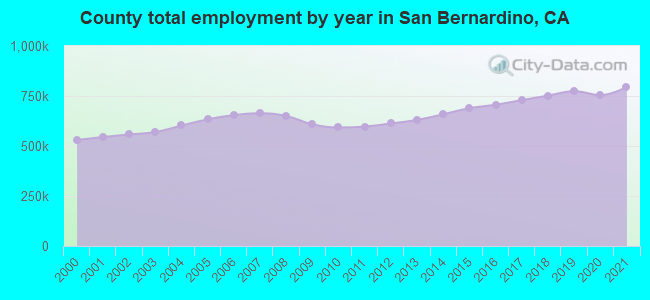
Industries providing employment: Educational, health and social services (20.2%), Transportation and warehousing,and utilities (13.2%), Retail trade (12.8%).
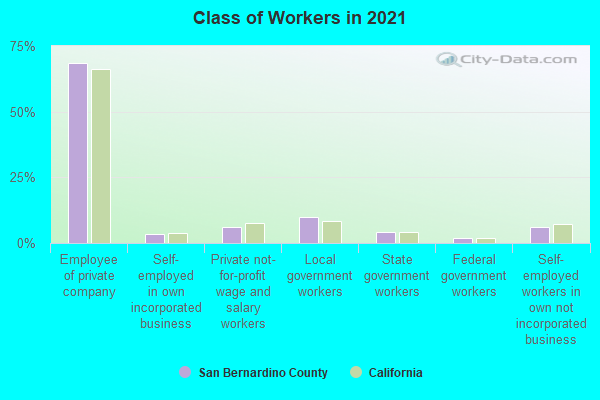
Type of workers:
- Private wage or salary: 77%
- Government: 17%
- Self-employed, not incorporated: 6%
- Unpaid family work: 0%
- OSM Map
- General Map
- Google Map
- MSN Map


- 1,233,60156.2%Hispanic or Latino
- 527,81124.1%White Non-Hispanic Alone
- 179,9918.2%Asian alone
- 160,2157.3%Black Non-Hispanic Alone
- 64,7122.9%Two or more races
- 15,4780.7%Some other race alone
- 6,6670.3%Native Hawaiian and Other
Pacific Islander alone - 5,1810.2%American Indian and Alaska Native alone
| Median resident age: | 34.4 years |
| California median age: | 37.9 years |
| Males: 1,101,675 | |
| Females: 1,091,981 |


| San Bernardino County: | 3.0 people |
| California: | 3 people |
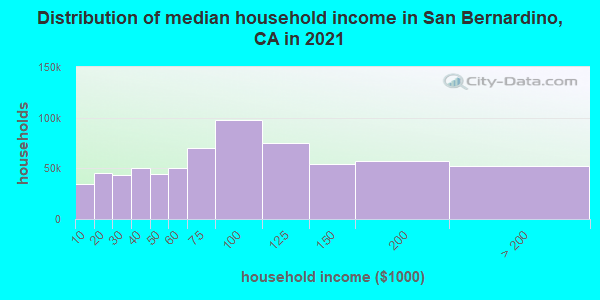
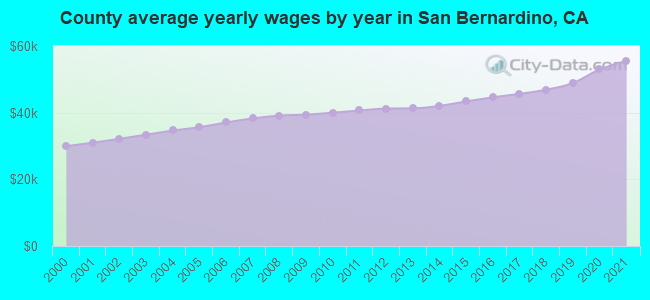
Estimated median household income in 2022: $79,091 ($42,066 in 1999)
| This county: | $79,091 |
| California: | $91,551 |
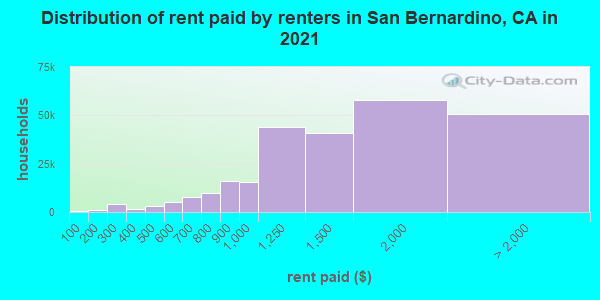
Median contract rent in 2022 for apartments: $1,442 (lower quartile is $1,021, upper quartile is $1,933)
| This county: | $1442 |
| State: | $1719 |
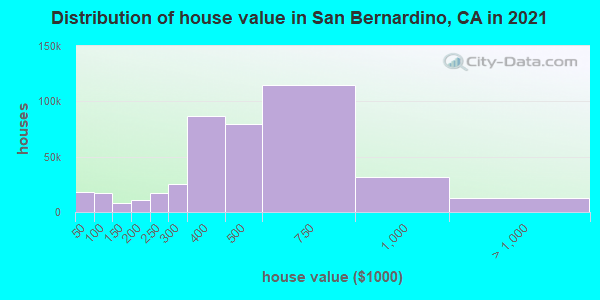
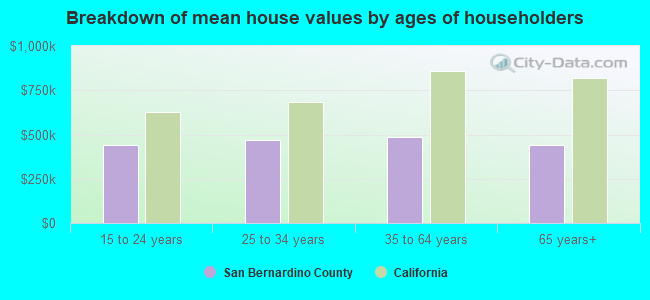
Estimated median house or condo value in 2022: $504,400 (it was $124,900 in 2000)
| San Bernardino: | $504,400 |
| California: | $715,900 |
Mean price in 2022:
Median monthly housing costs for homes and condos with a mortgage: $2,178Detached houses: $572,275
Here: $572,275 State: $988,808 Townhouses or other attached units: $512,095
Here: $512,095 State: $838,546 In 2-unit structures: $547,337
Here: $547,337 State: $1,138,100 In 3-to-4-unit structures: $471,159
Here: $471,159 State: $824,253 In 5-or-more-unit structures: $418,370
Here: $418,370 State: $730,996 Mobile homes: $119,083
Here: $119,083 State: $184,506 Occupied boats, RVs, vans, etc.: $73,388
Here: $73,388 State: $204,957
Median monthly housing costs for units without a mortgage: $624
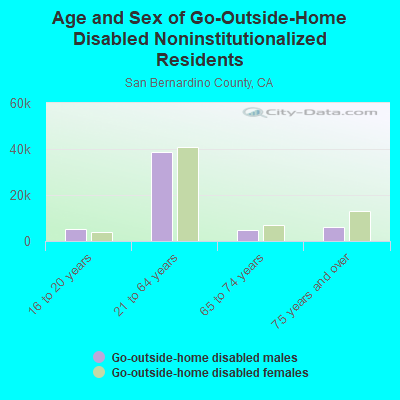
Institutionalized population: 25,654
Crime in 2020 (reported by the sheriff's office or county police, not the county total):
- Murders: 23
- Rapes: 104
- Robberies: 133
- Assaults: 1599
- Burglaries: 902
- Thefts: 1421
- Auto thefts: 928
Crime in 2019 (reported by the sheriff's office or county police, not the county total):
- Murders: 27
- Rapes: 115
- Robberies: 189
- Assaults: 1172
- Burglaries: 1142
- Thefts: 1875
- Auto thefts: 928
Health of residents in San Bernardino County based on CDC Behavioral Risk Factor Surveillance System Survey Questionnaires from 2013 to 2021:
General health status score of residents in this county from 1 (poor) to 5 (excellent) is 3.4. This is worse than average.70.4% of residents exercised in the past month. This is about average.
38.7% of residents smoked 100+ cigarettes in their lives. This is less than average.
50.0% of adult residents drank alcohol in the past 30 days. This is less than average.
63.8% of residents visited a dentist within the past year. This is less than average.
Average weight of males is 193 pounds. This is about average.
Average weight of females is 162 pounds. This is about average.
Health of residents in San Bernardino County based on CDC Behavioral Risk Factor Surveillance System Survey Questionnaires from 2003 to 2012:
General health status score of residents in this county from 1 (poor) to 5 (excellent) is 3.4. This is about average.73.3% of residents exercised in the past month. This is about average.
42.0% of residents smoked 100+ cigarettes in their lives. This is about average.
74.1% of adult residents drank alcohol in the past 30 days. This is about average.
64.5% of residents visited a dentist within the past year. This is less than average.
Average weight of males is 194 pounds. This is about average.
Average weight of females is 161 pounds. This is about average.
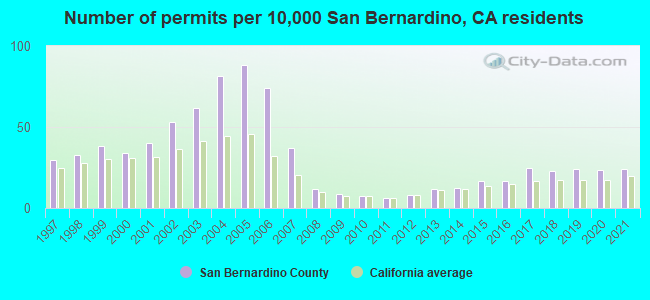
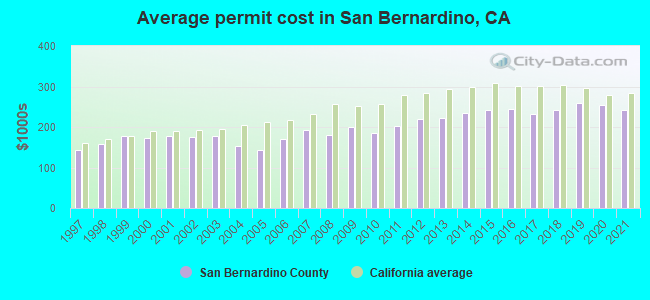
Single-family new house construction building permits:
- 2022: 4006 buildings, average cost: $283,400
- 2021: 4127 buildings, average cost: $240,600
- 2020: 4002 buildings, average cost: $254,500
- 2019: 4145 buildings, average cost: $258,500
- 2018: 3915 buildings, average cost: $243,400
- 2017: 4252 buildings, average cost: $233,100
- 2016: 2850 buildings, average cost: $243,600
- 2015: 2882 buildings, average cost: $241,500
- 2014: 2148 buildings, average cost: $234,000
- 2013: 2040 buildings, average cost: $220,800
- 2012: 1381 buildings, average cost: $219,400
- 2011: 1103 buildings, average cost: $202,400
- 2010: 1260 buildings, average cost: $183,700
- 2009: 1481 buildings, average cost: $198,500
- 2008: 1976 buildings, average cost: $179,900
- 2007: 6302 buildings, average cost: $192,200
- 2006: 12616 buildings, average cost: $170,200
- 2005: 15135 buildings, average cost: $141,900
- 2004: 13960 buildings, average cost: $153,800
- 2003: 10541 buildings, average cost: $176,500
- 2002: 9126 buildings, average cost: $175,100
- 2001: 6818 buildings, average cost: $178,600
- 2000: 5767 buildings, average cost: $173,100
- 1999: 6528 buildings, average cost: $176,700
- 1998: 5616 buildings, average cost: $157,500
- 1997: 5101 buildings, average cost: $144,200
Median real estate property taxes paid for housing units with mortgages in 2022: $3,656 (0.7%)
Median real estate property taxes paid for housing units with no mortgage in 2022: $2,451 (0.6%)
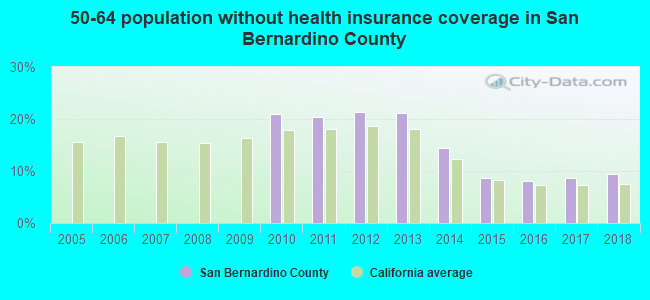
| San Bernardino County: | 13.4% |
| California: | 12.2% |
Median age of residents in 2022: 34.4 years old
(Males: 33.5 years old, Females: 35.4 years old)
(Median age for: White residents: 45.2 years old, Black residents: 34.7 years old, American Indian residents: 34.6 years old, Asian residents: 39.7 years old, Hispanic or Latino residents: 30.3 years old, Other race residents: 31.5 years old)
Area name: Riverside-San Bernardino-Ontario, CA MSA
Fair market rent in 2006 for a 1-bedroom apartment in San Bernardino County is $781 a month.
Fair market rent for a 2-bedroom apartment is $911 a month.
Fair market rent for a 3-bedroom apartment is $1294 a month.
Cities in this county include: San Bernardino, Ontario, Fontana, Rancho Cucamonga, Rialto, Upland, Chino, Chino Hills, Victorville, Redlands.
| Zip code | City | Number of tests | Number of tests >= 4 pCi/L |
|---|---|---|---|
| 91701 | Alta Loma | 32 | 0 |
| 91708 | Chino | 2 | 0 |
| 91709 | Chino Hills | 27 | 0 |
| 91710 | Chino | 14 | 0 |
| 91730 | Rancho Cucamonga | 34 | 0 |
| 91737 | Alta Loma | 18 | 2 |
| 91739 | Rancho Cucamonga | 14 | 0 |
| 91761 | Ontario | 7 | 0 |
| 91762 | Ontario | 19 | 0 |
| 91763 | Montclair | 3 | 0 |
| 91764 | Ontario | 22 | 1 |
| 91784 | Upland | 16 | 0 |
| 91785 | Upland | 1 | 0 |
| 91786 | Upland | 22 | 2 |
| 92242 | Earp | 1 | 0 |
| 92252 | Joshua Tree | 6 | 0 |
| 92256 | Morongo Valley | 2 | 1 |
| 92268 | Pioneertown | 2 | 0 |
| 92277 | Twentynine Palms | 17 | 0 |
| 92278 | Twentynine Palms | 773 | 14 |
| 92284 | Yucca Valley | 17 | 0 |
| 92285 | Landers | 2 | 0 |
| 92286 | Yucca Valley | 1 | 0 |
| 92301 | Adelanto | 7 | 0 |
| 92307 | Apple Valley | 27 | 1 |
| 92308 | Apple Valley | 8 | 0 |
| 92310 | Fort Irwin | 22 | 0 |
| 92311 | Barstow | 36 | 2 |
| 92312 | Barstow | 2 | 0 |
| 92313 | Grand Terrace | 4 | 0 |
| 92314 | Big Bear City | 8 | 1 |
| 92315 | Big Bear Lake | 3 | 0 |
| 92316 | Bloomington | 2 | 0 |
| 92317 | Blue Jay | 4 | 3 |
| 92322 | Cedarpines Park | 1 | 1 |
| 92324 | Colton | 10 | 0 |
| 92325 | Crestline | 19 | 12 |
| 92326 | Crest Park | 1 | 0 |
| 92329 | Phelan | 2 | 0 |
| 92335 | Fontana | 34 | 0 |
| 92336 | Fontana | 16 | 0 |
| 92337 | Fontana | 3 | 0 |
| 92338 | Ludlow | 1 | 0 |
| 92340 | Hesperia | 2 | 0 |
| 92341 | Green Valley Lake | 15 | 11 |
| 92342 | Helendale | 4 | 0 |
| 92345 | Hesperia | 6 | 0 |
| 92346 | Highland | 17 | 0 |
| 92347 | Hinkley | 1 | 0 |
| 92352 | Lake Arrowhead | 6 | 1 |
| 92354 | Loma Linda | 10 | 0 |
| 92356 | Lucerne Valley | 5 | 3 |
| 92358 | Lytle Creek | 1 | 0 |
| 92359 | Mentone | 4 | 0 |
| 92363 | Needles | 55 | 0 |
| 92366 | Mountain Pass | 27 | 4 |
| 92371 | Phelan | 1 | 0 |
| 92373 | Redlands | 29 | 0 |
| 92374 | Redlands | 85 | 0 |
| 92376 | Rialto | 12 | 0 |
| 92377 | Rialto | 4 | 0 |
| 92382 | Running Springs | 5 | 2 |
| 92386 | Sugarloaf | 3 | 0 |
| 92391 | Twin Peaks | 7 | 1 |
| 92392 | Victorville | 17 | 0 |
| 92393 | Victorville | 1 | 0 |
| 92395 | Victorville | 4 | 0 |
| 92397 | Wrightwood | 9 | 1 |
| 92398 | Yermo | 2 | 0 |
| 92399 | Yucaipa | 10 | 0 |
| 92401 | San Bernardino | 3 | 0 |
| 92404 | San Bernardino | 10 | 0 |
| 92405 | San Bernardino | 6 | 0 |
| 92407 | San Bernardino | 7 | 0 |
| 92410 | San Bernardino | 1 | 0 |
| 92412 | San Bernardino | 1 | 0 |
| 92416 | San Bernardino | 1 | 0 |
| 93558 | Red Mountain | 1 | 0 |
2023 air pollution in San Bernardino County:
Carbon Monoxide: 0.216 ppm (standard limit: 9 ppm). Near U.S. average.
Nitrogen Dioxide: 0.01 ppm (standard limit: 0.053 ppm). Above U.S. average.
Ozone (1-hour): 0.037 ppm (standard limit: 0.12 ppm). Near U.S. average.
Particulate Matter (PM10) Annual: 26.2 µg/m3. Near U.S. average.
Particulate Matter (PM2.5) Annual: 6.7 µg/m3(standard limit: 15.0 µg/m3). Near U.S. average.
Sulfur Oxides Annual: 0.000 ppm (standard limit: 0.03 ppm). Near U.S. average.
Notable locations in this county outside city limits:
Notable locations in San Bernardino County: Kern County Police Radio Relay Station (A), Old Hart Station (B), Myer Ranch (C), Jim Hill Gun Club (D), Hoover Ranch (E), Gutzier Ranch (F), Gilbreath Gun Club (G), Beverly Gun Club (H), Lazells Ranch (I), Knox Ranch (J), Shead Ranch (K), Tungsten Chief Mill (L), Williams Ranch (M), Arkelo Ranch (N), A M Cooper Ranch (O), Oak Flat Lookout (P), Hodgeman Ranch (Q), Old Likely Mill (R), Hog Camp (S), Onyx Ranch (T). Display/hide their locations on the map
Shopping Centers: Sagebrush Shopping Center (1), Hillcrest Shopping Center (2). Display/hide their locations on the map
Churches in San Bernardino County include: Church of the Redeemer and Hope (A), Community Bible Fellowship Church (B), Iglesia Evangelica Encuento (C), Bakersfield Christian Life Center (D), Pentecostal Holiness Church (E), West Coast Baptist Church (F), East Hills Nazarene Church (G), Faith Temple Pentecostal Church of God (H), First Southern Hispanic Baptist Church (I). Display/hide their locations on the map
Cemeteries: Mount Owens Cemetery (1), Blue Mountain Cemetery (2), Hillcrest Memorial Park Cemetery (3), Oak Grove Cemetery (4), Bakersfield National Cemetery (5), Shafter Cemetery (6), Westside District Cemetery (7). Display/hide their locations on the map
Lakes and reservoirs: Lake Webb (A), Lake Evans (B), Buckhorn Lake (C), Rogers Lake (D), Castac Lake (E), Still Lake (F), Connecting Slough (G), Lake Marion (H). Display/hide their locations on the map
Streams, rivers, and creeks: Goose Lake Slough (A), Franciscan Creek (B), Fay Creek (C), Falls Creek (D), El Paso Creek (E), Dyer Creek (F), Dry Meadow Creek (G), Deep Creek (H), Cummings Creek (I). Display/hide their locations on the map
Parks in San Bernardino County include: Rose Stage Station Historical Marker (1), Live Oak Picnic Area (2), Kern River County Park (3), Buena Vista Aquatic Recreational Area (4), Red Rock Canyon State Park (5), Tomo-Kahni State Historic Park (6), Greenhorn Mountain County Park (7), Branch Memorial Park (8), Buena Vista Park (9). Display/hide their locations on the map
Neighboring counties: Colbert County, Alabama  , Calloway County, Kentucky , Custer County, Oklahoma , James City County, Virginia , Perry County, Arkansas , Madison County, Tennessee , Sharp County, Arkansas , Habersham County, Georgia .
| Here: | 5.0% |
| California: | 5.1% |
Current college students: 108,262
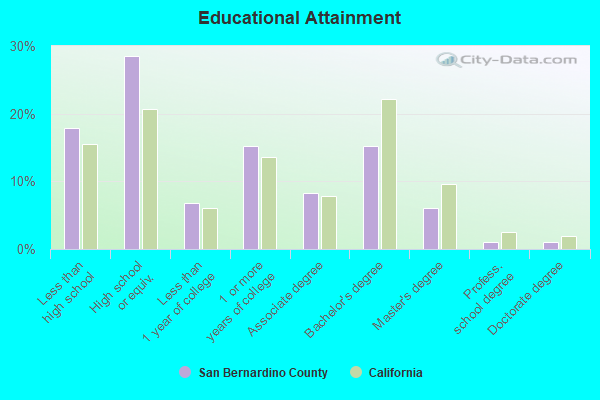
People 25 years of age or older with a high school degree or higher: 82.0%
People 25 years of age or older with a bachelor's degree or higher: 23.0%
Number of foreign born residents: 472,505 (52.3% naturalized citizens)
| San Bernardino County: | 21.5% |
| Whole state: | 26.7% |
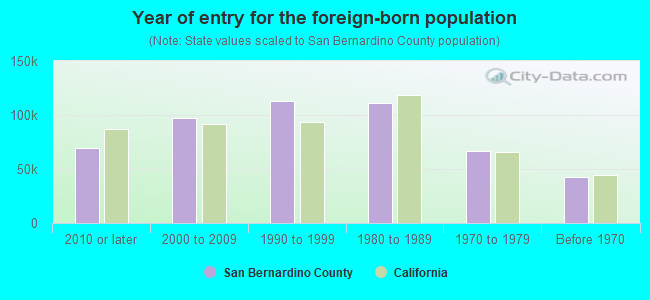
- Year of entry for the foreign-born population
- 82,5852010 or later
- 98,8092000 to 2009
- 106,2311990 to 1999
- 111,3061980 to 1989
- 66,8411970 to 1979
- 42,233Before 1970
Mean travel time to work (commute): minutes
Percentage of county residents living and working in this county: 99.5%
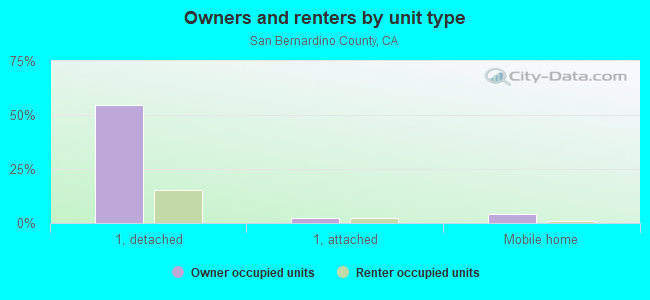
Housing units in structures:
- One, detached: 522,056
- One, attached: 34,527
- Two: 12,959
- 3 or 4: 34,820
- 5 to 9: 23,858
- 10 to 19: 19,526
- 20 to 49: 14,709
- 50 or more: 39,045
- Mobile homes: 40,125
- Boats, RVs, vans, etc.: 511
Housing units in San Bernardino County with a mortgage: 289,537 (21,023 second mortgage, 570 home equity loan, 15,551 both second mortgage and home equity loan)
Houses without a mortgage: 3,047
| Here: | 99.0% with mortgage |
| State: | 98.6% with mortgage |
Religion statistics for San Bernardino County
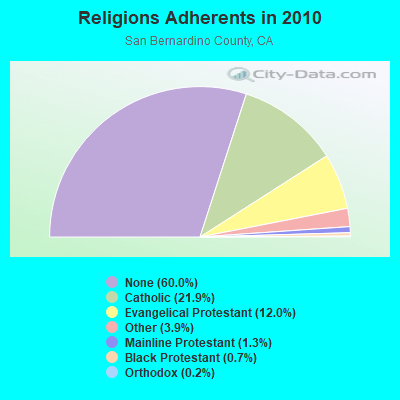
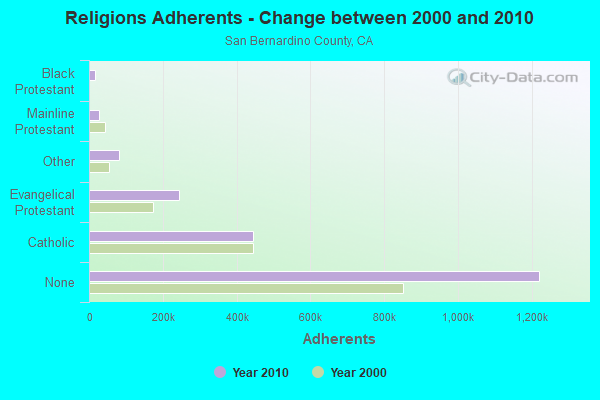
| Religion | Adherents | Congregations |
|---|---|---|
| Catholic | 445,334 | 55 |
| Evangelical Protestant | 243,524 | 832 |
| Other | 80,047 | 205 |
| Mainline Protestant | 26,062 | 135 |
| Black Protestant | 14,969 | 37 |
| Orthodox | 3,868 | 10 |
| None | 1,221,406 | - |
Source: Clifford Grammich, Kirk Hadaway, Richard Houseal, Dale E.Jones, Alexei Krindatch, Richie Stanley and Richard H.Taylor. 2012. 2010 U.S.Religion Census: Religious Congregations & Membership Study. Association of Statisticians of American Religious Bodies. Jones, Dale E., et al. 2002. Congregations and Membership in the United States 2000. Nashville, TN: Glenmary Research Center.
Food Environment Statistics:
| San Bernardino County: | 1.50 / 10,000 pop. |
| State: | 2.14 / 10,000 pop. |
| Here: | 0.05 / 10,000 pop. |
| California: | 0.04 / 10,000 pop. |
| This county: | 0.57 / 10,000 pop. |
| California: | 0.62 / 10,000 pop. |
| San Bernardino County: | 1.60 / 10,000 pop. |
| California: | 1.49 / 10,000 pop. |
| This county: | 4.69 / 10,000 pop. |
| State: | 7.42 / 10,000 pop. |
| San Bernardino County: | 7.4% |
| California: | 7.3% |
| San Bernardino County: | 27.1% |
| State: | 21.3% |
| Here: | 16.2% |
| State: | 17.9% |
Agriculture in San Bernardino County:
Average size of farms: 371 acresAverage value of agricultural products sold per farm: $445,776
Average value of crops sold per acre for harvested cropland: $3189.01
The value of nursery, greenhouse, floriculture, and sod as a percentage of the total market value of agricultural products sold: 10.21%
The value of livestock, poultry, and their products as a percentage of the total market value of agricultural products sold: 80.51%
Average total farm production expenses per farm: $367,895
Harvested cropland as a percentage of land in farms: 7.35%
Irrigated harvested cropland as a percentage of land in farms: 89.31%
Average market value of all machinery and equipment per farm: $72,654
The percentage of farms operated by a family or individual: 84.05%
Average age of principal farm operators: 57 years
Average number of cattle and calves per 100 acres of all land in farms: 52.83
Milk cows as a percentage of all cattle and calves: 58.32%
Vegetables: 3,875 harvested acres
Land in orchards: 8,413 acres
Tornado activity:
San Bernardino County historical area-adjusted tornado activity is significantly below California state average. It is 1991170094.5 times below overall U.S. average.Earthquake activity:
San Bernardino County-area historical earthquake activity is significantly above California state average. It is 7471% greater than the overall U.S. average.On 6/28/1992 at 11:57:34, a magnitude 7.6 (6.2 MB, 7.6 MS, 7.3 MW, Depth: 0.7 mi, Class: Major, Intensity: VIII - XII) earthquake occurred 29.5 miles away from San Bernardino County center, causing 3 deaths (1 shaking deaths, 2 other deaths) and 400 injuries, causing $100,000,000 total damage and $40,000,000 insured losses
On 10/16/1999 at 09:46:44, a magnitude 7.4 (6.3 MB, 7.4 MS, 7.2 MW, 7.3 ML) earthquake occurred 32.4 miles away from the county center
On 7/21/1952 at 11:52:14, a magnitude 7.7 (7.7 UK) earthquake occurred 122.2 miles away from the county center, causing $50,000,000 total damage
On 6/28/1992 at 15:05:30, a magnitude 6.9 (6.3 MB, 6.7 MS, 6.5 MW, 6.9 ME, Depth: 3.1 mi, Class: Strong, Intensity: VII - IX) earthquake occurred 11.8 miles away from the county center
On 5/19/1940 at 04:36:40, a magnitude 7.2 (7.2 UK) earthquake occurred 109.6 miles away from San Bernardino County center, causing $33,000,000 total damage
On 4/21/1918 at 22:32:30, a magnitude 6.8 (6.8 UK) earthquake occurred 47.9 miles away from the county center
Magnitude types: body-wave magnitude (MB), energy magnitude (ME), local magnitude (ML), surface-wave magnitude (MS), moment magnitude (MW)
Most recent natural disasters:
- California Wildfires, Incident Period: September 4, 2020 - November 17, 2020, FEMA Id: 4569, Natural disaster type: Fire
- California Covid-19 Pandemic, Incident Period: January 20, 2020, FEMA Id: 4482, Natural disaster type: Other
- California Hill Fire, Incident Period: September 02, 2011 to September 05, 2011, Fire Management Assistance Declared: September 02, 2011, FEMA Id: 2955, Natural disaster type: Fire
- California Winter Storms, Flooding, and Debris and Mud Flows, Incident Period: December 17, 2010 to January 04, 2011, Major Disaster (Presidential) Declared DR-1952: January 26, 2011, FEMA Id: 1952, Natural disaster type: Winter Storm, Flood
- California Severe Winter Storms, Flooding, and Debris and Mud Flows, Incident Period: January 17, 2010 to February 06, 2010, Major Disaster (Presidential) Declared DR-1884: March 08, 2010, FEMA Id: 1884, Natural disaster type: Winter Storm, Flood
- California Sheep Fire, Incident Period: October 03, 2009 to October 09, 2009, Fire Management Assistance Declared: October 04, 2009, FEMA Id: 2841, Natural disaster type: Fire
- California Pendleton Fire, Incident Period: August 31, 2009 to September 05, 2009, Fire Management Assistance Declared: September 01, 2009, FEMA Id: 2836, Natural disaster type: Fire
- California Oak Glen Fire, Incident Period: August 30, 2009 to September 08, 2009, Fire Management Assistance Declared: August 31, 2009, FEMA Id: 2833, Natural disaster type: Fire
- California Freeway Complex Fire, Incident Period: November 15, 2008 to November 20, 2008, Fire Management Assistance Declared: November 15, 2008, FEMA Id: 2792, Natural disaster type: Fire
- California Grass Valley Fire, Incident Period: October 22, 2007 to December 31, 1969, Fire Management Assistance Declared: October 22, 2007, FEMA Id: 2738, Natural disaster type: Fire
- 36 other natural disasters have been reported since 1953.
The number of natural disasters in San Bernardino County (46) is a lot greater than the US average (15).
Major Disasters (Presidential) Declared: 27
Emergencies Declared: 2
Causes of natural disasters: Fires: 24, Floods: 18, Storms: 9, Winter Storms: 6, Landslides: 5, Mudslides: 4, Heavy Rains: 2, Earthquake: 1, Flash Flood: 1, Freeze: 1, Hurricane: 1, Snow: 1, Tornado: 1, Tropical Storm: 1, Wind: 1, Other: 1 (Note: some incidents may be assigned to more than one category).
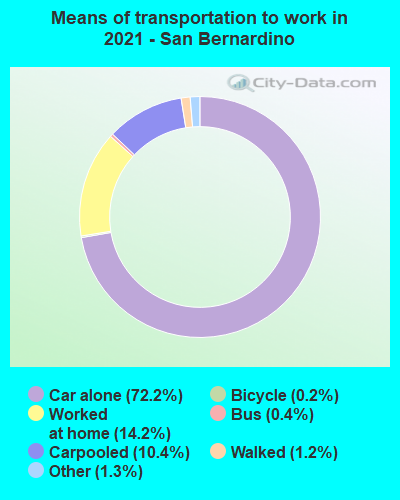
Means of transportation to work:
- Drove a car alone: 691,255 (73.8%)
- Carpooled: 102,978 (11.0%)
- Bus: 4,597 (0.5%)
- Subway or elevated rail: 33 (0.0%)
- Long-distance train or commuter rail: 162 (0.0%)
- Light rail, streetcar or trolley: 78 (0.0%)
- Ferryboat: 125 (0.0%)
- Taxicab, motorcycle, or other means: 13,182 (1.4%)
- Bicycle: 1,607 (0.2%)
- Walked: 15,917 (1.7%)
- Worked at home: 106,858 (11.4%)
- Health care and social assistance (17%)
- Retail trade (11%)
- Educational services (10%)
- Transportation and warehousing (7%)
- Accommodation and food services (7%)
- Public administration (5%)
- Professional, scientific, and technical services (4%)

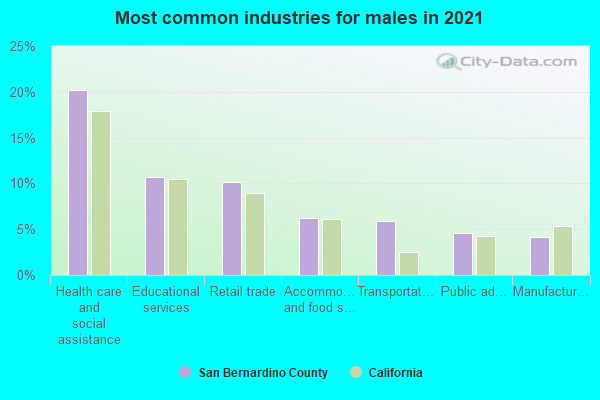
- Health care and social assistance (21%)
- Retail trade (13%)
- Educational services (13%)
- Transportation and warehousing (9%)
- Accommodation and food services (8%)
- Public administration (6%)
- Professional, scientific, and technical services (5%)
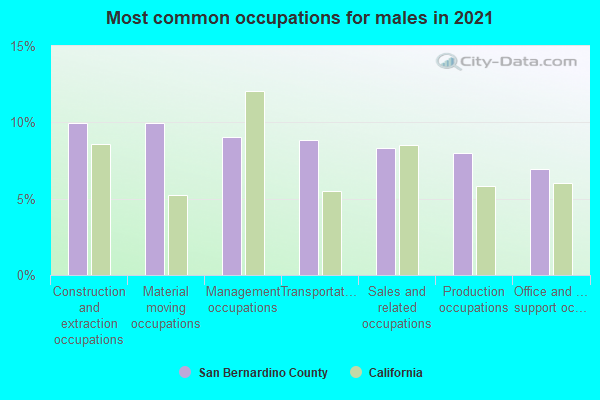
- Construction and extraction occupations (11%)
- Material moving occupations (11%)
- Transportation occupations (10%)
- Management occupations (8%)
- Sales and related occupations (8%)
- Production occupations (7%)
- Office and administrative support occupations (6%)
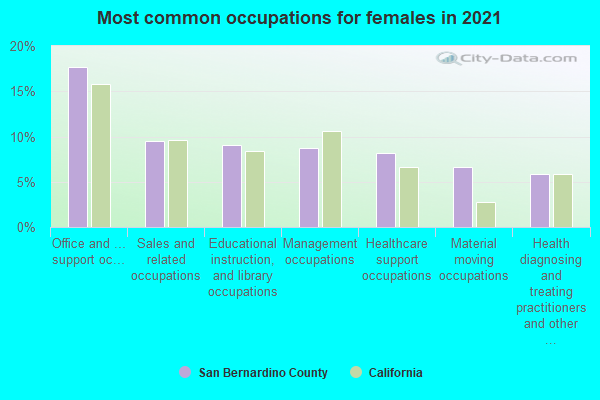
- Office and administrative support occupations (18%)
- Sales and related occupations (10%)
- Management occupations (8%)
- Educational instruction, and library occupations (8%)
- Material moving occupations (7%)
- Healthcare support occupations (7%)
- Food preparation and serving related occupations (7%)
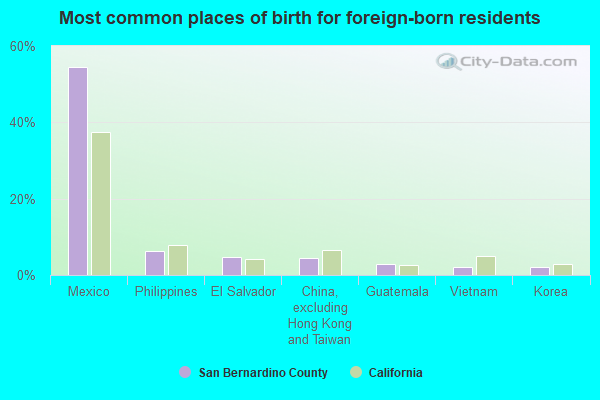
- Mexico (54%)
- Philippines (6%)
- China, excluding Hong Kong and Taiwan (5%)
- El Salvador (4%)
- Guatemala (3%)
- Vietnam (2%)
- Korea (2%)
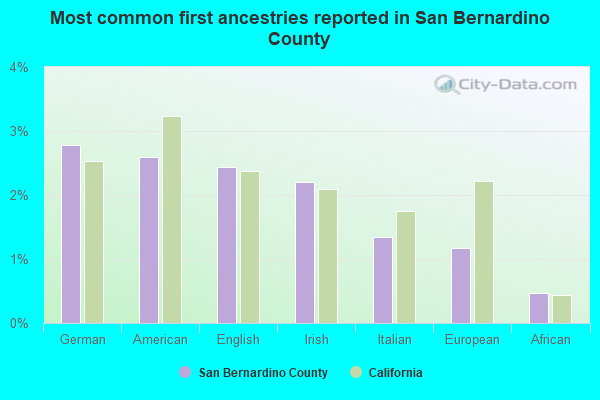
- American (3%)
- German (2%)
- English (2%)
- Irish (2%)
- Italian (1%)
- European (1%)
- African (0%)
People in group quarters in San Bernardino County, California in 2010:
- 6,491 people in federal prisons
- 6,316 people in local jails and other municipal confinement facilities
- 6,036 people in state prisons
- 4,718 people in military barracks and dormitories (nondisciplinary)
- 4,501 people in nursing facilities/skilled-nursing facilities
- 2,867 people in college/university student housing
- 2,673 people in group homes intended for adults
- 1,831 people in other noninstitutional facilities
- 1,506 people in mental (psychiatric) hospitals and psychiatric units in other hospitals
- 906 people in workers' group living quarters and job corps centers
- 835 people in residential treatment centers for adults
- 570 people in emergency and transitional shelters (with sleeping facilities) for people experiencing homelessness
- 314 people in residential treatment centers for juveniles (non-correctional)
- 268 people in group homes for juveniles (non-correctional)
- 187 people in correctional facilities intended for juveniles
- 23 people in in-patient hospice facilities
- 12 people in correctional residential facilities
People in group quarters in San Bernardino County, California in 2000:
- 11,002 people in state prisons
- 7,107 people in military barracks, etc.
- 4,767 people in nursing homes
- 4,699 people in local jails and other confinement facilities (including police lockups)
- 3,847 people in wards in military hospitals for patients who have no usual home elsewhere
- 3,641 people in other noninstitutional group quarters
- 1,776 people in other nonhousehold living situations
- 1,590 people in college dormitories (includes college quarters off campus)
- 1,466 people in homes for the mentally retarded
- 1,217 people in other types of correctional institutions
- 998 people in other group homes
- 681 people in training schools for juvenile delinquents
- 577 people in homes or halfway houses for drug/alcohol abuse
- 304 people in homes for the mentally ill
- 253 people in homes for the physically handicapped
- 213 people in mental (psychiatric) hospitals or wards
- 186 people in job corps and vocational training facilities
- 164 people in other workers' dormitories
- 126 people in homes for abused, dependent, and neglected children
- 108 people in hospitals/wards and hospices for chronically ill
- 108 people in other hospitals or wards for chronically ill
- 103 people in religious group quarters
- 100 people in unknown juvenile institutions
- 41 people in halfway houses
- 40 people in residential treatment centers for emotionally disturbed children
- 11 people in agriculture workers' dormitories on farms
- 6 people in schools, hospitals, or wards for the intellectually disabled
- 5 people in orthopedic wards and institutions for the physically handicapped
- 4 people in military transient quarters for temporary residents
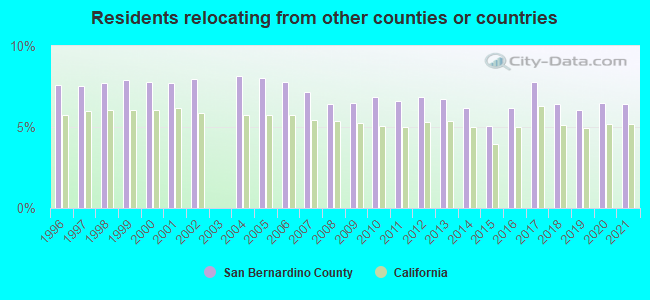
6.45% of this county's 2021 resident taxpayers lived in other counties in 2020 ($54,954 average adjusted gross income)
| Here: | 6.45% |
| California average: | 5.19% |
0.03% of residents moved from foreign countries ($259 average AGI)
San Bernardino County: 0.03% California average: 0.03%
5.14% relocated from other counties in California ($45,349 average AGI)
1.28% relocated from other states ($9,346 average AGI)
San Bernardino County: 1.28% California average: 1.56%
Top counties from which taxpayers relocated into this county between 2020 and 2021:
| from Los Angeles County, CA | |
| from Riverside County, CA | |
| from Orange County, CA | |
| from San Diego County, CA | |
| from Clark County, NV | |
| from Maricopa County, AZ | |
| from Kern County, CA |
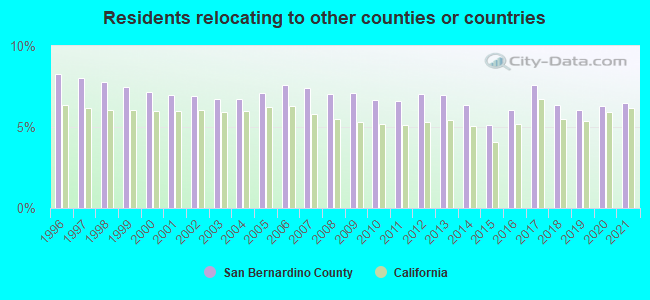
6.46% of this county's 2020 resident taxpayers moved to other counties in 2021 ($59,647 average adjusted gross income)
| Here: | 6.46% |
| California average: | 6.14% |
0.03% of residents moved to foreign countries ($253 average AGI)
San Bernardino County: 0.03% California average: 0.02%
3.95% relocated to other counties in California ($35,783 average AGI)
2.48% relocated to other states ($23,611 average AGI)
San Bernardino County: 2.48% California average: 2.55%
Top counties to which taxpayers relocated from this county between 2020 and 2021:
| to Riverside County, CA | |
| to Los Angeles County, CA | |
| to Orange County, CA | |
| to San Diego County, CA | |
| to Clark County, NV | |
| to Maricopa County, AZ | |
| to Mohave County, AZ |
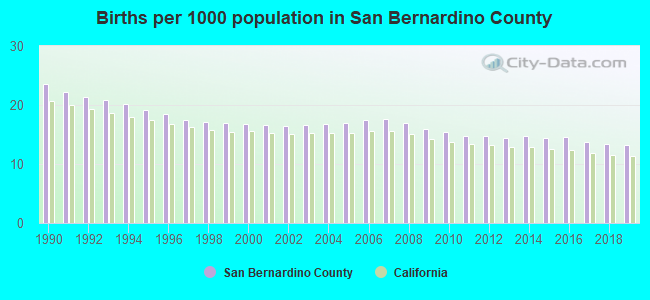
Births per 1000 population from 1990 to 1999: 19.7
Births per 1000 population from 2000 to 2009: 16.8
Births per 1000 population from 2010 to 2022: 12.0
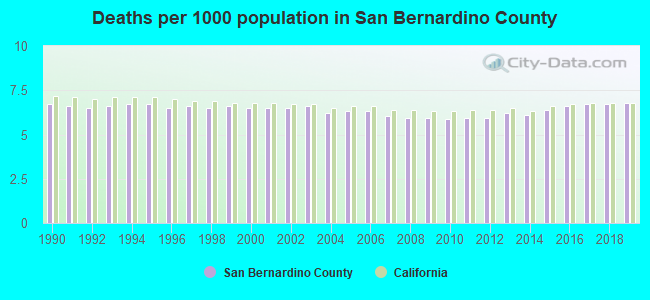
Deaths per 1000 population from 1990 to 1999: 6.6
Deaths per 1000 population from 2000 to 2009: 6.3
Deaths per 1000 population from 2010 to 2020: 6.6
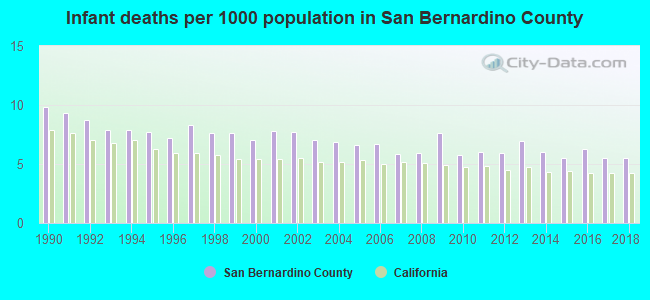
Infant deaths per 1000 live births from 1990 to 1999: 8.2
Infant deaths per 1000 live births from 2000 to 2009: 6.9
Infant deaths per 1000 live births from 2010 to 2021: 5.9
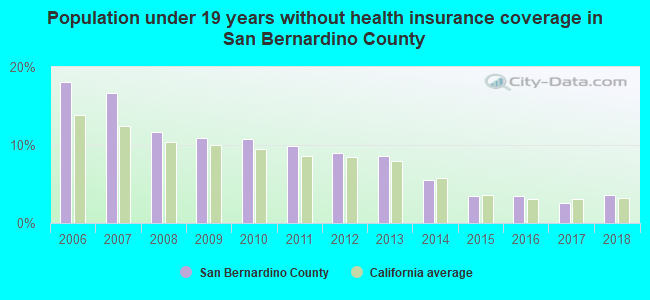
Persons under 19 years old without health insurance coverage in 2018: 3.6%
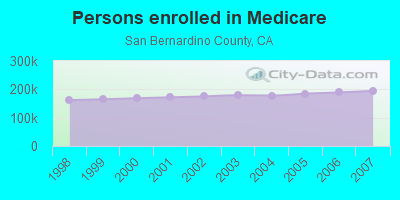
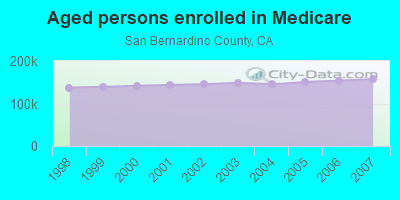
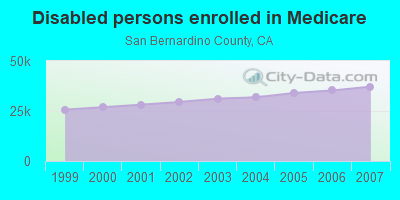
Persons enrolled in hospital insurance and/or supplemental medical insurance (Medicare) in July 1, 2007: 194,510 (157,334 aged, 37,176 disabled)
Children under 18 without health insurance coverage in 2007: 93,134 (16%)
Most common underlying causes of death in San Bernardino County, California in 1999 - 2019:
- Atherosclerotic heart disease (24,505)
- Chronic obstructive pulmonary disease, unspecified (13,615)
- Bronchus or lung, unspecified - Malignant neoplasms (12,864)
- Acute myocardial infarction, unspecified (11,900)
- Alzheimer disease, unspecified (8,944)
- Atherosclerotic cardiovascular disease, so described (6,923)
- Stroke, not specified as haemorrhage or infarction (6,588)
- Hypertensive heart disease without (congestive) heart failure (6,358)
- Congestive heart failure (5,340)
- Breast, unspecified - Malignant neoplasms (4,677)
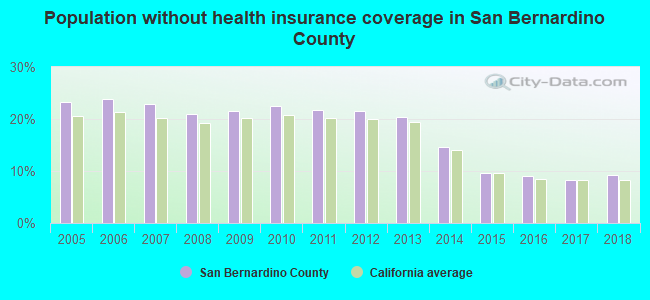
Population without health insurance coverage in 2000: 20%
Children under 18 without health insurance coverage in 2000: 16%
Homicides per 1,000,000 population from 2000 to 2006: 88.0. This is less than state average.
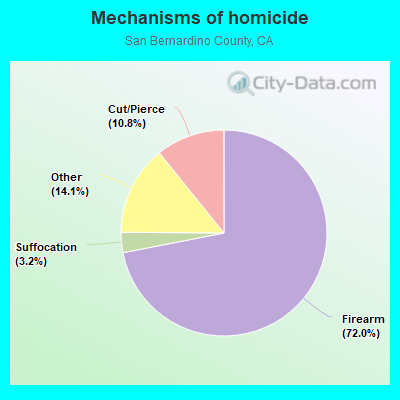
- Firearm - 63.3
- Cut/Pierce - 9.5
- Suffocation - 2.8
- Other - 12.4
Suicides per 1,000,000 population from 2000 to 2006: 94.4. This is less than state average.
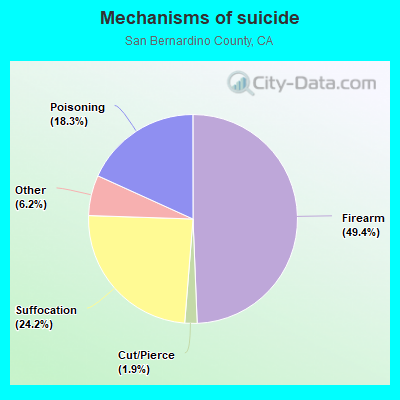
- Firearm - 46.6
- Suffocation - 22.9
- Poisoning - 17.2
- Cut/Pierce - 1.8
- Other - 5.9
Household type by relationship:
Households: 2,193,656- Male householders: 334,118 (56,897 living alone), Female householders: 340,073 (63,153 living alone)
350,432 spouses (346,590 opposite-sex spouses), 54,945 unmarried partners, (52,111 opposite-sex unmarried partners), 761,060 children (722,014 natural, 12,145 adopted, 26,901 stepchildren), 79,468 grandchildren, 41,079 brothers or sisters, 56,059 parents, 3,354 foster children, 70,291 other relatives, 64,901 non-relatives
- In group quarters: 37,876
Size of family households: 157,828 2-persons, 117,239 3-persons, 108,588 4-persons, 69,782 5-persons, 32,805 6-persons, 27,767 7-or-more-persons.
Size of nonfamily households: 120,050 1-person, 31,377 2-persons, 4,536 3-persons, 2,206 4-persons, 892 5-persons, 679 6-persons, 442 7-or-more-persons.
323,422 married couples with children.
138,968 single-parent households (44,830 men, 94,138 women).
54.3% of residents of San Bernardino speak English at home.
37.4% of residents speak Spanish at home (69% speak English very well, 14% speak English well, 11% speak English not well, 6% don't speak English at all).
1.5% of residents speak other Indo-European language at home (72% speak English very well, 17% speak English well, 8% speak English not well, 3% don't speak English at all).
5.6% of residents speak Asian or Pacific Island language at home (52% speak English very well, 27% speak English well, 15% speak English not well, 5% don't speak English at all).
1.2% of residents speak other language at home (70% speak English very well, 21% speak English well, 8% speak English not well, 1% don't speak English at all).
In fiscal year 2004:
Federal Government expenditure: $8,288,770,000 ($4,315 per capita)
Department of Defense expenditure: $1,449,960,000
Federal direct payments to individuals for retirement and disability: $2,975,106,000
Federal other direct payments to individuals: $1,716,182,000
Federal direct payments not to individuals: $10,293,000
Federal grants: $1,684,027,000
Federal procurement contracts: $776,971,000 ($559,497,000 Department of Defense)
Federal salaries and wages: $1,126,190,000 ($650,114,000 Department of Defense)
Federal Government direct loans: $155,329,000
Federal guaranteed/insured loans: $1,506,051,000
Federal Government insurance: $983,158,000
Population change from April 1, 2000 to July 1, 2005:
Births: 157,267| Here: | 80 per 1000 residents |
| State: | 77 per 1000 residents |
Deaths: 61,060
| Here: | 31 per 1000 residents |
| State: | 34 per 1000 residents |
Net international migration: +39,466
| Here: | +20 per 1000 residents |
| State: | +39 per 1000 residents |
Net internal migration: +120,496
| Here: | |
| State: |
Total withdrawal of fresh water for public supply: 372.18 millions of gallons per day (75% from ground, 25% from surface)
| Here: | 6.1 |
| State: | 6.0 |
| Here: | 4.3 |
| State: | 3.9 |
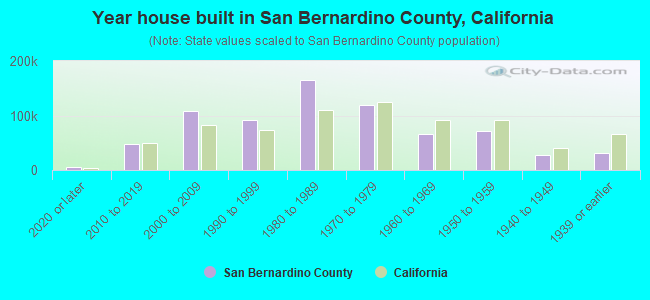
- Year house built in San Bernardino County, California
- 11,5902020 or later
- 46,7042010 to 2019
- 107,0922000 to 2009
- 89,4951990 to 1999
- 173,2451980 to 1989
- 115,8571970 to 1979
- 67,1991960 to 1969
- 75,8641950 to 1959
- 27,7041940 to 1949
- 27,3861939 or earlier
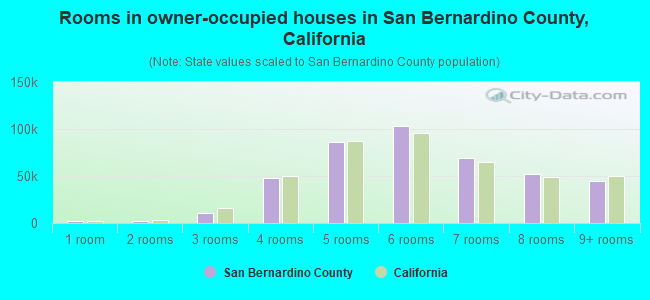
- Rooms in owner-occupied houses in San Bernardino County, California
- 3,0391 room
- 1,9192 rooms
- 11,9013 rooms
- 45,0854 rooms
- 90,5125 rooms
- 98,4596 rooms
- 70,8947 rooms
- 54,7948 rooms
- 45,4579+ rooms
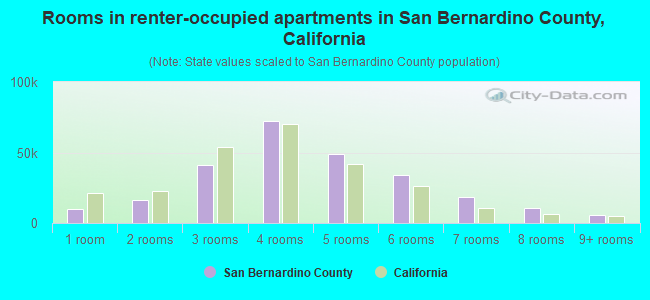
- Rooms in renter-occupied apartments in San Bernardino County, California
- 14,2111 room
- 13,0102 rooms
- 39,8363 rooms
- 75,9294 rooms
- 48,7955 rooms
- 30,5466 rooms
- 15,0267 rooms
- 10,4878 rooms
- 4,2919+ rooms
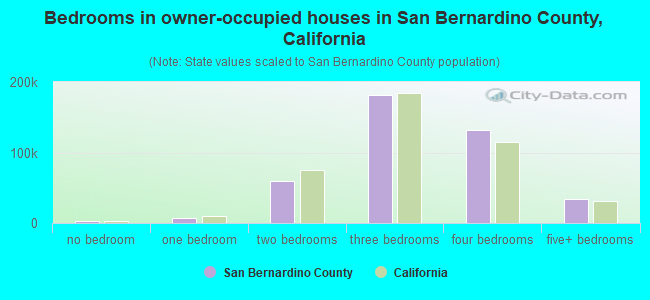
- Bedrooms in owner-occupied houses in San Bernardino County, California
- 4,017no bedroom
- 6,5351 bedroom
- 57,6092 bedrooms
- 192,8083 bedrooms
- 130,4674 bedrooms
- 30,6245+ bedrooms
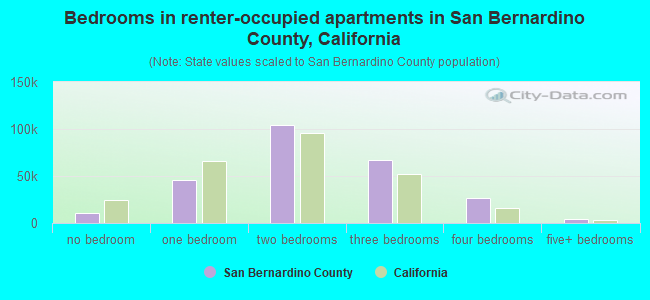
- Bedrooms in renter-occupied apartments in San Bernardino County, California
- 14,720no bedroom
- 40,3311 bedroom
- 106,1192 bedrooms
- 64,1513 bedrooms
- 22,1464 bedrooms
- 4,6645+ bedrooms
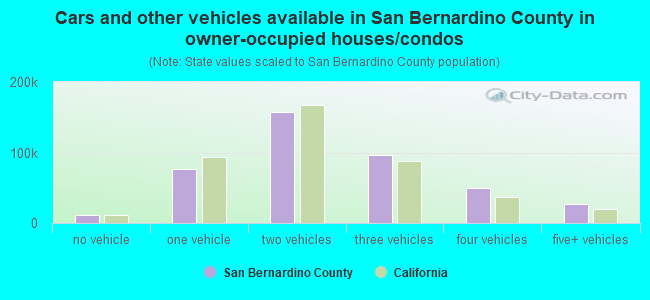
- Cars and other vehicles available in San Bernardino County in owner-occupied houses/condos
- 9,376no vehicle
- 74,6331 vehicle
- 158,3442 vehicles
- 101,2603 vehicles
- 51,3794 vehicles
- 27,0685+ vehicles
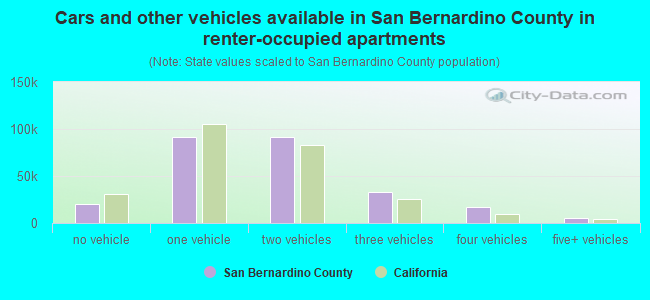
- Cars and other vehicles available in San Bernardino County in renter-occupied apartments
- 19,524no vehicle
- 90,2491 vehicle
- 90,4442 vehicles
- 34,5383 vehicles
- 11,8504 vehicles
- 5,5265+ vehicles
90.3% of San Bernardino County residents lived in the same house 1 years ago.
Out of people who lived in different houses, 37% lived in this county.
Out of people who lived in different counties, 72% lived in California.
| San Bernardino County: | 90.3% |
| State average: | 88.9% |
Place of birth for U.S.-born residents:
- This state: 1,450,053
- Other state: 245,424
- Northeast: 48,312
- Midwest: 72,679
- South: 73,959
- West: 50,474
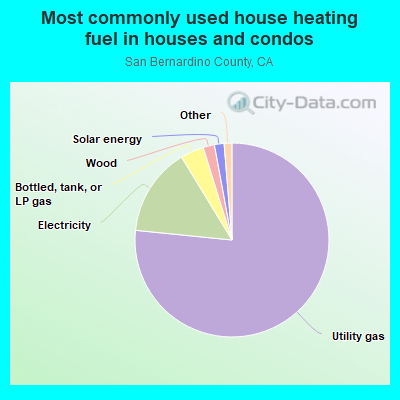
- 74.7%Utility gas
- 16.6%Electricity
- 3.4%Bottled, tank, or LP gas
- 1.8%Solar energy
- 1.5%Wood
- 1.3%No fuel used
- 0.5%Other fuel
- 0.2%Fuel oil, kerosene, etc.
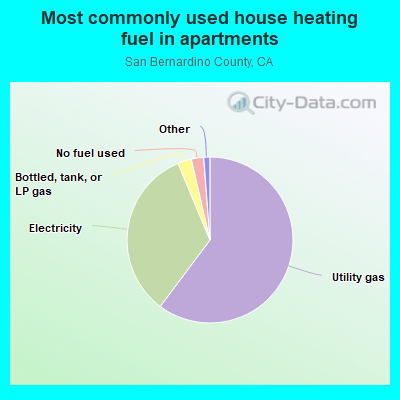
- 60.2%Utility gas
- 33.1%Electricity
- 2.8%Bottled, tank, or LP gas
- 2.1%No fuel used
- 1.1%Wood
- 0.3%Solar energy
- 0.3%Other fuel
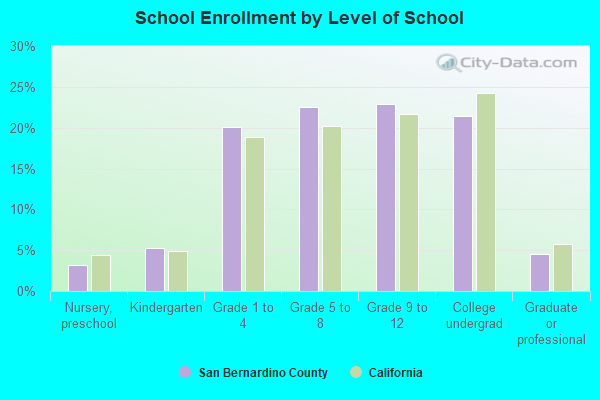
Private vs. public school enrollment:
| Here: | 5.9% |
| California: | 10.5% |
| Here: | 5.6% |
| California: | 8.5% |
| Here: | 16.6% |
| California: | 15.9% |
San Bernardino County government finances - Expenditure in 2018:
- Assistance and Subsidies - Public Welfare, Cash Assistance Programs - Other: $657,458,000
Public Welfare, Cash Assistance Programs - Other: $567,263,000
- Bond Funds - Cash and Securities: $275,022,000
Cash and Securities: $37,385,000
- Charges - Other: $525,240,000
Other: $456,708,000
Hospital Public: $366,535,000
Hospital Public: $329,140,000
Air Transportation: $93,227,000
Solid Waste Management: $92,447,000
Air Transportation: $84,911,000
Solid Waste Management: $83,612,000
Sewerage: $9,698,000
Parks and Recreation: $8,509,000
Parks and Recreation: $8,386,000
Regular Highways: $6,180,000
Regular Highways: $5,138,000
Sewerage: $4,723,000
Natural Resources - Other: $3,478,000
Natural Resources - Other: $3,127,000
Elementary and Secondary Education - Other: $28,000
Elementary and Secondary Education - Other: $26,000
- Construction - Natural Resources - Other: $52,245,000
Natural Resources - Other: $13,253,000
Elementary and Secondary Education: $12,417,000
Local Fire Protection: $8,853,000
Housing and Community Development: $5,028,000
Local Fire Protection: $4,701,000
Elementary and Secondary Education: $4,081,000
Parks and Recreation: $3,084,000
General - Other: $1,035,000
Parks and Recreation: $999,000
- Current Operations - Public Welfare - Other: $539,278,000
Public Welfare - Other: $504,470,000
Health - Other: $479,061,000
Hospitals: $466,910,000
Hospitals: $410,699,000
Health - Other: $392,059,000
Police Protection: $335,239,000
Police Protection: $330,783,000
Elementary and Secondary Education: $299,992,000
Elementary and Secondary Education: $263,941,000
General - Other: $239,314,000
Correctional Institutions: $226,780,000
Correctional Institutions: $193,989,000
Local Fire Protection: $190,412,000
Local Fire Protection: $178,359,000
Judicial and Legal Services: $144,065,000
Corrections - Other: $136,604,000
Judicial and Legal Services: $135,919,000
Corrections - Other: $118,402,000
Solid Waste Management: $88,228,000
Regular Highways: $80,954,000
Air Transportation: $73,461,000
Air Transportation: $69,094,000
Solid Waste Management: $68,050,000
Regular Highways: $56,471,000
Financial Administration: $50,847,000
Financial Administration: $44,550,000
General Public Buildings: $42,898,000
Central Staff Services: $41,714,000
General Public Buildings: $38,290,000
Central Staff Services: $35,948,000
General - Other: $35,035,000
Natural Resources - Other: $30,105,000
Natural Resources - Other: $27,374,000
Parks and Recreation: $23,486,000
Libraries: $16,262,000
Parks and Recreation: $16,182,000
Libraries: $15,192,000
Protective Inspection and Regulation - Other: $8,027,000
Sewerage: $7,925,000
Protective Inspection and Regulation - Other: $5,868,000
Water Utilities: $5,666,000
Water Utilities: $3,490,000
Sewerage: $2,538,000
- Federal Intergovernmental - Health and Hospitals: $188,059,000
Other: $172,152,000
Health and Hospitals: $155,426,000
Other: $103,165,000
Housing and Community Development: $12,036,000
Housing and Community Development: $10,104,000
Highways: $3,895,000
Highways: $3,725,000
General Local Government Support: $3,582,000
General Local Government Support: $3,373,000
Natural Resources: $2,754,000
Air Transportation: $1,731,000
Natural Resources: $396,000
Education: $288,000
Education: $229,000
Water Utilities: $59,000
- General - Interest on Debt: $126,801,000
Interest on Debt: $113,314,000
- Intergovernmental to Local - Other - Elementary and Secondary Education: $140,199,000
Other - Elementary and Secondary Education: $139,156,000
- Intergovernmental to State - Judicial and Legal Services: $24,261,000
Judicial and Legal Services: $23,832,000
- Local Intergovernmental - Health and Hospitals: $148,832,000
Health and Hospitals: $111,262,000
Education: $85,060,000
Education: $68,522,000
Other: $28,995,000
Other: $25,646,000
- Long Term Debt - Beginning Outstanding - Unspecified Public Purpose: $2,788,076,000
Outstanding Unspecified Public Purpose: $2,513,714,000
Beginning Outstanding - Unspecified Public Purpose: $1,448,997,000
Outstanding Unspecified Public Purpose: $1,204,483,000
Retired Unspecified Public Purpose: $523,668,000
Retired Unspecified Public Purpose: $287,257,000
Issue, Unspecified Public Purpose: $259,153,000
Beginning Outstanding - Public Debt for Private Purpose: $54,085,000
Outstanding Nonguaranteed - Industrial Revenue: $50,540,000
Beginning Outstanding - Public Debt for Private Purpose: $50,107,000
Outstanding Nonguaranteed - Industrial Revenue: $49,632,000
Issue, Unspecified Public Purpose: $12,895,000
Retired Nonguaranteed - Public Debt for Private Purpose: $4,453,000
Issue, Nonguaranteed - Public Debt for Private Purpose: $821,000
Retired Nonguaranteed - Public Debt for Private Purpose: $388,000
- Miscellaneous - Interest Earnings: $146,403,000
Special Assessments: $104,917,000
General Revenue - Other: $79,717,000
Sale of Property: $76,050,000
Interest Earnings: $64,877,000
General Revenue - Other: $63,687,000
Special Assessments: $23,907,000
Rents: $11,873,000
Fines and Forfeits: $10,785,000
Fines and Forfeits: $10,523,000
Rents: $10,242,000
Sale of Property: $1,916,000
- Other Capital Outlay - Police Protection: $77,153,000
General - Other: $54,741,000
Police Protection: $39,188,000
Regular Highways: $5,998,000
Regular Highways: $5,266,000
Correctional Institutions: $4,984,000
Corrections - Other: $4,900,000
Public Welfare - Other: $4,873,000
Health - Other: $3,164,000
Public Welfare - Other: $2,806,000
Elementary and Secondary Education: $2,381,000
Health - Other: $2,005,000
Judicial and Legal Services: $2,004,000
Libraries: $1,433,000
Parks and Recreation: $1,337,000
Air Transportation: $547,000
Elementary and Secondary Education: $529,000
Parks and Recreation: $491,000
Financial Administration: $383,000
Central Staff Services: $169,000
Natural Resources - Other: $44,000
- Other Funds - Cash and Securities: $5,277,688,000
Cash and Securities: $3,898,712,000
- Revenue - Water Utilities: $6,077,000
Water Utilities: $4,022,000
- Sinking Funds - Cash and Securities: $154,882,000
Cash and Securities: $69,119,000
- State Intergovernmental - Public Welfare: $1,005,047,000
Public Welfare: $878,285,000
Other: $677,153,000
Health and Hospitals: $600,780,000
Other: $592,898,000
Health and Hospitals: $516,392,000
Education: $317,332,000
Education: $297,691,000
Highways: $71,648,000
Highways: $49,809,000
General Local Government Support: $9,305,000
General Local Government Support: $3,542,000
Water Utilities: $1,848,000
Sewerage: $159,000
Sewerage: $11,000
Water Utilities: $5,000
- Tax - Property: $1,024,104,000
Property: $757,773,000
General Sales and Gross Receipts: $36,984,000
General Sales and Gross Receipts: $21,144,000
Other License: $15,567,000
Other License: $15,123,000
Documentary and Stock Transfer: $12,649,000
Documentary and Stock Transfer: $11,594,000
Public Utilities Sales: $7,386,000
Occupation and Business License - Other: $6,836,000
Public Utilities Sales: $6,789,000
Other Selective Sales: $6,489,000
Other: $6,108,000
Occupation and Business License - Other: $5,352,000
Other Selective Sales: $3,125,000
- Total Salaries and Wages: $141,651,000
: $128,908,000
- Water Utilities - Interest on Debt: $146,000
Interest on Debt: $51,000
San Bernardino County government finances - Revenue in 2018:
- Assistance and Subsidies - Public Welfare, Cash Assistance Programs - Other: $657,458,000
Public Welfare, Cash Assistance Programs - Other: $567,263,000
- Bond Funds - Cash and Securities: $275,022,000
Cash and Securities: $37,385,000
- Charges - Other: $525,240,000
Other: $456,708,000
Hospital Public: $366,535,000
Hospital Public: $329,140,000
Air Transportation: $93,227,000
Solid Waste Management: $92,447,000
Air Transportation: $84,911,000
Solid Waste Management: $83,612,000
Sewerage: $9,698,000
Parks and Recreation: $8,509,000
Parks and Recreation: $8,386,000
Regular Highways: $6,180,000
Regular Highways: $5,138,000
Sewerage: $4,723,000
Natural Resources - Other: $3,478,000
Natural Resources - Other: $3,127,000
Elementary and Secondary Education - Other: $28,000
Elementary and Secondary Education - Other: $26,000
- Construction - Natural Resources - Other: $52,245,000
Natural Resources - Other: $13,253,000
Elementary and Secondary Education: $12,417,000
Local Fire Protection: $8,853,000
Housing and Community Development: $5,028,000
Local Fire Protection: $4,701,000
Elementary and Secondary Education: $4,081,000
Parks and Recreation: $3,084,000
General - Other: $1,035,000
Parks and Recreation: $999,000
- Current Operations - Public Welfare - Other: $539,278,000
Public Welfare - Other: $504,470,000
Health - Other: $479,061,000
Hospitals: $466,910,000
Hospitals: $410,699,000
Health - Other: $392,059,000
Police Protection: $335,239,000
Police Protection: $330,783,000
Elementary and Secondary Education: $299,992,000
Elementary and Secondary Education: $263,941,000
General - Other: $239,314,000
Correctional Institutions: $226,780,000
Correctional Institutions: $193,989,000
Local Fire Protection: $190,412,000
Local Fire Protection: $178,359,000
Judicial and Legal Services: $144,065,000
Corrections - Other: $136,604,000
Judicial and Legal Services: $135,919,000
Corrections - Other: $118,402,000
Solid Waste Management: $88,228,000
Regular Highways: $80,954,000
Air Transportation: $73,461,000
Air Transportation: $69,094,000
Solid Waste Management: $68,050,000
Regular Highways: $56,471,000
Financial Administration: $50,847,000
Financial Administration: $44,550,000
General Public Buildings: $42,898,000
Central Staff Services: $41,714,000
General Public Buildings: $38,290,000
Central Staff Services: $35,948,000
General - Other: $35,035,000
Natural Resources - Other: $30,105,000
Natural Resources - Other: $27,374,000
Parks and Recreation: $23,486,000
Libraries: $16,262,000
Parks and Recreation: $16,182,000
Libraries: $15,192,000
Protective Inspection and Regulation - Other: $8,027,000
Sewerage: $7,925,000
Protective Inspection and Regulation - Other: $5,868,000
Water Utilities: $5,666,000
Water Utilities: $3,490,000
Sewerage: $2,538,000
- Federal Intergovernmental - Health and Hospitals: $188,059,000
Other: $172,152,000
Health and Hospitals: $155,426,000
Other: $103,165,000
Housing and Community Development: $12,036,000
Housing and Community Development: $10,104,000
Highways: $3,895,000
Highways: $3,725,000
General Local Government Support: $3,582,000
General Local Government Support: $3,373,000
Natural Resources: $2,754,000
Air Transportation: $1,731,000
Natural Resources: $396,000
Education: $288,000
Education: $229,000
Water Utilities: $59,000
- General - Interest on Debt: $126,801,000
Interest on Debt: $113,314,000
- Intergovernmental to Local - Other - Elementary and Secondary Education: $140,199,000
Other - Elementary and Secondary Education: $139,156,000
- Intergovernmental to State - Judicial and Legal Services: $24,261,000
Judicial and Legal Services: $23,832,000
- Local Intergovernmental - Health and Hospitals: $148,832,000
Health and Hospitals: $111,262,000
Education: $85,060,000
Education: $68,522,000
Other: $28,995,000
Other: $25,646,000
- Long Term Debt - Beginning Outstanding - Unspecified Public Purpose: $2,788,076,000
Outstanding Unspecified Public Purpose: $2,513,714,000
Beginning Outstanding - Unspecified Public Purpose: $1,448,997,000
Outstanding Unspecified Public Purpose: $1,204,483,000
Retired Unspecified Public Purpose: $523,668,000
Retired Unspecified Public Purpose: $287,257,000
Issue, Unspecified Public Purpose: $259,153,000
Beginning Outstanding - Public Debt for Private Purpose: $54,085,000
Outstanding Nonguaranteed - Industrial Revenue: $50,540,000
Beginning Outstanding - Public Debt for Private Purpose: $50,107,000
Outstanding Nonguaranteed - Industrial Revenue: $49,632,000
Issue, Unspecified Public Purpose: $12,895,000
Retired Nonguaranteed - Public Debt for Private Purpose: $4,453,000
Issue, Nonguaranteed - Public Debt for Private Purpose: $821,000
Retired Nonguaranteed - Public Debt for Private Purpose: $388,000
- Miscellaneous - Interest Earnings: $146,403,000
Special Assessments: $104,917,000
General Revenue - Other: $79,717,000
Sale of Property: $76,050,000
Interest Earnings: $64,877,000
General Revenue - Other: $63,687,000
Special Assessments: $23,907,000
Rents: $11,873,000
Fines and Forfeits: $10,785,000
Fines and Forfeits: $10,523,000
Rents: $10,242,000
Sale of Property: $1,916,000
- Other Capital Outlay - Police Protection: $77,153,000
General - Other: $54,741,000
Police Protection: $39,188,000
Regular Highways: $5,998,000
Regular Highways: $5,266,000
Correctional Institutions: $4,984,000
Corrections - Other: $4,900,000
Public Welfare - Other: $4,873,000
Health - Other: $3,164,000
Public Welfare - Other: $2,806,000
Elementary and Secondary Education: $2,381,000
Health - Other: $2,005,000
Judicial and Legal Services: $2,004,000
Libraries: $1,433,000
Parks and Recreation: $1,337,000
Air Transportation: $547,000
Elementary and Secondary Education: $529,000
Parks and Recreation: $491,000
Financial Administration: $383,000
Central Staff Services: $169,000
Natural Resources - Other: $44,000
- Other Funds - Cash and Securities: $5,277,688,000
Cash and Securities: $3,898,712,000
- Revenue - Water Utilities: $6,077,000
Water Utilities: $4,022,000
- Sinking Funds - Cash and Securities: $154,882,000
Cash and Securities: $69,119,000
- State Intergovernmental - Public Welfare: $1,005,047,000
Public Welfare: $878,285,000
Other: $677,153,000
Health and Hospitals: $600,780,000
Other: $592,898,000
Health and Hospitals: $516,392,000
Education: $317,332,000
Education: $297,691,000
Highways: $71,648,000
Highways: $49,809,000
General Local Government Support: $9,305,000
General Local Government Support: $3,542,000
Water Utilities: $1,848,000
Sewerage: $159,000
Sewerage: $11,000
Water Utilities: $5,000
- Tax - Property: $1,024,104,000
Property: $757,773,000
General Sales and Gross Receipts: $36,984,000
General Sales and Gross Receipts: $21,144,000
Other License: $15,567,000
Other License: $15,123,000
Documentary and Stock Transfer: $12,649,000
Documentary and Stock Transfer: $11,594,000
Public Utilities Sales: $7,386,000
Occupation and Business License - Other: $6,836,000
Public Utilities Sales: $6,789,000
Other Selective Sales: $6,489,000
Other: $6,108,000
Occupation and Business License - Other: $5,352,000
Other Selective Sales: $3,125,000
- Total Salaries and Wages: $141,651,000
: $128,908,000
- Water Utilities - Interest on Debt: $146,000
Interest on Debt: $51,000
San Bernardino County government finances - Debt in 2018:
- Assistance and Subsidies - Public Welfare, Cash Assistance Programs - Other: $657,458,000
Public Welfare, Cash Assistance Programs - Other: $567,263,000
- Bond Funds - Cash and Securities: $275,022,000
Cash and Securities: $37,385,000
- Charges - Other: $525,240,000
Other: $456,708,000
Hospital Public: $366,535,000
Hospital Public: $329,140,000
Air Transportation: $93,227,000
Solid Waste Management: $92,447,000
Air Transportation: $84,911,000
Solid Waste Management: $83,612,000
Sewerage: $9,698,000
Parks and Recreation: $8,509,000
Parks and Recreation: $8,386,000
Regular Highways: $6,180,000
Regular Highways: $5,138,000
Sewerage: $4,723,000
Natural Resources - Other: $3,478,000
Natural Resources - Other: $3,127,000
Elementary and Secondary Education - Other: $28,000
Elementary and Secondary Education - Other: $26,000
- Construction - Natural Resources - Other: $52,245,000
Natural Resources - Other: $13,253,000
Elementary and Secondary Education: $12,417,000
Local Fire Protection: $8,853,000
Housing and Community Development: $5,028,000
Local Fire Protection: $4,701,000
Elementary and Secondary Education: $4,081,000
Parks and Recreation: $3,084,000
General - Other: $1,035,000
Parks and Recreation: $999,000
- Current Operations - Public Welfare - Other: $539,278,000
Public Welfare - Other: $504,470,000
Health - Other: $479,061,000
Hospitals: $466,910,000
Hospitals: $410,699,000
Health - Other: $392,059,000
Police Protection: $335,239,000
Police Protection: $330,783,000
Elementary and Secondary Education: $299,992,000
Elementary and Secondary Education: $263,941,000
General - Other: $239,314,000
Correctional Institutions: $226,780,000
Correctional Institutions: $193,989,000
Local Fire Protection: $190,412,000
Local Fire Protection: $178,359,000
Judicial and Legal Services: $144,065,000
Corrections - Other: $136,604,000
Judicial and Legal Services: $135,919,000
Corrections - Other: $118,402,000
Solid Waste Management: $88,228,000
Regular Highways: $80,954,000
Air Transportation: $73,461,000
Air Transportation: $69,094,000
Solid Waste Management: $68,050,000
Regular Highways: $56,471,000
Financial Administration: $50,847,000
Financial Administration: $44,550,000
General Public Buildings: $42,898,000
Central Staff Services: $41,714,000
General Public Buildings: $38,290,000
Central Staff Services: $35,948,000
General - Other: $35,035,000
Natural Resources - Other: $30,105,000
Natural Resources - Other: $27,374,000
Parks and Recreation: $23,486,000
Libraries: $16,262,000
Parks and Recreation: $16,182,000
Libraries: $15,192,000
Protective Inspection and Regulation - Other: $8,027,000
Sewerage: $7,925,000
Protective Inspection and Regulation - Other: $5,868,000
Water Utilities: $5,666,000
Water Utilities: $3,490,000
Sewerage: $2,538,000
- Federal Intergovernmental - Health and Hospitals: $188,059,000
Other: $172,152,000
Health and Hospitals: $155,426,000
Other: $103,165,000
Housing and Community Development: $12,036,000
Housing and Community Development: $10,104,000
Highways: $3,895,000
Highways: $3,725,000
General Local Government Support: $3,582,000
General Local Government Support: $3,373,000
Natural Resources: $2,754,000
Air Transportation: $1,731,000
Natural Resources: $396,000
Education: $288,000
Education: $229,000
Water Utilities: $59,000
- General - Interest on Debt: $126,801,000
Interest on Debt: $113,314,000
- Intergovernmental to Local - Other - Elementary and Secondary Education: $140,199,000
Other - Elementary and Secondary Education: $139,156,000
- Intergovernmental to State - Judicial and Legal Services: $24,261,000
Judicial and Legal Services: $23,832,000
- Local Intergovernmental - Health and Hospitals: $148,832,000
Health and Hospitals: $111,262,000
Education: $85,060,000
Education: $68,522,000
Other: $28,995,000
Other: $25,646,000
- Long Term Debt - Beginning Outstanding - Unspecified Public Purpose: $2,788,076,000
Outstanding Unspecified Public Purpose: $2,513,714,000
Beginning Outstanding - Unspecified Public Purpose: $1,448,997,000
Outstanding Unspecified Public Purpose: $1,204,483,000
Retired Unspecified Public Purpose: $523,668,000
Retired Unspecified Public Purpose: $287,257,000
Issue, Unspecified Public Purpose: $259,153,000
Beginning Outstanding - Public Debt for Private Purpose: $54,085,000
Outstanding Nonguaranteed - Industrial Revenue: $50,540,000
Beginning Outstanding - Public Debt for Private Purpose: $50,107,000
Outstanding Nonguaranteed - Industrial Revenue: $49,632,000
Issue, Unspecified Public Purpose: $12,895,000
Retired Nonguaranteed - Public Debt for Private Purpose: $4,453,000
Issue, Nonguaranteed - Public Debt for Private Purpose: $821,000
Retired Nonguaranteed - Public Debt for Private Purpose: $388,000
- Miscellaneous - Interest Earnings: $146,403,000
Special Assessments: $104,917,000
General Revenue - Other: $79,717,000
Sale of Property: $76,050,000
Interest Earnings: $64,877,000
General Revenue - Other: $63,687,000
Special Assessments: $23,907,000
Rents: $11,873,000
Fines and Forfeits: $10,785,000
Fines and Forfeits: $10,523,000
Rents: $10,242,000
Sale of Property: $1,916,000
- Other Capital Outlay - Police Protection: $77,153,000
General - Other: $54,741,000
Police Protection: $39,188,000
Regular Highways: $5,998,000
Regular Highways: $5,266,000
Correctional Institutions: $4,984,000
Corrections - Other: $4,900,000
Public Welfare - Other: $4,873,000
Health - Other: $3,164,000
Public Welfare - Other: $2,806,000
Elementary and Secondary Education: $2,381,000
Health - Other: $2,005,000
Judicial and Legal Services: $2,004,000
Libraries: $1,433,000
Parks and Recreation: $1,337,000
Air Transportation: $547,000
Elementary and Secondary Education: $529,000
Parks and Recreation: $491,000
Financial Administration: $383,000
Central Staff Services: $169,000
Natural Resources - Other: $44,000
- Other Funds - Cash and Securities: $5,277,688,000
Cash and Securities: $3,898,712,000
- Revenue - Water Utilities: $6,077,000
Water Utilities: $4,022,000
- Sinking Funds - Cash and Securities: $154,882,000
Cash and Securities: $69,119,000
- State Intergovernmental - Public Welfare: $1,005,047,000
Public Welfare: $878,285,000
Other: $677,153,000
Health and Hospitals: $600,780,000
Other: $592,898,000
Health and Hospitals: $516,392,000
Education: $317,332,000
Education: $297,691,000
Highways: $71,648,000
Highways: $49,809,000
General Local Government Support: $9,305,000
General Local Government Support: $3,542,000
Water Utilities: $1,848,000
Sewerage: $159,000
Sewerage: $11,000
Water Utilities: $5,000
- Tax - Property: $1,024,104,000
Property: $757,773,000
General Sales and Gross Receipts: $36,984,000
General Sales and Gross Receipts: $21,144,000
Other License: $15,567,000
Other License: $15,123,000
Documentary and Stock Transfer: $12,649,000
Documentary and Stock Transfer: $11,594,000
Public Utilities Sales: $7,386,000
Occupation and Business License - Other: $6,836,000
Public Utilities Sales: $6,789,000
Other Selective Sales: $6,489,000
Other: $6,108,000
Occupation and Business License - Other: $5,352,000
Other Selective Sales: $3,125,000
- Total Salaries and Wages: $141,651,000
: $128,908,000
- Water Utilities - Interest on Debt: $146,000
Interest on Debt: $51,000
San Bernardino County government finances - Cash and Securities in 2018:
- Assistance and Subsidies - Public Welfare, Cash Assistance Programs - Other: $657,458,000
Public Welfare, Cash Assistance Programs - Other: $567,263,000
- Bond Funds - Cash and Securities: $275,022,000
Cash and Securities: $37,385,000
- Charges - Other: $525,240,000
Other: $456,708,000
Hospital Public: $366,535,000
Hospital Public: $329,140,000
Air Transportation: $93,227,000
Solid Waste Management: $92,447,000
Air Transportation: $84,911,000
Solid Waste Management: $83,612,000
Sewerage: $9,698,000
Parks and Recreation: $8,509,000
Parks and Recreation: $8,386,000
Regular Highways: $6,180,000
Regular Highways: $5,138,000
Sewerage: $4,723,000
Natural Resources - Other: $3,478,000
Natural Resources - Other: $3,127,000
Elementary and Secondary Education - Other: $28,000
Elementary and Secondary Education - Other: $26,000
- Construction - Natural Resources - Other: $52,245,000
Natural Resources - Other: $13,253,000
Elementary and Secondary Education: $12,417,000
Local Fire Protection: $8,853,000
Housing and Community Development: $5,028,000
Local Fire Protection: $4,701,000
Elementary and Secondary Education: $4,081,000
Parks and Recreation: $3,084,000
General - Other: $1,035,000
Parks and Recreation: $999,000
- Current Operations - Public Welfare - Other: $539,278,000
Public Welfare - Other: $504,470,000
Health - Other: $479,061,000
Hospitals: $466,910,000
Hospitals: $410,699,000
Health - Other: $392,059,000
Police Protection: $335,239,000
Police Protection: $330,783,000
Elementary and Secondary Education: $299,992,000
Elementary and Secondary Education: $263,941,000
General - Other: $239,314,000
Correctional Institutions: $226,780,000
Correctional Institutions: $193,989,000
Local Fire Protection: $190,412,000
Local Fire Protection: $178,359,000
Judicial and Legal Services: $144,065,000
Corrections - Other: $136,604,000
Judicial and Legal Services: $135,919,000
Corrections - Other: $118,402,000
Solid Waste Management: $88,228,000
Regular Highways: $80,954,000
Air Transportation: $73,461,000
Air Transportation: $69,094,000
Solid Waste Management: $68,050,000
Regular Highways: $56,471,000
Financial Administration: $50,847,000
Financial Administration: $44,550,000
General Public Buildings: $42,898,000
Central Staff Services: $41,714,000
General Public Buildings: $38,290,000
Central Staff Services: $35,948,000
General - Other: $35,035,000
Natural Resources - Other: $30,105,000
Natural Resources - Other: $27,374,000
Parks and Recreation: $23,486,000
Libraries: $16,262,000
Parks and Recreation: $16,182,000
Libraries: $15,192,000
Protective Inspection and Regulation - Other: $8,027,000
Sewerage: $7,925,000
Protective Inspection and Regulation - Other: $5,868,000
Water Utilities: $5,666,000
Water Utilities: $3,490,000
Sewerage: $2,538,000
- Federal Intergovernmental - Health and Hospitals: $188,059,000
Other: $172,152,000
Health and Hospitals: $155,426,000
Other: $103,165,000
Housing and Community Development: $12,036,000
Housing and Community Development: $10,104,000
Highways: $3,895,000
Highways: $3,725,000
General Local Government Support: $3,582,000
General Local Government Support: $3,373,000
Natural Resources: $2,754,000
Air Transportation: $1,731,000
Natural Resources: $396,000
Education: $288,000
Education: $229,000
Water Utilities: $59,000
- General - Interest on Debt: $126,801,000
Interest on Debt: $113,314,000
- Intergovernmental to Local - Other - Elementary and Secondary Education: $140,199,000
Other - Elementary and Secondary Education: $139,156,000
- Intergovernmental to State - Judicial and Legal Services: $24,261,000
Judicial and Legal Services: $23,832,000
- Local Intergovernmental - Health and Hospitals: $148,832,000
Health and Hospitals: $111,262,000
Education: $85,060,000
Education: $68,522,000
Other: $28,995,000
Other: $25,646,000
- Long Term Debt - Beginning Outstanding - Unspecified Public Purpose: $2,788,076,000
Outstanding Unspecified Public Purpose: $2,513,714,000
Beginning Outstanding - Unspecified Public Purpose: $1,448,997,000
Outstanding Unspecified Public Purpose: $1,204,483,000
Retired Unspecified Public Purpose: $523,668,000
Retired Unspecified Public Purpose: $287,257,000
Issue, Unspecified Public Purpose: $259,153,000
Beginning Outstanding - Public Debt for Private Purpose: $54,085,000
Outstanding Nonguaranteed - Industrial Revenue: $50,540,000
Beginning Outstanding - Public Debt for Private Purpose: $50,107,000
Outstanding Nonguaranteed - Industrial Revenue: $49,632,000
Issue, Unspecified Public Purpose: $12,895,000
Retired Nonguaranteed - Public Debt for Private Purpose: $4,453,000
Issue, Nonguaranteed - Public Debt for Private Purpose: $821,000
Retired Nonguaranteed - Public Debt for Private Purpose: $388,000
- Miscellaneous - Interest Earnings: $146,403,000
Special Assessments: $104,917,000
General Revenue - Other: $79,717,000
Sale of Property: $76,050,000
Interest Earnings: $64,877,000
General Revenue - Other: $63,687,000
Special Assessments: $23,907,000
Rents: $11,873,000
Fines and Forfeits: $10,785,000
Fines and Forfeits: $10,523,000
Rents: $10,242,000
Sale of Property: $1,916,000
- Other Capital Outlay - Police Protection: $77,153,000
General - Other: $54,741,000
Police Protection: $39,188,000
Regular Highways: $5,998,000
Regular Highways: $5,266,000
Correctional Institutions: $4,984,000
Corrections - Other: $4,900,000
Public Welfare - Other: $4,873,000
Health - Other: $3,164,000
Public Welfare - Other: $2,806,000
Elementary and Secondary Education: $2,381,000
Health - Other: $2,005,000
Judicial and Legal Services: $2,004,000
Libraries: $1,433,000
Parks and Recreation: $1,337,000
Air Transportation: $547,000
Elementary and Secondary Education: $529,000
Parks and Recreation: $491,000
Financial Administration: $383,000
Central Staff Services: $169,000
Natural Resources - Other: $44,000
- Other Funds - Cash and Securities: $5,277,688,000
Cash and Securities: $3,898,712,000
- Revenue - Water Utilities: $6,077,000
Water Utilities: $4,022,000
- Sinking Funds - Cash and Securities: $154,882,000
Cash and Securities: $69,119,000
- State Intergovernmental - Public Welfare: $1,005,047,000
Public Welfare: $878,285,000
Other: $677,153,000
Health and Hospitals: $600,780,000
Other: $592,898,000
Health and Hospitals: $516,392,000
Education: $317,332,000
Education: $297,691,000
Highways: $71,648,000
Highways: $49,809,000
General Local Government Support: $9,305,000
General Local Government Support: $3,542,000
Water Utilities: $1,848,000
Sewerage: $159,000
Sewerage: $11,000
Water Utilities: $5,000
- Tax - Property: $1,024,104,000
Property: $757,773,000
General Sales and Gross Receipts: $36,984,000
General Sales and Gross Receipts: $21,144,000
Other License: $15,567,000
Other License: $15,123,000
Documentary and Stock Transfer: $12,649,000
Documentary and Stock Transfer: $11,594,000
Public Utilities Sales: $7,386,000
Occupation and Business License - Other: $6,836,000
Public Utilities Sales: $6,789,000
Other Selective Sales: $6,489,000
Other: $6,108,000
Occupation and Business License - Other: $5,352,000
Other Selective Sales: $3,125,000
- Total Salaries and Wages: $141,651,000
: $128,908,000
- Water Utilities - Interest on Debt: $146,000
Interest on Debt: $51,000
Supplemental Security Income (SSI) in 2006:
- Total number of recipients: 65,203
- Number of aged recipients: 13,440
- Number of blind and disabled recipients: 51,763
- Number of recipients under 18: 8,400
- Number of recipients between 18 and 64: 35,962
- Number of recipients older than 64: 20,841
- Number of recipients also receiving OASDI: 26,270
- Amount of payments (thousands of dollars): 38,103
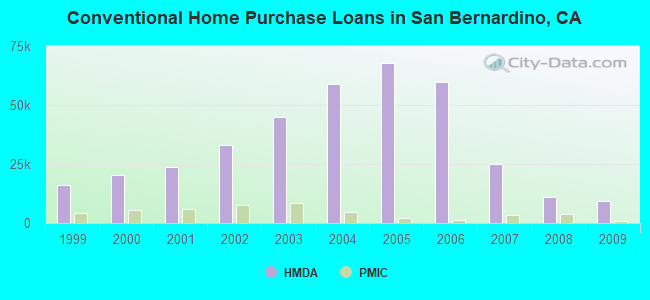
| Home Mortgage Disclosure Act Aggregated Statistics For Year 2009 (Based on 242 full tracts) | ||||||||||||||
| A) FHA, FSA/RHS & VA Home Purchase Loans | B) Conventional Home Purchase Loans | C) Refinancings | D) Home Improvement Loans | E) Loans on Dwellings For 5+ Families | F) Non-occupant Loans on < 5 Family Dwellings (A B C & D) | G) Loans On Manufactured Home Dwelling (A B C & D) | ||||||||
|---|---|---|---|---|---|---|---|---|---|---|---|---|---|---|
| Number | Average Value | Number | Average Value | Number | Average Value | Number | Average Value | Number | Average Value | Number | Average Value | Number | Average Value | |
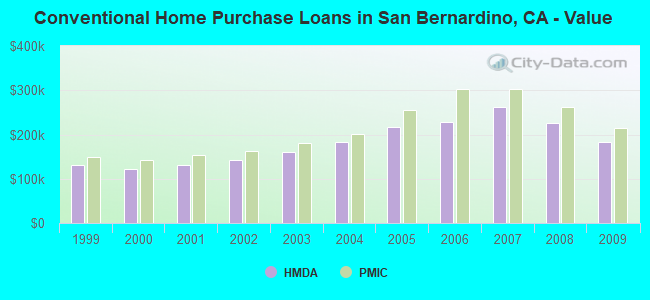
| LOANS ORIGINATED | 14,303 | $185,887 | 9,132 | $182,831 | 18,100 | $229,232 | 901 | $135,989 | 52 | $4,036,673 | 4,861 | $157,509 | 332 | $103,506 |
| APPLICATIONS APPROVED, NOT ACCEPTED | 1,198 | $182,841 | 1,333 | $187,607 | 2,805 | $227,284 | 281 | $53,762 | 5 | $4,680,400 | 670 | $164,276 | 163 | $73,577 |
| APPLICATIONS DENIED | 2,885 | $181,242 | 2,568 | $170,624 | 10,182 | $232,476 | 1,040 | $73,996 | 20 | $4,903,600 | 2,039 | $165,967 | 411 | $83,221 |
| APPLICATIONS WITHDRAWN | 2,360 | $185,963 | 1,736 | $188,293 | 5,408 | $230,452 | 416 | $106,389 | 8 | $3,294,250 | 1,029 | $155,547 | 79 | $117,886 |
| FILES CLOSED FOR INCOMPLETENESS | 592 | $186,014 | 493 | $193,195 | 1,533 | $241,340 | 88 | $116,216 | 4 | $832,250 | 292 | $168,836 | 34 | $89,382 |
| Private Mortgage Insurance Companies Aggregated Statistics For Year 2009 (Based on 222 full tracts) | ||||||||
| A) Conventional Home Purchase Loans | B) Refinancings | C) Non-occupant Loans on < 5 Family Dwellings (A & B) | D) Loans On Manufactured Home Dwelling (A & B) | |||||
|---|---|---|---|---|---|---|---|---|
| Number | Average Value | Number | Average Value | Number | Average Value | Number | Average Value | |
| LOANS ORIGINATED | 970 | $213,993 | 161 | $255,857 | 44 | $169,682 | 1 | $166,000 |
| APPLICATIONS APPROVED, NOT ACCEPTED | 594 | $229,867 | 157 | $300,790 | 28 | $194,000 | 2 | $220,000 |
| APPLICATIONS DENIED | 204 | $217,456 | 84 | $268,619 | 19 | $198,684 | 0 | $0 |
| APPLICATIONS WITHDRAWN | 67 | $215,836 | 30 | $259,467 | 4 | $153,000 | 0 | $0 |
| FILES CLOSED FOR INCOMPLETENESS | 77 | $263,416 | 20 | $296,350 | 5 | $173,600 | 0 | $0 |
| Most common first names in San Bernardino County, CA among deceased individuals | ||
| Name | Count | Lived (average) |
|---|---|---|
| John | 5,906 | 73.5 years |
| Mary | 5,120 | 78.8 years |
| William | 5,116 | 74.0 years |
| Robert | 4,643 | 70.2 years |
| James | 4,207 | 71.3 years |
| Charles | 3,111 | 73.6 years |
| George | 2,997 | 75.3 years |
| Helen | 2,429 | 79.3 years |
| Dorothy | 2,315 | 77.4 years |
| Joseph | 2,239 | 73.8 years |
| Most common last names in San Bernardino County, CA among deceased individuals | ||
| Last name | Count | Lived (average) |
|---|---|---|
| Smith | 2,408 | 74.9 years |
| Johnson | 1,799 | 74.1 years |
| Williams | 1,313 | 73.7 years |
| Brown | 1,244 | 73.9 years |
| Jones | 1,221 | 73.1 years |
| Miller | 1,187 | 74.7 years |
| Davis | 1,026 | 74.0 years |
| Anderson | 939 | 74.8 years |
| Wilson | 893 | 73.5 years |
| Garcia | 834 | 70.5 years |
| Businesses in San Bernardino County, CA | ||||
| Name | Count | Name | Count | |
|---|---|---|---|---|
| 24 Hour Fitness | 11 | JoS. A. Bank | 2 | |
| 7-Eleven | 60 | Johnny Rockets | 2 | |
| 99 Cents Only Stores | 22 | Jones New York | 20 | |
| ALDO | 6 | Journeys | 5 | |
| AMF Bowling | 1 | Just Tires | 3 | |
| AT&T | 20 | Justice | 5 | |
| Abercrombie & Fitch | 1 | KFC | 32 | |
| Abercrombie Kids | 1 | Kincaid | 2 | |
| Ace Hardware | 8 | Kmart | 6 | |
| Aeropostale | 6 | Knights Inn | 3 | |
| Albertsons | 14 | Kohl's | 7 | |
| American Eagle Outfitters | 7 | Kroger | 26 | |
| Ann Taylor | 6 | LA Fitness | 8 | |
| Apple Store | 1 | La Quinta | 3 | |
| Applebee's | 9 | La-Z-Boy | 5 | |
| Arby's | 14 | Lane Bryant | 7 | |
| Ashley Furniture | 2 | Lane Furniture | 11 | |
| AutoZone | 42 | LensCrafters | 6 | |
| Avenue | 6 | Levi Strauss & Co. | 3 | |
| BMW | 1 | Little Caesars Pizza | 29 | |
| Baja Fresh Mexican Grill | 4 | Long John Silver's | 5 | |
| Bakers | 2 | Lowe's | 9 | |
| Bally Total Fitness | 3 | Macy's | 3 | |
| Banana Republic | 4 | Marriott | 8 | |
| Barnes & Noble | 5 | Marshalls | 7 | |
| Baskin-Robbins | 21 | MasterBrand Cabinets | 37 | |
| Bath & Body Works | 10 | Mazda | 2 | |
| Bebe | 1 | McDonald's | 68 | |
| Bed Bath & Beyond | 6 | Men's Wearhouse | 6 | |
| Ben & Jerry's | 1 | Motel 6 | 12 | |
| Best Western | 11 | Motherhood Maternity | 7 | |
| Big O Tires | 5 | New Balance | 11 | |
| Blockbuster | 18 | New York & Co | 3 | |
| Brookstone | 2 | Nike | 85 | |
| Brunswick Bowling & Billiards | 3 | Nissan | 7 | |
| Budget Car Rental | 2 | Nordstrom | 3 | |
| Buffalo Wild Wings | 3 | Office Depot | 4 | |
| Burger King | 35 | OfficeMax | 3 | |
| CVS | 23 | Old Navy | 4 | |
| Cache | 1 | Olive Garden | 5 | |
| CarMax | 1 | On The Border | 1 | |
| Carl\s Jr. | 53 | Outback | 4 | |
| Casual Male XL | 5 | Outback Steakhouse | 4 | |
| Catherines | 3 | Pac Sun | 6 | |
| Charlotte Russe | 2 | Panda Express | 19 | |
| Chevrolet | 7 | Panera Bread | 5 | |
| Chick-Fil-A | 5 | Papa John's Pizza | 13 | |
| Chico's | 2 | Payless | 31 | |
| Chipotle | 10 | Penske | 16 | |
| Chuck E. Cheese's | 6 | PetSmart | 9 | |
| Church's Chicken | 6 | Pier 1 Imports | 6 | |
| Cinnabon | 3 | Pizza Hut | 31 | |
| Circle K | 39 | Popeyes | 14 | |
| Clarks | 1 | Pottery Barn | 1 | |
| Cold Stone Creamery | 12 | Qdoba Mexican Grill | 3 | |
| Coldwater Creek | 2 | Quality | 2 | |
| Comfort Suites | 2 | Quiznos | 23 | |
| Costco | 6 | RadioShack | 31 | |
| Crate & Barrel | 1 | Ramada | 2 | |
| Curves | 23 | Red Lobster | 4 | |
| DHL | 15 | Red Robin | 5 | |
| Dairy Queen | 12 | Red Roof Inn | 2 | |
| Days Inn | 10 | Rite Aid | 37 | |
| Decora Cabinetry | 11 | Rodeway Inn | 3 | |
| Dennys | 32 | Rue21 | 2 | |
| Discount Tire | 11 | Ryder Rental & Truck Leasing | 1 | |
| Domino's Pizza | 21 | SAS Shoes | 5 | |
| DressBarn | 4 | SONIC Drive-In | 3 | |
| Dressbarn | 3 | Safeway | 7 | |
| Econo Lodge | 4 | Sam's Club | 3 | |
| Eddie Bauer | 1 | Sears | 26 | |
| El Pollo Loco | 28 | Sephora | 5 | |
| Express | 2 | Sheraton | 1 | |
| Extended Stay America | 2 | Skechers USA | 4 | |
| Famous Footwear | 6 | Spencer Gifts | 4 | |
| Fashion Bug | 5 | Sprint Nextel | 25 | |
| FedEx | 157 | Staples | 11 | |
| Finish Line | 2 | Starbucks | 89 | |
| Firestone Complete Auto Care | 8 | Subaru | 2 | |
| Foot Locker | 4 | Subway | 90 | |
| Ford | 2 | Super 8 | 8 | |
| Forever 21 | 5 | T-Mobile | 82 | |
| Fredericks Of Hollywood | 4 | T.G.I. Driday's | 4 | |
| GNC | 39 | T.J.Maxx | 1 | |
| GameStop | 21 | Taco Bell | 39 | |
| Gap | 5 | Target | 15 | |
| Goodwill | 5 | The Cheesecake Factory | 1 | |
| Gymboree | 5 | The Room Place | 7 | |
| H&M | 4 | Torrid | 4 | |
| H&R Block | 54 | Toyota | 3 | |
| Haagen-Dazs | 1 | Toys"R"Us | 9 | |
| Hawthorn | 1 | Trader Joe's | 4 | |
| Hilton | 10 | Travelodge | 4 | |
| Hobby Lobby | 2 | True Value | 5 | |
| Holiday Inn | 9 | U-Haul | 75 | |
| Hollister Co. | 4 | UPS | 161 | |
| Home Depot | 16 | Urban Outfitters | 1 | |
| HomeTown Buffet | 6 | Vans | 42 | |
| Honda | 5 | Verizon Wireless | 23 | |
| Hot Topic | 5 | Victoria's Secret | 6 | |
| Howard Johnson | 1 | Volkswagen | 2 | |
| Hyatt | 1 | Vons | 12 | |
| IHOP | 14 | Walgreens | 29 | |
| IZOD | 1 | Walmart | 12 | |
| J. Jill | 1 | Wendy's | 22 | |
| J.Crew | 1 | Wet Seal | 5 | |
| JCPenney | 8 | World Gym | 2 | |
| Jack In The Box | 47 | YMCA | 9 | |
| Jamba Juice | 8 | |||
San Bernardino County on our top lists:
- #5 on the list of "Top 101 counties with the highest Nitrogen Dioxide air pollution readings in 2012 (ppm)"
- #5 on the list of "Top 101 counties with the highest ground withdrawal of fresh water for public supply"
- #5 on the list of "Top 101 counties with the highest ground withdrawal of fresh water for public supply (pop. 50,000+)"
- #10 on the list of "Top 101 counties with the most Evangelical Protestant congregations (pop. 50,000+)"
- #10 on the list of "Top 101 counties with the most Evangelical Protestant congregations"
- #13 on the list of "Top 101 counties with the highest total withdrawal of fresh water for public supply (pop. 50,000+)"
- #14 on the list of "Top 101 counties with the highest total withdrawal of fresh water for public supply"
- #15 on the list of "Top 101 counties with the most Evangelical Protestant adherents (pop. 50,000+)"
- #15 on the list of "Top 101 counties with the most Evangelical Protestant adherents"
- #18 on the list of "Top 101 counties with the most Catholic adherents (pop. 50,000+)"
- #18 on the list of "Top 101 counties with the most Catholic adherents"
- #20 on the list of "Top 101 counties with the most Other congregations"
- #20 on the list of "Top 101 counties with the most Other congregations (pop. 50,000+)"
- #26 on the list of "Top 101 counties with the most Other adherents (pop. 50,000+)"
- #26 on the list of "Top 101 counties with the most Other adherents"
- #34 on the list of "Top 101 counties with the highest percentage of residents that drank alcohol in the past 30 days"
- #34 on the list of "Top 101 counties with the highest Particulate Matter (PM10) Annual air pollution readings in 2012 (µg/m3)"
- #54 on the list of "Top 101 counties with the most Catholic congregations"
- #55 on the list of "Top 101 counties with the lowest percentage of residents that visited a dentist within the past year"
- #55 on the list of "Top 101 counties with the most Catholic congregations (pop. 50,000+)"