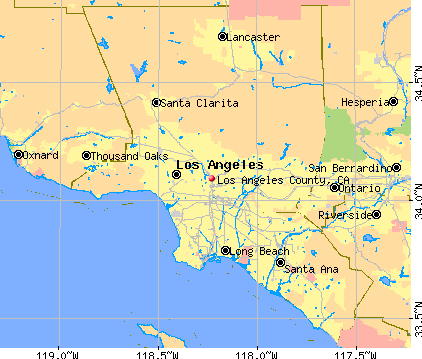
Los Angeles County, California (CA)
County owner-occupied free and clear houses and condos in 2010: 317,603
County owner-occupied houses and condos in 2000: 1,499,694
Renter-occupied apartments: 1,696,455 (it was 1,634,080 in 2000)
| % of renters here: | 52% |
| State: | 44% |
Land area: 4061 sq. mi.
Water area: 691.5 sq. mi.
Population density: 2394 people per square mile (very high).
Industries providing employment: Educational, health and social services (21.1%), Professional, scientific, management, administrative, and waste management services (13.9%), Arts, entertainment, recreation, accommodation and food services (10.9%), Retail trade (10.2%).
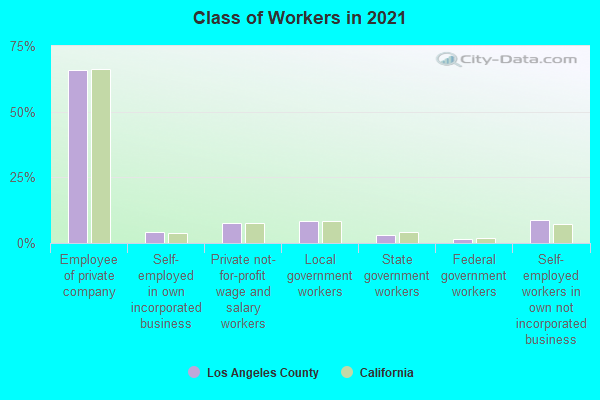
Type of workers:
- Private wage or salary: 78%
- Government: 12%
- Self-employed, not incorporated: 9%
- Unpaid family work: 0%
- OSM Map
- General Map
- Google Map
- MSN Map

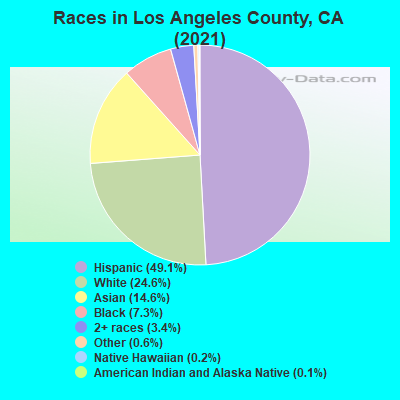
- 4,766,61649.0%Hispanic or Latino
- 2,380,26624.5%White Non-Hispanic Alone
- 1,432,46214.7%Asian alone
- 712,1567.3%Black Non-Hispanic Alone
- 327,4623.4%Two or more races
- 63,5750.7%Some other race alone
- 21,1580.2%Native Hawaiian and Other
Pacific Islander alone - 17,4430.2%American Indian and Alaska Native alone
| Median resident age: | 38.2 years |
| California median age: | 37.9 years |
| Males: 4,825,592 | |
| Females: 4,895,546 |


| Los Angeles County: | 2.0 people |
| California: | 3 people |
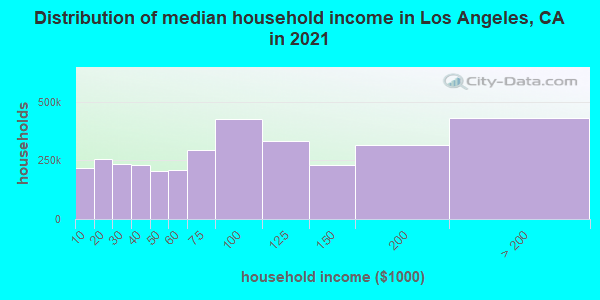
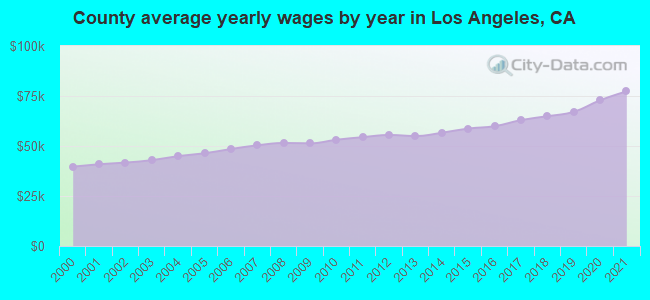
Estimated median household income in 2022: $82,516 ($42,189 in 1999)
| This county: | $82,516 |
| California: | $91,551 |
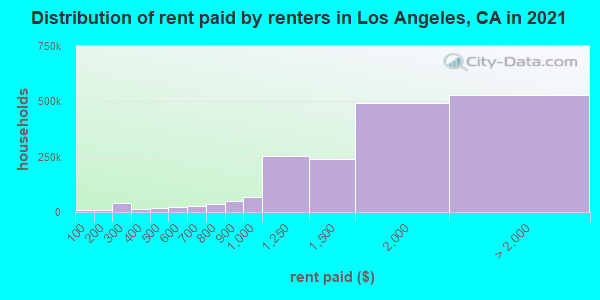
Median contract rent in 2022 for apartments: $1,675 (lower quartile is $1,202, upper quartile is $2,236)
| This county: | $1675 |
| State: | $1719 |
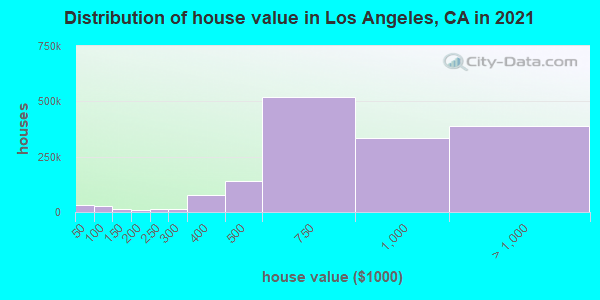
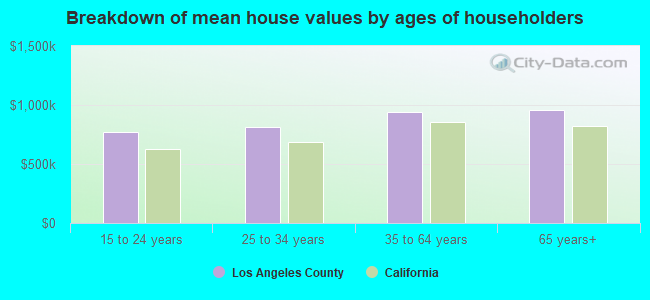
Estimated median house or condo value in 2022: $805,600 (it was $201,400 in 2000)
| Los Angeles: | $805,600 |
| California: | $715,900 |
Mean price in 2022:
Median monthly housing costs for homes and condos with a mortgage: $2,879Detached houses: $1,116,983
Here: $1,116,983 State: $988,808 Townhouses or other attached units: $750,854
Here: $750,854 State: $838,546 In 2-unit structures: $1,066,084
Here: $1,066,084 State: $1,138,100 In 3-to-4-unit structures: $791,642
Here: $791,642 State: $824,253 In 5-or-more-unit structures: $738,503
Here: $738,503 State: $730,996 Mobile homes: $205,184
Here: $205,184 State: $184,506 Occupied boats, RVs, vans, etc.: $276,239
Here: $276,239 State: $204,957
Median monthly housing costs for units without a mortgage: $782
Institutionalized population: 68,682
Crime in 2020 (reported by the sheriff's office or county police, not the county total):
- Murders: 96
- Rapes: 270
- Robberies: 1256
- Assaults: 3983
- Burglaries: 2381
- Thefts: 8323
- Auto thefts: 4850
Crime in 2019 (reported by the sheriff's office or county police, not the county total):
- Murders: 68
- Rapes: 300
- Robberies: 1443
- Assaults: 3753
- Burglaries: 2798
- Thefts: 8595
- Auto thefts: 3647
Health of residents in Los Angeles County based on CDC Behavioral Risk Factor Surveillance System Survey Questionnaires from 2003 to 2012:
General health status score of residents in this county from 1 (poor) to 5 (excellent) is 3.4. This is about average.74.7% of residents exercised in the past month. This is about average.
37.8% of residents smoked 100+ cigarettes in their lives. This is less than average.
69.2% of adult residents drank alcohol in the past 30 days. This is less than average.
68.1% of residents visited a dentist within the past year. This is about average.
Average weight of males is 185 pounds. This is less than average.
Average weight of females is 155 pounds. This is less than average.
12.9% of residents keep firearms around their homes. This is less than average.
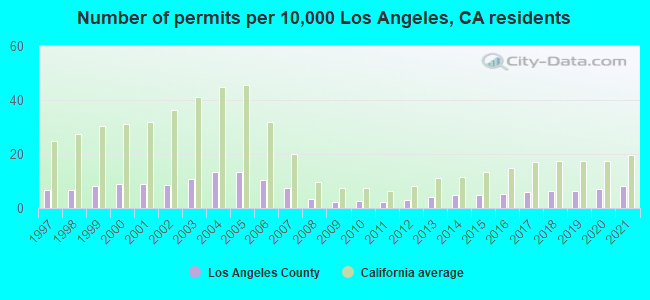
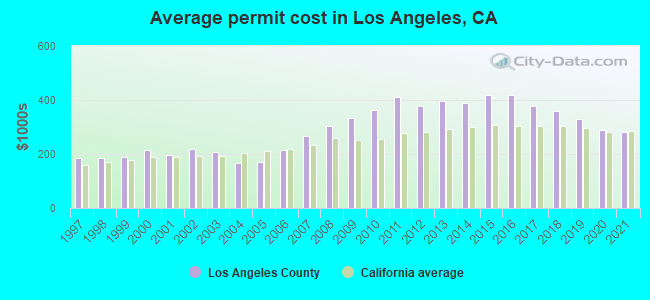
Single-family new house construction building permits:
- 2022: 8253 buildings, average cost: $260,200
- 2021: 7657 buildings, average cost: $280,500
- 2020: 6752 buildings, average cost: $288,700
- 2019: 5884 buildings, average cost: $328,600
- 2018: 5957 buildings, average cost: $360,500
- 2017: 5683 buildings, average cost: $377,900
- 2016: 5022 buildings, average cost: $418,600
- 2015: 4638 buildings, average cost: $417,600
- 2014: 4586 buildings, average cost: $388,400
- 2013: 3839 buildings, average cost: $395,600
- 2012: 2675 buildings, average cost: $376,300
- 2011: 2275 buildings, average cost: $410,100
- 2010: 2384 buildings, average cost: $363,600
- 2009: 2268 buildings, average cost: $331,700
- 2008: 3249 buildings, average cost: $305,400
- 2007: 7102 buildings, average cost: $268,100
- 2006: 9942 buildings, average cost: $216,000
- 2005: 12523 buildings, average cost: $171,500
- 2004: 12763 buildings, average cost: $168,300
- 2003: 10326 buildings, average cost: $207,200
- 2002: 8280 buildings, average cost: $219,700
- 2001: 8308 buildings, average cost: $197,200
- 2000: 8372 buildings, average cost: $215,800
- 1999: 7826 buildings, average cost: $189,100
- 1998: 6423 buildings, average cost: $187,000
- 1997: 6353 buildings, average cost: $183,800
Median real estate property taxes paid for housing units with mortgages in 2022: $5,933 (0.7%)
Median real estate property taxes paid for housing units with no mortgage in 2022: $3,955 (0.5%)
| Los Angeles County: | 13.9% |
| California: | 12.2% |
Median age of residents in 2022: 38.2 years old
(Males: 37.2 years old, Females: 39.2 years old)
(Median age for: White residents: 45.7 years old, Black residents: 39.2 years old, American Indian residents: 37.1 years old, Asian residents: 44.2 years old, Hispanic or Latino residents: 33.3 years old, Other race residents: 33.5 years old)
Area name: Los Angeles-Long Beach, CA HUD Metro FMR Area
Fair market rent in 2006 for a 1-bedroom apartment in Los Angeles County is $952 a month.
Fair market rent for a 2-bedroom apartment is $1189 a month.
Fair market rent for a 3-bedroom apartment is $1597 a month.
Cities in this county include: Los Angeles, East San Gabriel Valley, Long Beach, Upper San Gabriel Valley, Southwest San Gabriel Valley, Glendale, Newhall, South Antelope Valley, Santa Clarita, North Antelope Valley.
| Zip code | City | Number of tests | Number of tests >= 4 pCi/L |
|---|---|---|---|
| 90001 | Los Angeles | 43 | 1 |
| 90002 | Los Angeles | 3 | 0 |
| 90003 | Los Angeles | 3 | 0 |
| 90004 | Los Angeles | 54 | 0 |
| 90005 | Los Angeles | 8 | 0 |
| 90006 | Los Angeles | 13 | 0 |
| 90007 | Los Angeles | 40 | 1 |
| 90008 | Los Angeles | 4 | 0 |
| 90010 | Los Angeles | 11 | 1 |
| 90011 | Los Angeles | 1 | 0 |
| 90012 | Los Angeles | 7 | 0 |
| 90013 | Los Angeles | 4 | 0 |
| 90014 | Los Angeles | 4 | 0 |
| 90016 | Los Angeles | 6 | 0 |
| 90017 | Los Angeles | 15 | 0 |
| 90018 | Los Angeles | 4 | 0 |
| 90019 | Los Angeles | 21 | 0 |
| 90020 | Los Angeles | 16 | 0 |
| 90021 | Los Angeles | 2 | 0 |
| 90023 | Los Angeles | 4 | 0 |
| 90024 | Los Angeles | 74 | 3 |
| 90025 | Los Angeles | 90 | 7 |
| 90026 | Los Angeles | 37 | 3 |
| 90027 | Los Angeles | 55 | 8 |
| 90028 | Los Angeles | 11 | 0 |
| 90029 | Los Angeles | 5 | 0 |
| 90031 | Los Angeles | 20 | 0 |
| 90032 | Los Angeles | 9 | 1 |
| 90033 | Los Angeles | 4 | 0 |
| 90034 | Los Angeles | 52 | 0 |
| 90035 | Los Angeles | 38 | 0 |
| 90036 | Los Angeles | 45 | 1 |
| 90037 | Los Angeles | 3 | 0 |
| 90038 | Los Angeles | 2 | 0 |
| 90039 | Los Angeles | 13 | 2 |
| 90040 | Los Angeles | 1 | 0 |
| 90041 | Los Angeles | 23 | 1 |
| 90042 | Los Angeles | 26 | 2 |
| 90043 | Los Angeles | 18 | 8 |
| 90044 | Los Angeles | 2 | 0 |
| 90045 | Los Angeles | 53 | 4 |
| 90046 | Los Angeles | 75 | 7 |
| 90047 | Los Angeles | 10 | 0 |
| 90048 | Los Angeles | 38 | 1 |
| 90049 | Los Angeles | 162 | 16 |
| 90050 | Los Angeles | 1 | 0 |
| 90052 | Los Angeles | 1 | 0 |
| 90056 | Los Angeles | 5 | 0 |
| 90057 | Los Angeles | 6 | 1 |
| 90059 | Los Angeles | 7 | 0 |
| 90062 | Los Angeles | 1 | 0 |
| 90063 | Los Angeles | 3 | 0 |
| 90064 | Los Angeles | 87 | 1 |
| 90065 | Los Angeles | 13 | 3 |
| 90066 | Los Angeles | 94 | 2 |
| 90067 | Los Angeles | 7 | 0 |
| 90068 | Los Angeles | 118 | 5 |
| 90069 | West Hollywood | 28 | 0 |
| 90071 | Los Angeles | 1 | 0 |
| 90076 | Los Angeles | 1 | 0 |
| 90077 | Los Angeles | 58 | 15 |
| 90078 | Los Angeles | 4 | 2 |
| 90082 | Los Angeles | 1 | 0 |
| 90086 | Los Angeles | 1 | 0 |
| 90093 | Los Angeles | 2 | 0 |
| 90201 | Bell | 3 | 0 |
| 90209 | Beverly Hills | 2 | 0 |
| 90210 | Beverly Hills | 147 | 13 |
| 90211 | Beverly Hills | 34 | 0 |
| 90212 | Beverly Hills | 49 | 6 |
| 90213 | Beverly Hills | 1 | 0 |
| 90220 | Compton | 4 | 0 |
| 90221 | Compton | 1 | 0 |
| 90222 | Compton | 1 | 0 |
| 90224 | Compton | 2 | 1 |
| 90230 | Culver City | 43 | 6 |
| 90232 | Culver City | 13 | 0 |
| 90233 | Culver City | 1 | 0 |
| 90240 | Downey | 6 | 0 |
| 90241 | Downey | 14 | 0 |
| 90242 | Downey | 7 | 0 |
| 90245 | El Segundo | 88 | 1 |
| 90247 | Gardena | 21 | 0 |
| 90248 | Gardena | 2 | 0 |
| 90249 | Gardena | 8 | 0 |
| 90250 | Hawthorne | 19 | 0 |
| 90254 | Hermosa Beach | 34 | 1 |
| 90255 | Huntington Park | 1 | 0 |
| 90260 | Lawndale | 9 | 0 |
| 90262 | Lynwood | 4 | 0 |
| 90264 | Malibu | 1 | 0 |
| 90265 | Malibu | 69 | 9 |
| 90266 | Manhattan Beach | 48 | 1 |
| 90267 | Manhattan Beach | 2 | 0 |
| 90270 | Maywood | 1 | 0 |
| 90272 | Pacific Palisades | 266 | 13 |
| 90274 | Palos Verdes Peninsula | 296 | 83 |
| 90275 | Rancho Palos Verdes | 397 | 75 |
| 90277 | Redondo Beach | 81 | 4 |
| 90278 | Redondo Beach | 51 | 0 |
| 90280 | South Gate | 10 | 0 |
| 90290 | Topanga | 47 | 2 |
| 90291 | Venice | 34 | 2 |
| 90292 | Marina Del Rey | 25 | 2 |
| 90293 | Playa Del Rey | 17 | 0 |
| 90294 | Venice | 1 | 0 |
| 90295 | Marina Del Rey | 1 | 0 |
| 90301 | Inglewood | 4 | 2 |
| 90302 | Inglewood | 4 | 0 |
| 90303 | Inglewood | 1 | 0 |
| 90304 | Inglewood | 1 | 0 |
| 90305 | Inglewood | 2 | 0 |
| 90309 | Inglewood | 1 | 0 |
| 90401 | Santa Monica | 11 | 0 |
| 90402 | Santa Monica | 81 | 16 |
| 90403 | Santa Monica | 31 | 1 |
| 90404 | Santa Monica | 9 | 0 |
| 90405 | Santa Monica | 65 | 3 |
| 90406 | Santa Monica | 2 | 0 |
| 90409 | Santa Monica | 1 | 0 |
| 90501 | Torrance | 26 | 0 |
| 90502 | Torrance | 21 | 6 |
| 90503 | Torrance | 17 | 3 |
| 90504 | Torrance | 16 | 0 |
| 90505 | Torrance | 61 | 5 |
| 90509 | Torrance | 2 | 0 |
| 90510 | Torrance | 1 | 0 |
| 90601 | Whittier | 8 | 0 |
| 90602 | Whittier | 8 | 3 |
| 90603 | Whittier | 12 | 1 |
| 90604 | Whittier | 12 | 2 |
| 90605 | Whittier | 10 | 2 |
| 90606 | Whittier | 5 | 0 |
| 90637 | La Mirada | 3 | 0 |
| 90638 | La Mirada | 24 | 0 |
| 90640 | Montebello | 14 | 0 |
| 90650 | Norwalk | 13 | 0 |
| 90660 | Pico Rivera | 6 | 0 |
| 90670 | Santa Fe Springs | 3 | 0 |
| 90701 | Artesia | 8 | 0 |
| 90703 | Cerritos | 16 | 0 |
| 90704 | Avalon | 1 | 0 |
| 90706 | Bellflower | 22 | 0 |
| 90710 | Harbor City | 16 | 0 |
| 90711 | Lakewood | 2 | 0 |
| 90712 | Lakewood | 21 | 0 |
| 90713 | Lakewood | 23 | 0 |
| 90715 | Lakewood | 3 | 0 |
| 90716 | Hawaiian Gardens | 2 | 0 |
| 90717 | Lomita | 28 | 3 |
| 90723 | Paramount | 19 | 0 |
| 90731 | San Pedro | 51 | 5 |
| 90732 | San Pedro | 73 | 7 |
| 90744 | Wilmington | 7 | 0 |
| 90745 | Carson | 8 | 0 |
| 90746 | Carson | 9 | 0 |
| 90755 | Signal Hill | 5 | 0 |
| 90802 | Long Beach | 37 | 0 |
| 90803 | Long Beach | 48 | 0 |
| 90804 | Long Beach | 14 | 1 |
| 90805 | Long Beach | 11 | 0 |
| 90806 | Long Beach | 12 | 0 |
| 90807 | Long Beach | 25 | 0 |
| 90808 | Long Beach | 21 | 0 |
| 90809 | Long Beach | 2 | 0 |
| 90810 | Long Beach | 11 | 0 |
| 90813 | Long Beach | 1 | 0 |
| 90814 | Long Beach | 10 | 0 |
| 90815 | Long Beach | 35 | 1 |
| 90832 | Long Beach | 2 | 0 |
| 91001 | Altadena | 45 | 3 |
| 91006 | Arcadia | 48 | 0 |
| 91007 | Arcadia | 16 | 0 |
| 91009 | Duarte | 1 | 0 |
| 91010 | Duarte | 13 | 0 |
| 91011 | La Canada Flintridge | 56 | 2 |
| 91012 | La Canada | 2 | 0 |
| 91016 | Monrovia | 21 | 0 |
| 91017 | Monrovia | 1 | 0 |
| 91020 | Montrose | 10 | 0 |
| 91024 | Sierra Madre | 14 | 0 |
| 91030 | South Pasadena | 39 | 10 |
| 91031 | South Pasadena | 2 | 1 |
| 91040 | Sunland | 37 | 0 |
| 91042 | Tujunga | 50 | 4 |
| 91077 | Arcadia | 1 | 0 |
| 91101 | Pasadena | 35 | 1 |
| 91102 | Pasadena | 1 | 0 |
| 91103 | Pasadena | 17 | 0 |
| 91104 | Pasadena | 22 | 3 |
| 91105 | Pasadena | 27 | 1 |
| 91106 | Pasadena | 22 | 2 |
| 91107 | Pasadena | 45 | 1 |
| 91108 | San Marino | 42 | 1 |
| 91109 | Pasadena | 2 | 0 |
| 91118 | San Marino | 2 | 0 |
| 91125 | Pasadena | 1 | 0 |
| 91201 | Glendale | 15 | 0 |
| 91202 | Glendale | 19 | 0 |
| 91203 | Glendale | 4 | 1 |
| 91204 | Glendale | 1 | 0 |
| 91205 | Glendale | 4 | 1 |
| 91206 | Glendale | 31 | 0 |
| 91207 | Glendale | 15 | 0 |
| 91208 | Glendale | 40 | 0 |
| 91209 | Glendale | 1 | 0 |
| 91214 | La Crescenta | 33 | 0 |
| 91301 | Agoura Hills | 526 | 58 |
| 91302 | Calabasas | 306 | 52 |
| 91303 | Canoga Park | 44 | 3 |
| 91304 | Canoga Park | 185 | 29 |
| 91306 | Winnetka | 61 | 7 |
| 91307 | West Hills | 215 | 64 |
| 91308 | West Hills | 2 | 1 |
| 91309 | Canoga Park | 1 | 0 |
| 91311 | Chatsworth | 196 | 32 |
| 91313 | Chatsworth | 2 | 0 |
| 91316 | Encino | 203 | 61 |
| 91321 | Newhall | 18 | 0 |
| 91324 | Northridge | 63 | 10 |
| 91325 | Northridge | 102 | 28 |
| 91326 | Northridge | 163 | 5 |
| 91330 | Northridge | 3 | 1 |
| 91331 | Pacoima | 34 | 0 |
| 91335 | Reseda | 119 | 24 |
| 91337 | Reseda | 1 | 0 |
| 91340 | San Fernando | 1 | 0 |
| 91342 | Sylmar | 65 | 14 |
| 91343 | North Hills | 97 | 7 |
| 91344 | Granada Hills | 164 | 27 |
| 91345 | Mission Hills | 20 | 0 |
| 91350 | Santa Clarita | 47 | 0 |
| 91351 | Canyon Country | 23 | 0 |
| 91352 | Sun Valley | 18 | 2 |
| 91354 | Valencia | 18 | 0 |
| 91355 | Valencia | 56 | 0 |
| 91356 | Tarzana | 210 | 34 |
| 91357 | Tarzana | 1 | 0 |
| 91363 | Westlake Village | 1 | 0 |
| 91364 | Woodland Hills | 294 | 93 |
| 91365 | Woodland Hills | 18 | 8 |
| 91367 | Woodland Hills | 348 | 117 |
| 91372 | Calabasas | 9 | 4 |
| 91376 | Agoura Hills | 1 | 0 |
| 91380 | Santa Clarita | 3 | 0 |
| 91381 | Stevenson Ranch | 16 | 0 |
| 91384 | Castaic | 23 | 0 |
| 91385 | Valencia | 1 | 0 |
| 91387 | Canyon Country | 24 | 0 |
| 91390 | Santa Clarita | 12 | 0 |
| 91392 | Sylmar | 2 | 0 |
| 91394 | Granada Hills | 4 | 0 |
| 91401 | Van Nuys | 61 | 0 |
| 91402 | Panorama City | 35 | 0 |
| 91403 | Sherman Oaks | 127 | 20 |
| 91405 | Van Nuys | 39 | 0 |
| 91406 | Van Nuys | 84 | 1 |
| 91408 | Van Nuys | 1 | 1 |
| 91409 | Van Nuys | 6 | 0 |
| 91411 | Van Nuys | 30 | 0 |
| 91412 | Panorama City | 1 | 0 |
| 91413 | Sherman Oaks | 4 | 1 |
| 91416 | Encino | 1 | 0 |
| 91423 | Sherman Oaks | 167 | 37 |
| 91426 | Encino | 2 | 1 |
| 91436 | Encino | 282 | 25 |
| 91501 | Burbank | 14 | 0 |
| 91502 | Burbank | 16 | 0 |
| 91503 | Burbank | 2 | 0 |
| 91504 | Burbank | 38 | 0 |
| 91505 | Burbank | 55 | 0 |
| 91506 | Burbank | 24 | 0 |
| 91508 | Burbank | 1 | 0 |
| 91510 | Burbank | 5 | 0 |
| 91522 | Burbank | 2 | 0 |
| 91601 | North Hollywood | 63 | 0 |
| 91602 | North Hollywood | 49 | 0 |
| 91604 | Studio City | 123 | 20 |
| 91605 | North Hollywood | 56 | 1 |
| 91606 | North Hollywood | 38 | 0 |
| 91607 | Valley Village | 90 | 0 |
| 91608 | Universal City | 4 | 0 |
| 91617 | Valley Village | 2 | 0 |
| 91702 | Azusa | 5 | 0 |
| 91706 | Baldwin Park | 5 | 0 |
| 91711 | Claremont | 35 | 0 |
| 91722 | Covina | 5 | 0 |
| 91723 | Covina | 4 | 0 |
| 91724 | Covina | 15 | 1 |
| 91731 | El Monte | 3 | 0 |
| 91732 | El Monte | 1 | 0 |
| 91733 | South El Monte | 1 | 0 |
| 91740 | Glendora | 26 | 0 |
| 91741 | Glendora | 10 | 0 |
| 91744 | La Puente | 9 | 0 |
| 91745 | Hacienda Heights | 22 | 0 |
| 91746 | La Puente | 9 | 0 |
| 91748 | Rowland Heights | 20 | 0 |
| 91750 | La Verne | 19 | 0 |
| 91754 | Monterey Park | 6 | 0 |
| 91755 | Monterey Park | 5 | 0 |
| 91756 | Monterey Park | 1 | 0 |
| 91759 | Mt Baldy | 1 | 1 |
| 91765 | Diamond Bar | 36 | 6 |
| 91766 | Pomona | 49 | 5 |
| 91767 | Pomona | 11 | 0 |
| 91768 | Pomona | 3 | 0 |
| 91769 | Pomona | 1 | 0 |
| 91770 | Rosemead | 9 | 2 |
| 91773 | San Dimas | 23 | 0 |
| 91775 | San Gabriel | 16 | 0 |
| 91776 | San Gabriel | 6 | 0 |
| 91780 | Temple City | 16 | 0 |
| 91788 | Walnut | 1 | 0 |
| 91789 | Walnut | 20 | 0 |
| 91790 | West Covina | 13 | 0 |
| 91791 | West Covina | 12 | 1 |
| 91792 | West Covina | 7 | 1 |
| 91801 | Alhambra | 26 | 1 |
| 91803 | Alhambra | 9 | 0 |
| 93510 | Acton | 10 | 0 |
| 93532 | Lake Hughes | 1 | 0 |
| 93534 | Lancaster | 20 | 0 |
| 93535 | Lancaster | 21 | 0 |
| 93536 | Lancaster | 31 | 1 |
| 93543 | Littlerock | 4 | 0 |
| 93544 | Llano | 2 | 0 |
| 93550 | Palmdale | 29 | 0 |
| 93551 | Palmdale | 30 | 0 |
| 93552 | Palmdale | 5 | 0 |
| 93553 | Pearblossom | 7 | 0 |
| 93590 | Palmdale | 1 | 0 |
| 93591 | Palmdale | 1 | 0 |
2023 air pollution in Los Angeles County:
Carbon Monoxide: 0.223 ppm (standard limit: 9 ppm). Near U.S. average.
Nitrogen Dioxide: 0.01 ppm (standard limit: 0.053 ppm). Above U.S. average.
Ozone (1-hour): 0.029 ppm (standard limit: 0.12 ppm). Below U.S. average.
Particulate Matter (PM10) Annual: 18.0 µg/m3. Near U.S. average.
Particulate Matter (PM2.5) Annual: 6.6 µg/m3(standard limit: 15.0 µg/m3). Near U.S. average.
Sulfur Oxides Annual: 0.000 ppm (standard limit: 0.03 ppm). Near U.S. average.
Neighboring counties: Autauga County, Alabama  , Dona Ana County, New Mexico , Colleton County, South Carolina , Butts County, Georgia , Lincoln Parish, Louisiana , Macon County, Alabama , Jones County, Georgia .
| Here: | 5.0% |
| California: | 5.1% |
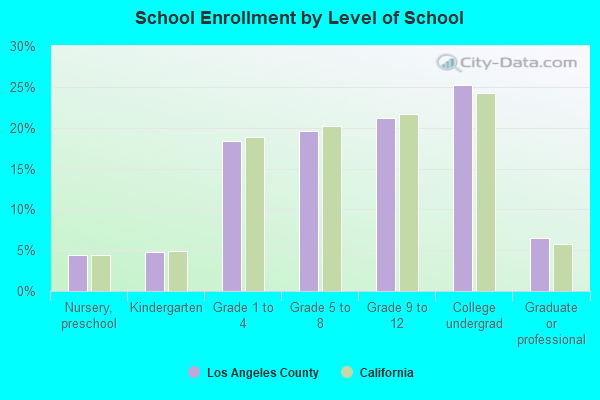
Current college students: 730,314
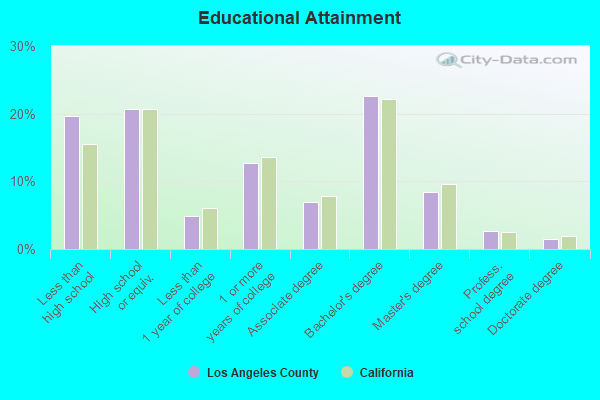
People 25 years of age or older with a high school degree or higher: 80.6%
People 25 years of age or older with a bachelor's degree or higher: 35.6%
Number of foreign born residents: 3,220,852 (54.6% naturalized citizens)
| Los Angeles County: | 33.1% |
| Whole state: | 26.7% |
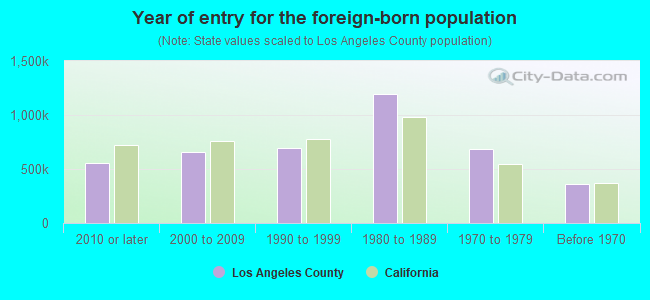
- Year of entry for the foreign-born population
- 636,9292010 or later
- 625,4292000 to 2009
- 674,8681990 to 1999
- 1,194,5621980 to 1989
- 688,7261970 to 1979
- 365,122Before 1970
Mean travel time to work (commute): minutes
Percentage of county residents living and working in this county: 99.7%
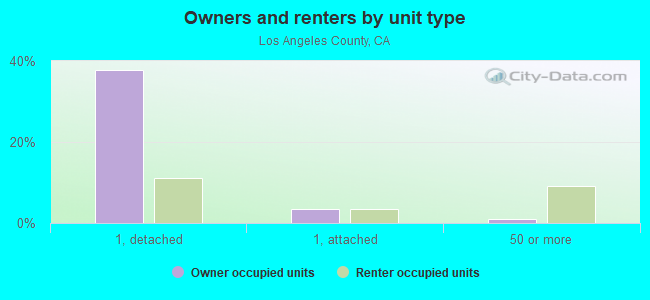
Housing units in structures:
- One, detached: 1,728,770
- One, attached: 244,918
- Two: 93,745
- 3 or 4: 216,539
- 5 to 9: 277,642
- 10 to 19: 274,716
- 20 to 49: 332,274
- 50 or more: 412,165
- Mobile homes: 58,281
- Boats, RVs, vans, etc.: 2,885
Housing units in Los Angeles County with a mortgage: 1,052,211 (97,441 second mortgage, 4,619 home equity loan, 76,464 both second mortgage and home equity loan)
Houses without a mortgage: 13,832
| Here: | 7.1% with mortgage |
| State: | 98.6% with mortgage |
Religion statistics for Los Angeles County


| Religion | Adherents | Congregations |
|---|---|---|
| Catholic | 3,542,994 | 275 |
| Evangelical Protestant | 814,611 | 3,249 |
| Other | 451,594 | 1,023 |
| Mainline Protestant | 229,056 | 860 |
| Black Protestant | 112,338 | 290 |
| Orthodox | 63,517 | 76 |
| None | 4,604,495 | - |
Source: Clifford Grammich, Kirk Hadaway, Richard Houseal, Dale E.Jones, Alexei Krindatch, Richie Stanley and Richard H.Taylor. 2012. 2010 U.S.Religion Census: Religious Congregations & Membership Study. Association of Statisticians of American Religious Bodies. Jones, Dale E., et al. 2002. Congregations and Membership in the United States 2000. Nashville, TN: Glenmary Research Center.
Food Environment Statistics:
| Los Angeles County: | 2.12 / 10,000 pop. |
| State: | 2.14 / 10,000 pop. |
| Here: | 0.03 / 10,000 pop. |
| California: | 0.04 / 10,000 pop. |
| This county: | 0.58 / 10,000 pop. |
| California: | 0.62 / 10,000 pop. |
| Los Angeles County: | 1.23 / 10,000 pop. |
| California: | 1.49 / 10,000 pop. |
| This county: | 7.15 / 10,000 pop. |
| State: | 7.42 / 10,000 pop. |
| Los Angeles County: | 7.5% |
| California: | 7.3% |
| Los Angeles County: | 20.4% |
| State: | 21.3% |
| Here: | 18.6% |
| State: | 17.9% |
Agriculture in Los Angeles County:
Average size of farms: 72 acresAverage value of agricultural products sold per farm: $182,309
Average value of crops sold per acre for harvested cropland: $11342.21
The value of nursery, greenhouse, floriculture, and sod as a percentage of the total market value of agricultural products sold: 76.42%
The value of livestock, poultry, and their products as a percentage of the total market value of agricultural products sold: 3.10%
Average total farm production expenses per farm: $137,099
Harvested cropland as a percentage of land in farms: 21.56%
Irrigated harvested cropland as a percentage of land in farms: 92.03%
Average market value of all machinery and equipment per farm: $46,652
The percentage of farms operated by a family or individual: 83.54%
Average age of principal farm operators: 56 years
Average number of cattle and calves per 100 acres of all land in farms: 4.54
All wheat for grain: 442 harvested acres
Vegetables: 7,079 harvested acres
Land in orchards: 2,764 acres
Earthquake activity:
Los Angeles County-area historical earthquake activity is significantly above California state average. It is 7053% greater than the overall U.S. average.On 7/21/1952 at 11:52:14, a magnitude 7.7 (7.7 UK, Class: Major, Intensity: VIII - XII) earthquake occurred 76.7 miles away from Los Angeles County center, causing $50,000,000 total damage
On 6/28/1992 at 11:57:34, a magnitude 7.6 (6.2 MB, 7.6 MS, 7.3 MW, Depth: 0.7 mi) earthquake occurred 97.7 miles away from the county center, causing 3 deaths (1 shaking deaths, 2 other deaths) and 400 injuries, causing $100,000,000 total damage and $40,000,000 insured losses
On 10/16/1999 at 09:46:44, a magnitude 7.4 (6.3 MB, 7.4 MS, 7.2 MW, 7.3 ML) earthquake occurred 107.0 miles away from the county center
On 11/4/1927 at 13:51:53, a magnitude 7.5 (7.5 UK) earthquake occurred 169.4 miles away from the county center
On 1/17/1994 at 12:30:55, a magnitude 6.8 (6.4 MB, 6.8 MS, 6.7 MW, Depth: 11.4 mi, Class: Strong, Intensity: VII - IX) earthquake occurred 20.1 miles away from Los Angeles County center, causing 60 deaths (60 shaking deaths) and 7000 injuries
On 4/21/1918 at 22:32:30, a magnitude 6.8 (6.8 UK) earthquake occurred 49.4 miles away from the county center
Magnitude types: body-wave magnitude (MB), local magnitude (ML), surface-wave magnitude (MS), moment magnitude (MW)
Most recent natural disasters:
- California Wildfires, Incident Period: September 4, 2020 - November 17, 2020, FEMA Id: 4569, Natural disaster type: Fire
- California Covid-19 Pandemic, Incident Period: January 20, 2020, FEMA Id: 4482, Natural disaster type: Other
- California Wildfires, Incident Period: November 8, 2018 - November 25, 2018, Major Disaster (Presidential) Declared DR-4407-CA: November 12, 2018, FEMA Id: 4407, Natural disaster type: Fire
- California Wildfires, Flooding, Mudflows, And Debris Flows, Incident Period: December 4, 2017 - January 31, 2018, FEMA Id: 4353, Natural disaster type: Fire, Flood
- California Severe Winter Storms, Flooding, And Mudslides, Incident Period: January 18, 2017 - January 23, 2017, FEMA Id: 4305, Natural disaster type: Winter Storm, Mudslide, Flood
- California Crown Fire, Incident Period: July 29, 2010 to August 03, 2010, Fire Management Assistance Declared: July 30, 2010, FEMA Id: 2851, Natural disaster type: Fire
- California Severe Winter Storms, Flooding, and Debris and Mud Flows, Incident Period: January 17, 2010 to February 06, 2010, Major Disaster (Presidential) Declared DR-1884: March 08, 2010, FEMA Id: 1884, Natural disaster type: Winter Storm, Flood
- California Station Fire, Incident Period: August 27, 2009 to September 25, 2009, Fire Management Assistance Declared: August 28, 2009, FEMA Id: 2830, Natural disaster type: Fire
- California PV Fire, Incident Period: August 27, 2009 to August 29, 2009, Fire Management Assistance Declared: August 28, 2009, FEMA Id: 2828, Natural disaster type: Fire
- California Freeway Complex Fire, Incident Period: November 15, 2008 to November 20, 2008, Fire Management Assistance Declared: November 15, 2008, FEMA Id: 2792, Natural disaster type: Fire
- 47 other natural disasters have been reported since 1953.
The number of natural disasters in Los Angeles County (57) is a lot greater than the US average (15).
Major Disasters (Presidential) Declared: 27
Emergencies Declared: 3
Causes of natural disasters: Fires: 37, Floods: 16, Storms: 9, Winter Storms: 6, Landslides: 5, Mudslides: 5, Earthquakes: 3, Freeze: 1, Heavy Rain: 1, Hurricane: 1, Snow: 1, Tornado: 1, Wind: 1, Other: 1 (Note: some incidents may be assigned to more than one category).
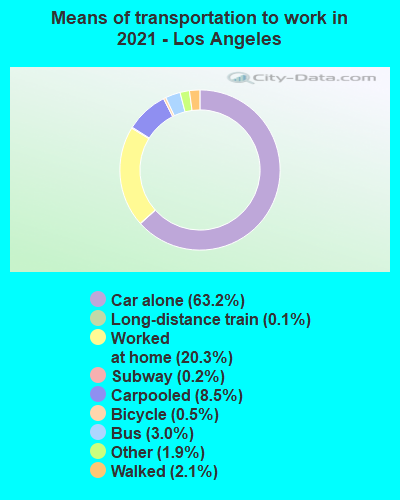
Means of transportation to work:
- Drove a car alone: 3,151,077 (64.8%)
- Carpooled: 474,953 (9.8%)
- Bus: 157,761 (3.2%)
- Subway or elevated rail: 15,724 (0.3%)
- Long-distance train or commuter rail: 7,870 (0.2%)
- Light rail, streetcar or trolley: 3,186 (0.1%)
- Ferryboat: 1,692 (0.0%)
- Taxicab, motorcycle, or other means: 94,215 (1.9%)
- Bicycle: 27,863 (0.6%)
- Walked: 118,101 (2.4%)
- Worked at home: 810,443 (16.7%)
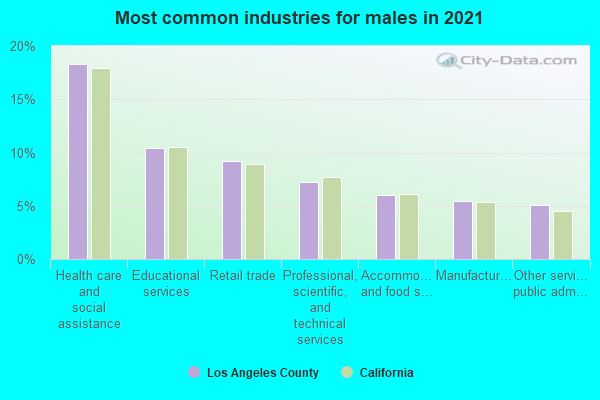
- Health care and social assistance (18%)
- Educational services (10%)
- Retail trade (9%)
- Professional, scientific, and technical services (7%)
- Accommodation and food services (7%)
- Other services, except public administration (6%)
- Manufacturing (5%)
- Health care and social assistance (21%)
- Educational services (12%)
- Retail trade (10%)
- Professional, scientific, and technical services (9%)
- Accommodation and food services (8%)
- Other services, except public administration (7%)
- Manufacturing (6%)

- Management occupations (11%)
- Construction and extraction occupations (9%)
- Sales and related occupations (9%)
- Office and administrative support occupations (7%)
- Production occupations (7%)
- Transportation occupations (6%)
- Arts, design, entertainment, sports, and media occupations (6%)
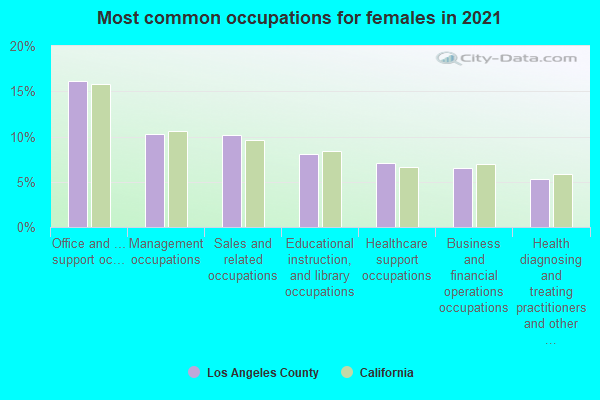
- Office and administrative support occupations (16%)
- Management occupations (10%)
- Sales and related occupations (10%)
- Educational instruction, and library occupations (8%)
- Business and financial operations occupations (7%)
- Healthcare support occupations (7%)
- Food preparation and serving related occupations (6%)
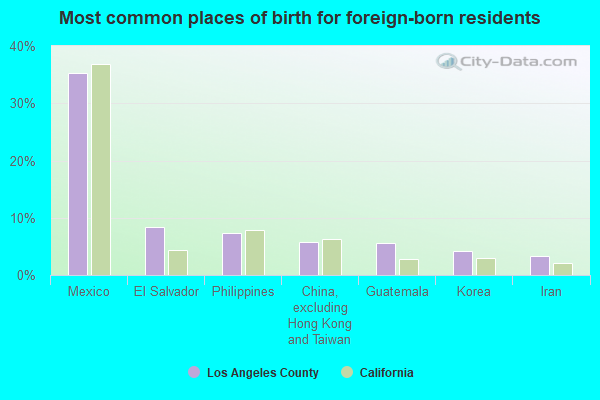
- Mexico (35%)
- El Salvador (8%)
- Philippines (7%)
- Guatemala (6%)
- China, excluding Hong Kong and Taiwan (6%)
- Korea (4%)
- Iran (3%)
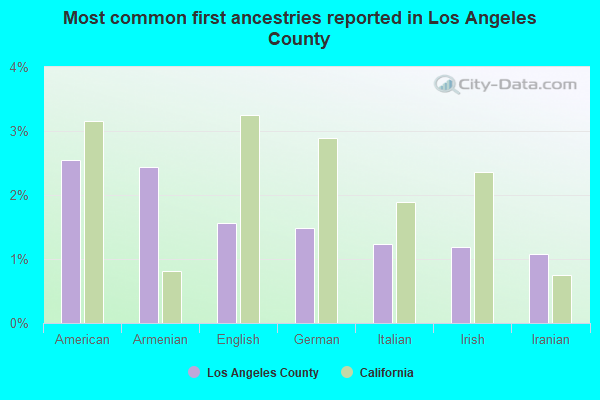
- American (2%)
- Armenian (2%)
- English (2%)
- German (1%)
- Irish (1%)
- Italian (1%)
- European (1%)
People in group quarters in Los Angeles County, California in 2010:
- 51,477 people in college/university student housing
- 35,612 people in nursing facilities/skilled-nursing facilities
- 19,659 people in other noninstitutional facilities
- 16,535 people in local jails and other municipal confinement facilities
- 10,712 people in group homes intended for adults
- 8,492 people in emergency and transitional shelters (with sleeping facilities) for people experiencing homelessness
- 7,231 people in residential treatment centers for adults
- 5,511 people in state prisons
- 5,343 people in workers' group living quarters and job corps centers
- 2,616 people in correctional facilities intended for juveniles
- 2,269 people in federal detention centers
- 1,119 people in mental (psychiatric) hospitals and psychiatric units in other hospitals
- 1,114 people in group homes for juveniles (non-correctional)
- 1,055 people in federal prisons
- 1,016 people in residential treatment centers for juveniles (non-correctional)
- 764 people in correctional residential facilities
- 613 people in hospitals with patients who have no usual home elsewhere
- 329 people in in-patient hospice facilities
- 129 people in residential schools for people with disabilities
- 63 people in maritime/merchant vessels
- 22 people in military barracks and dormitories (nondisciplinary)
People in group quarters in Los Angeles County, California in 2000:
- 41,103 people in college dormitories (includes college quarters off campus)
- 36,088 people in nursing homes
- 27,338 people in other noninstitutional group quarters
- 19,489 people in local jails and other confinement facilities (including police lockups)
- 7,514 people in homes or halfway houses for drug/alcohol abuse
- 6,222 people in other group homes
- 4,726 people in state prisons
- 3,630 people in other nonhousehold living situations
- 3,353 people in homes for the mentally retarded
- 3,331 people in homes for the mentally ill
- 2,994 people in mental (psychiatric) hospitals or wards
- 2,859 people in federal prisons and detention centers
- 2,684 people in religious group quarters
- 2,593 people in short-term care, detention or diagnostic centers for delinquent children
- 2,033 people in hospitals/wards and hospices for chronically ill
- 1,781 people in training schools for juvenile delinquents
- 1,404 people in other hospitals or wards for chronically ill
- 993 people in homes for the physically handicapped
- 899 people in schools, hospitals, or wards for the intellectually disabled
- 853 people in unknown juvenile institutions
- 825 people in wards in general hospitals for patients who have no usual home elsewhere
- 566 people in halfway houses
- 553 people in other types of correctional institutions
- 546 people in other workers' dormitories
- 518 people in job corps and vocational training facilities
- 461 people in hospices or homes for chronically ill
- 396 people in orthopedic wards and institutions for the physically handicapped
- 378 people in hospitals or wards for drug/alcohol abuse
- 231 people in homes for abused, dependent, and neglected children
- 188 people in institutions for the deaf
- 168 people in military hospitals or wards for chronically ill
- 143 people in residential treatment centers for emotionally disturbed children
- 108 people in agriculture workers' dormitories on farms
- 93 people in military ships
- 87 people in institutions for the blind
- 70 people in military barracks, etc.
- 37 people in crews of maritime vessels
- 30 people in wards in military hospitals for patients who have no usual home elsewhere
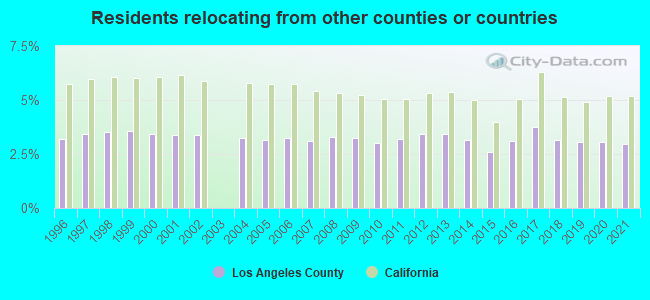
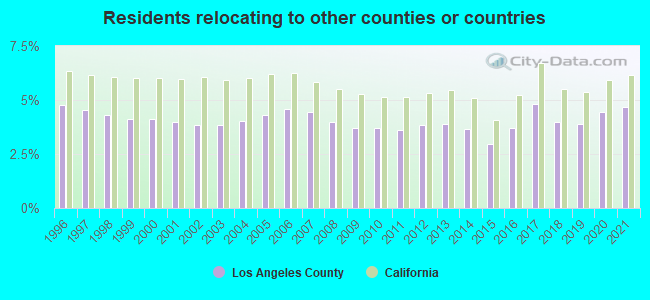
2.98% of this county's 2021 resident taxpayers lived in other counties in 2020 ($81,235 average adjusted gross income)
| Here: | 2.98% |
| California average: | 5.19% |
0.01% of residents moved from foreign countries ($155 average AGI)
Los Angeles County: 0.01% California average: 0.03%
1.58% relocated from other counties in California ($41,653 average AGI)
1.39% relocated from other states ($39,428 average AGI)
Los Angeles County: 1.39% California average: 1.56%
Top counties from which taxpayers relocated into this county between 2020 and 2021:
| from Orange County, CA | |
| from San Bernardino County, CA | |
| from Riverside County, CA | |
| from San Diego County, CA | |
| from Ventura County, CA | |
| from San Francisco County, CA | |
| from Clark County, NV |
4.68% of this county's 2020 resident taxpayers moved to other counties in 2021 ($97,324 average adjusted gross income)
| Here: | 4.68% |
| California average: | 6.14% |
0.01% of residents moved to foreign countries ($196 average AGI)
Los Angeles County: 0.01% California average: 0.02%
2.50% relocated to other counties in California ($45,603 average AGI)
2.17% relocated to other states ($51,525 average AGI)
Los Angeles County: 2.17% California average: 2.55%
Top counties to which taxpayers relocated from this county between 2020 and 2021:
| to Orange County, CA | |
| to San Bernardino County, CA | |
| to Riverside County, CA | |
| to Ventura County, CA | |
| to San Diego County, CA | |
| to Clark County, NV | |
| to Kern County, CA |
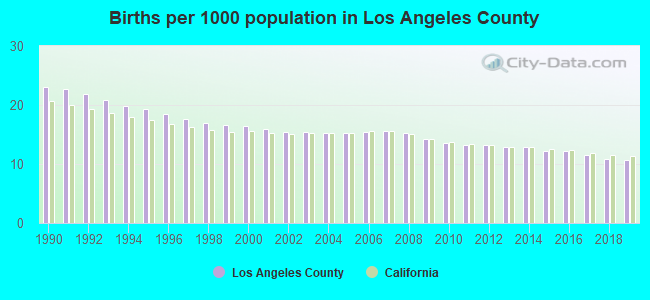
Births per 1000 population from 1990 to 1999: 19.7
Births per 1000 population from 2000 to 2009: 15.4
Births per 1000 population from 2010 to 2022: 10.2
Deaths per 1000 population from 1990 to 1999: 6.7
Deaths per 1000 population from 2000 to 2009: 6.1
Deaths per 1000 population from 2010 to 2020: 6.3

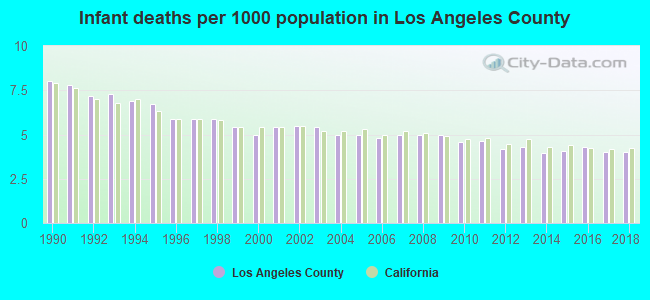
Infant deaths per 1000 live births from 1990 to 1999: 6.7
Infant deaths per 1000 live births from 2000 to 2009: 5.1
Infant deaths per 1000 live births from 2010 to 2021: 4.1
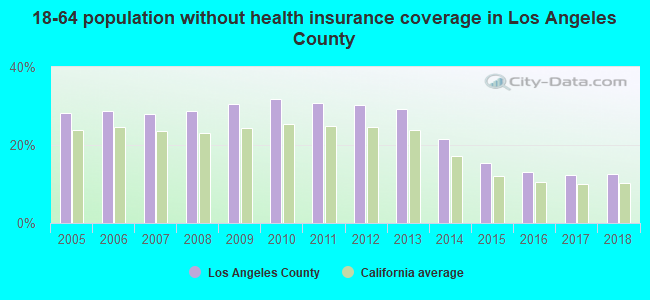
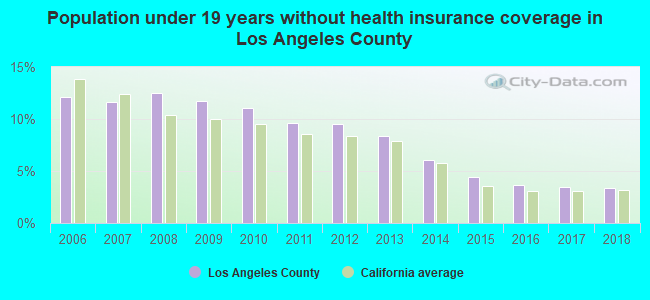
Persons under 19 years old without health insurance coverage in 2018: 3.4%
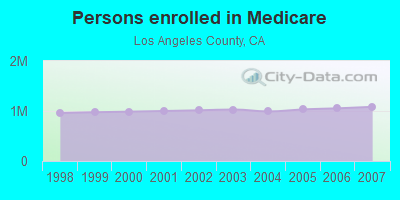
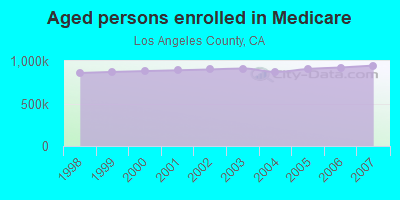
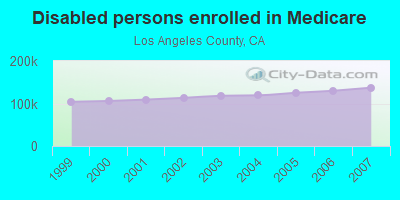
Persons enrolled in hospital insurance and/or supplemental medical insurance (Medicare) in July 1, 2007: 1,083,274 (946,076 aged, 137,198 disabled)
Children under 18 without health insurance coverage in 2007: 270,742 (10%)
Most common underlying causes of death in Los Angeles County, California in 1999 - 2019:
- Atherosclerotic heart disease (127,205)
- Acute myocardial infarction, unspecified (70,227)
- Atherosclerotic cardiovascular disease, so described (66,676)
- Bronchus or lung, unspecified - Malignant neoplasms (60,021)
- Alzheimer disease, unspecified (48,094)
- Chronic obstructive pulmonary disease, unspecified (44,433)
- Pneumonia, unspecified (40,270)
- Stroke, not specified as haemorrhage or infarction (35,039)
- Congestive heart failure (26,357)
- Breast, unspecified - Malignant neoplasms (23,875)
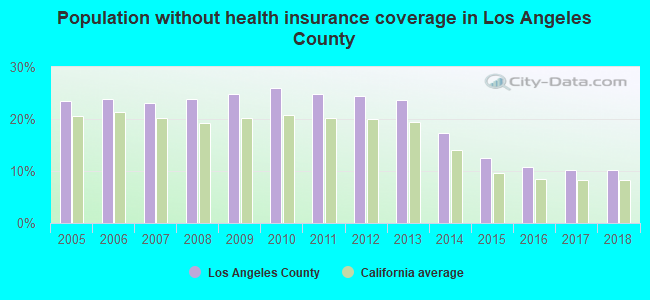
Population without health insurance coverage in 2000: 23%
Children under 18 without health insurance coverage in 2000: 19%
Homicides per 1,000,000 population from 2000 to 2006: 110.2. This is less than state average.
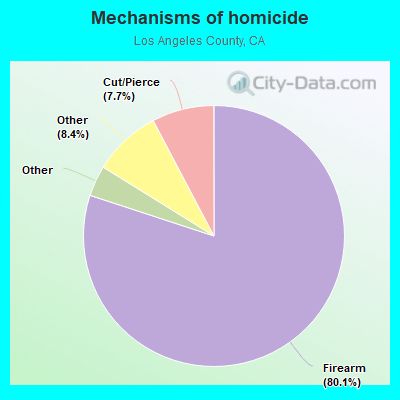
- Firearm - 88.3
- Cut/Pierce - 8.5
- Suffocation - 2.4
- Struck by/against - 0.6
- Transportation-Related, Overall - 0.5
- Terrorism - 0.3
- Poisoning - 0.3
- Other - 9.3
Suicides per 1,000,000 population from 2000 to 2006: 72.9. This is less than state average.
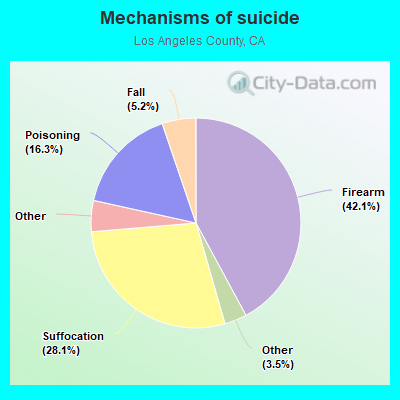
- Firearm - 30.7
- Suffocation - 20.5
- Poisoning - 11.9
- Fall - 3.8
- Cut/Pierce - 2.0
- Drowning - 0.6
- Fire/Burn - 0.5
- Transportation-Related, Overall - 0.4
- Other - 2.5
Household type by relationship:
Households: 9,721,138- Male householders: 1,744,014 (428,302 living alone), Female householders: 1,671,712 (485,459 living alone)
1,455,401 spouses (1,428,427 opposite-sex spouses), 281,090 unmarried partners, (262,426 opposite-sex unmarried partners), 2,827,568 children (2,707,462 natural, 39,418 adopted, 80,688 stepchildren), 285,276 grandchildren, 213,773 brothers or sisters, 315,701 parents, 6,218 foster children, 321,490 other relatives, 410,929 non-relatives
- In group quarters: 187,966
Size of family households: 758,325 2-persons, 529,314 3-persons, 474,632 4-persons, 259,684 5-persons, 104,586 6-persons, 90,709 7-or-more-persons.
Size of nonfamily households: 913,761 1-person, 228,289 2-persons, 35,505 3-persons, 13,693 4-persons, 3,578 5-persons, 1,893 6-persons, 1,757 7-or-more-persons.
1,085,558 married couples with children.
543,036 single-parent households (153,839 men, 389,197 women).
45.2% of residents of Los Angeles speak English at home.
37.7% of residents speak Spanish at home (58% speak English very well, 18% speak English well, 16% speak English not well, 8% don't speak English at all).
5.4% of residents speak other Indo-European language at home (65% speak English very well, 21% speak English well, 11% speak English not well, 4% don't speak English at all).
10.6% of residents speak Asian or Pacific Island language at home (49% speak English very well, 26% speak English well, 19% speak English not well, 6% don't speak English at all).
1.2% of residents speak other language at home (74% speak English very well, 16% speak English well, 7% speak English not well, 3% don't speak English at all).
In fiscal year 2004:
Federal Government expenditure: $59,186,337,000 ($5,956 per capita)
Department of Defense expenditure: $10,701,264,000
Federal direct payments to individuals for retirement and disability: $14,173,548,000
Federal other direct payments to individuals: $12,143,933,000
Federal direct payments not to individuals: $112,921,000
Federal grants: $14,859,308,000
Federal procurement contracts: $14,234,903,000 ($9,746,008,000 Department of Defense)
Federal salaries and wages: $3,661,724,000 ($483,161,000 Department of Defense)
Federal Government direct loans: $137,089,000
Federal guaranteed/insured loans: $2,812,723,000
Federal Government insurance: $4,910,094,000
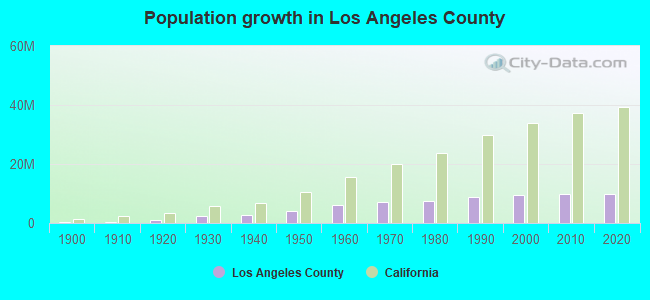
Population change from April 1, 2000 to July 1, 2005:
Births: 797,844| Here: | 80 per 1000 residents |
| State: | 77 per 1000 residents |
Deaths: 311,175
| Here: | 31 per 1000 residents |
| State: | 34 per 1000 residents |
Net international migration: +506,016
| Here: | +51 per 1000 residents |
| State: | +39 per 1000 residents |
Net internal migration: -562,351
| Here: | |
| State: |
Total withdrawal of fresh water for public supply: 1574.83 millions of gallons per day (41% from ground, 59% from surface)
| Here: | 5.8 |
| State: | 6.0 |
| Here: | 3.7 |
| State: | 3.9 |
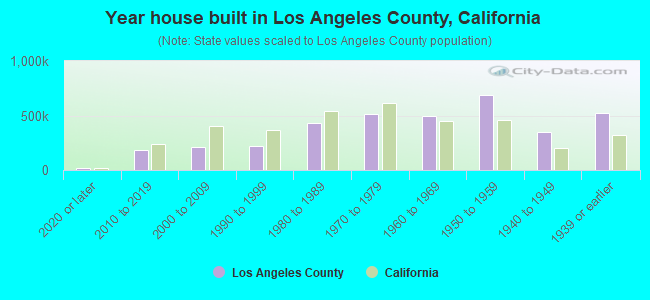
- Year house built in Los Angeles County, California
- 34,7822020 or later
- 176,6742010 to 2019
- 217,5162000 to 2009
- 217,5471990 to 1999
- 437,2761980 to 1989
- 490,4961970 to 1979
- 518,0831960 to 1969
- 678,1571950 to 1959
- 345,6401940 to 1949
- 525,7641939 or earlier
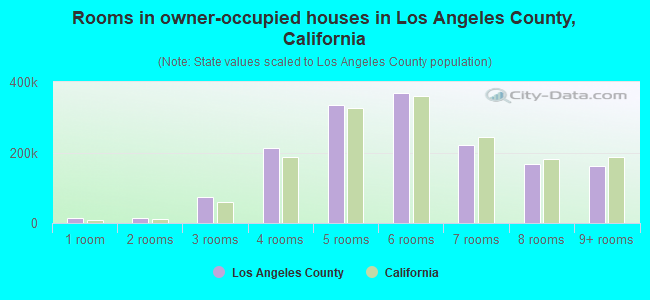
- Rooms in owner-occupied houses in Los Angeles County, California
- 13,2541 room
- 14,6082 rooms
- 70,9623 rooms
- 227,3804 rooms
- 335,5985 rooms
- 351,2766 rooms
- 222,0387 rooms
- 161,8488 rooms
- 155,0839+ rooms
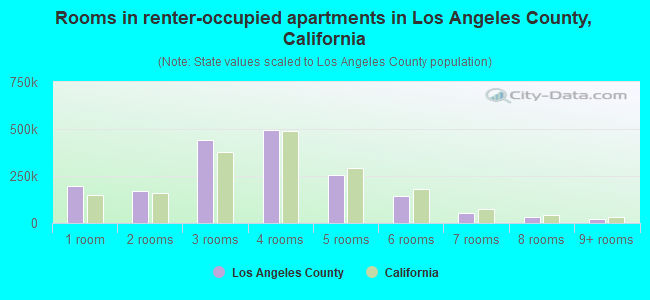
- Rooms in renter-occupied apartments in Los Angeles County, California
- 198,5051 room
- 199,3982 rooms
- 453,2733 rooms
- 504,9764 rooms
- 253,6805 rooms
- 147,8466 rooms
- 54,6467 rooms
- 31,7438 rooms
- 19,6129+ rooms
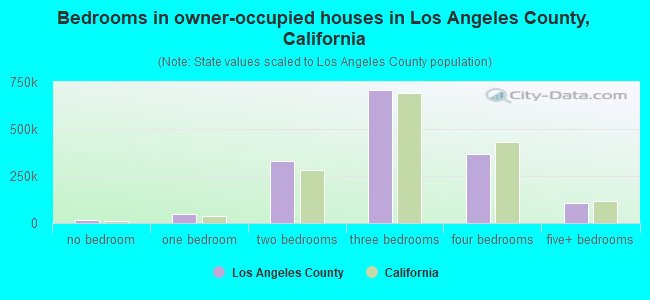
- Bedrooms in owner-occupied houses in Los Angeles County, California
- 16,722no bedroom
- 45,4381 bedroom
- 325,4232 bedrooms
- 692,4513 bedrooms
- 370,6454 bedrooms
- 101,3685+ bedrooms
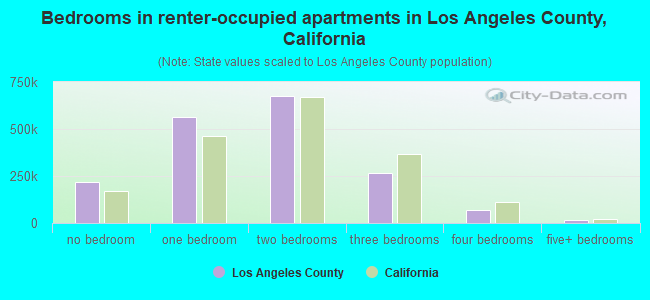
- Bedrooms in renter-occupied apartments in Los Angeles County, California
- 226,012no bedroom
- 585,6951 bedroom
- 684,1392 bedrooms
- 279,7753 bedrooms
- 73,2414 bedrooms
- 14,8175+ bedrooms
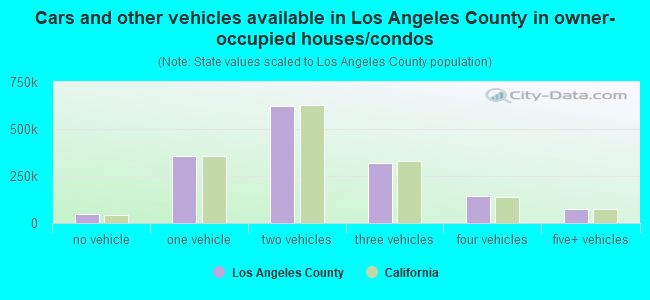
- Cars and other vehicles available in Los Angeles County in owner-occupied houses/condos
- 50,755no vehicle
- 353,8251 vehicle
- 616,6772 vehicles
- 313,2013 vehicles
- 145,3294 vehicles
- 72,2605+ vehicles
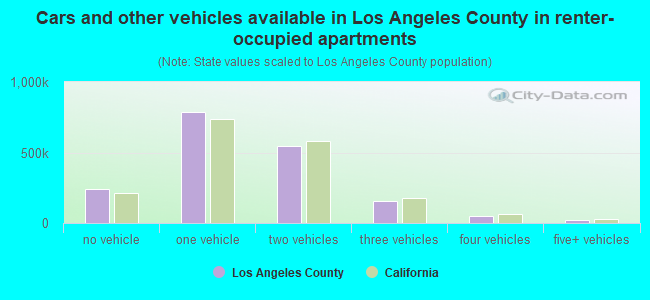
- Cars and other vehicles available in Los Angeles County in renter-occupied apartments
- 246,496no vehicle
- 839,2881 vehicle
- 557,9942 vehicles
- 151,3483 vehicles
- 48,8544 vehicles
- 19,6995+ vehicles
90.5% of Los Angeles County residents lived in the same house 1 years ago.
Out of people who lived in different houses, 42% lived in this county.
Out of people who lived in different counties, 55% lived in California.
| Los Angeles County: | 90.5% |
| State average: | 88.9% |
Place of birth for U.S.-born residents:
- This state: 5,120,892
- Other state: 1,239,756
- Northeast: 352,580
- Midwest: 334,945
- South: 372,457
- West: 179,774
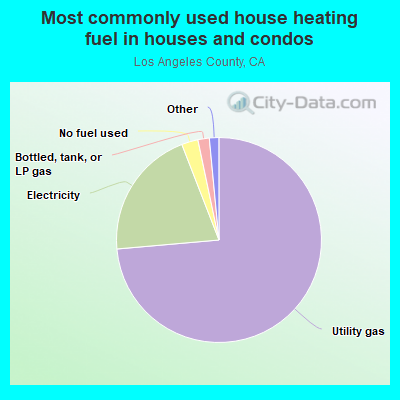
- 73.0%Utility gas
- 20.9%Electricity
- 2.7%No fuel used
- 1.8%Bottled, tank, or LP gas
- 1.1%Solar energy
- 0.3%Wood
- 0.2%Other fuel
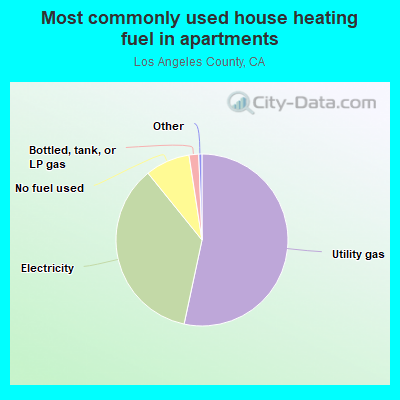
- 52.0%Utility gas
- 37.6%Electricity
- 8.0%No fuel used
- 1.9%Bottled, tank, or LP gas
- 0.2%Other fuel
- 0.1%Solar energy
Private vs. public school enrollment:
| Here: | 10.2% |
| California: | 10.5% |
| Here: | 9.8% |
| California: | 8.5% |
| Here: | 20.2% |
| California: | 15.9% |

Los Angeles County government finances - Expenditure in 2020:
- Assistance and Subsidies - Public Welfare, Cash Assistance Programs - Other: $2,159,886,000
Public Welfare, Cash Assistance Programs - Other: $1,983,451,000
- Bond Funds - Cash and Securities: $357,525,000
Cash and Securities: $179,733,000
- Charges - Hospital Public: $4,231,246,000
Hospital Public: $3,990,859,000
Other: $3,038,505,000
Other: $1,618,294,000
Natural Resources - Other: $158,353,000
Natural Resources - Other: $129,364,000
Solid Waste Management: $116,674,000
Sewerage: $80,106,000
Solid Waste Management: $58,973,000
Sewerage: $37,494,000
Parks and Recreation: $26,736,000
Regular Highways: $26,327,000
Parks and Recreation: $22,345,000
Elementary and Secondary Education - Other: $21,442,000
Elementary and Secondary Education - Other: $20,366,000
Regular Highways: $13,688,000
Air Transportation: $5,332,000
Air Transportation: $4,863,000
Higher Education - Other: $574,000
Higher Education - Other: $510,000
Elementary and Secondary Education School Lunch: $91,000
- Construction - Natural Resources - Other: $37,986,000
Parks and Recreation: $33,283,000
General - Other: $30,374,000
Parks and Recreation: $27,541,000
General - Other: $25,165,000
Natural Resources - Other: $20,106,000
General Public Buildings: $20,034,000
Police Protection: $19,426,000
Police Protection: $18,782,000
Local Fire Protection: $18,259,000
General Public Buildings: $16,611,000
Local Fire Protection: $15,340,000
Correctional Institutions: $13,670,000
Correctional Institutions: $11,379,000
Judicial and Legal Services: $7,109,000
Hospitals: $6,859,000
Corrections - Other: $6,140,000
Judicial and Legal Services: $5,863,000
Libraries: $5,123,000
Corrections - Other: $5,095,000
Health - Other: $3,916,000
Elementary and Secondary Education: $729,000
Elementary and Secondary Education: $227,000
Libraries: $123,000
- Current Operations - Health - Other: $5,707,981,000
Public Welfare - Other: $4,618,888,000
Public Welfare - Other: $4,081,879,000
Health - Other: $3,986,204,000
Hospitals: $3,792,309,000
Hospitals: $3,319,219,000
Police Protection: $2,049,887,000
Police Protection: $2,000,963,000
Correctional Institutions: $1,312,515,000
Local Fire Protection: $1,162,012,000
Correctional Institutions: $1,159,832,000
Local Fire Protection: $1,147,046,000
Judicial and Legal Services: $1,139,121,000
Judicial and Legal Services: $1,008,402,000
General - Other: $846,524,000
Housing and Community Development: $650,719,000
Corrections - Other: $541,896,000
Corrections - Other: $526,661,000
Parks and Recreation: $525,682,000
General - Other: $465,145,000
Housing and Community Development: $453,503,000
Parks and Recreation: $424,119,000
Regular Highways: $378,522,000
Elementary and Secondary Education: $372,393,000
Financial Administration: $337,462,000
Financial Administration: $325,067,000
Natural Resources - Other: $309,000,000
Central Staff Services: $290,711,000
Regular Highways: $282,738,000
Elementary and Secondary Education: $262,137,000
Central Staff Services: $252,196,000
Natural Resources - Other: $242,364,000
Transit Utilities: $202,473,000
Transit Utilities: $191,941,000
General Public Buildings: $151,957,000
Libraries: $142,014,000
Libraries: $138,465,000
General Public Buildings: $120,736,000
Solid Waste Management: $116,243,000
Water Utilities: $83,734,000
Water Utilities: $67,853,000
Sewerage: $60,986,000
Solid Waste Management: $49,482,000
Sewerage: $34,628,000
Protective Inspection and Regulation - Other: $11,990,000
Protective Inspection and Regulation - Other: $10,057,000
Other Higher Education: $8,622,000
Other Higher Education: $8,174,000
Air Transportation: $7,987,000
Parking Facilities: $6,626,000
Air Transportation: $3,405,000
- Federal Intergovernmental - Other: $1,326,391,000
Other: $715,800,000
Education: $169,325,000
Education: $166,596,000
Transit Utilities: $79,092,000
Transit Utilities: $66,487,000
Highways: $19,847,000
Highways: $13,866,000
Air Transportation: $8,316,000
Air Transportation: $8,194,000
Natural Resources: $7,751,000
Health and Hospitals: $6,641,000
Water Utilities: $2,183,000
General Local Government Support: $1,253,000
General Local Government Support: $1,160,000
Housing and Community Development: $806,000
Housing and Community Development: $759,000
Natural Resources: $738,000
Sewerage: $43,000
- General - Interest on Debt: $360,671,000
Interest on Debt: $323,718,000
- Intergovernmental to Local - Other - Elementary and Secondary Education: $105,727,000
Other - Elementary and Secondary Education: $56,619,000
Other - Natural Resources - Other: $3,583,000
Other - Natural Resources - Other: $2,315,000
Other - Local Fire Protection: $897,000
Other - Water Utilities: $2,000
- Intergovernmental to State - Judicial and Legal Services: $245,882,000
Judicial and Legal Services: $245,882,000
- Local Intergovernmental - Other: $422,105,000
Other: $385,826,000
Transit Utilities: $93,167,000
Transit Utilities: $76,647,000
Education: $61,153,000
Education: $41,976,000
Housing and Community Development: $33,276,000
Health and Hospitals: $23,207,000
Housing and Community Development: $16,477,000
Water Utilities: $1,947,000
Health and Hospitals: $76,000
Sewerage: $41,000
Sewerage: $41,000
Highways: $24,000
Water Utilities: $14,000
Highways: $13,000
- Long Term Debt - Outstanding Unspecified Public Purpose: $5,994,266,000
Beginning Outstanding - Unspecified Public Purpose: $5,757,331,000
Outstanding Unspecified Public Purpose: $5,252,097,000
Beginning Outstanding - Unspecified Public Purpose: $3,065,970,000
Issue, Unspecified Public Purpose: $2,254,792,000
Retired Unspecified Public Purpose: $1,157,057,000
Issue, Unspecified Public Purpose: $963,178,000
Retired Unspecified Public Purpose: $409,996,000
Beginning Outstanding - Public Debt for Private Purpose: $69,060,000
Outstanding Nonguaranteed - Industrial Revenue: $69,060,000
Beginning Outstanding - Public Debt for Private Purpose: $69,060,000
Outstanding Nonguaranteed - Industrial Revenue: $68,140,000
Retired Nonguaranteed - Public Debt for Private Purpose: $920,000
- Miscellaneous - Special Assessments: $400,198,000
General Revenue - Other: $382,258,000
Interest Earnings: $286,937,000
General Revenue - Other: $250,135,000
Rents: $152,892,000
Fines and Forfeits: $146,391,000
Rents: $144,128,000
Fines and Forfeits: $135,560,000
Special Assessments: $129,550,000
Interest Earnings: $114,274,000
Sale of Property: $1,862,000
Sale of Property: $1,800,000
Royalties: $482,000
Royalties: $88,000
Donations From Private Sources: $26,000
- Other Capital Outlay - General - Other: $343,509,000
General - Other: $227,869,000
Regular Highways: $44,332,000
Regular Highways: $41,890,000
Police Protection: $36,903,000
Health - Other: $29,412,000
Parking Facilities: $28,868,000
Parking Facilities: $28,522,000
Elementary and Secondary Education: $25,187,000
Public Welfare - Other: $10,840,000
Police Protection: $10,123,000
Correctional Institutions: $8,578,000
Correctional Institutions: $8,452,000
Air Transportation: $7,915,000
Elementary and Secondary Education: $6,376,000
Parks and Recreation: $6,100,000
Parks and Recreation: $4,481,000
Air Transportation: $4,044,000
Health - Other: $3,923,000
Public Welfare - Other: $3,776,000
Corrections - Other: $3,172,000
Central Staff Services: $2,762,000
Judicial and Legal Services: $2,711,000
Libraries: $2,457,000
Central Staff Services: $1,977,000
General Public Building: $1,826,000
Local Fire Protection: $964,000
Judicial and Legal Services: $893,000
Corrections - Other: $735,000
Natural Resources - Other: $638,000
Natural Resources - Other: $596,000
Financial Administration: $533,000
Libraries: $440,000
Financial Administration: $400,000
Protective Inspection and Regulation - Other: $205,000
- Other Funds - Cash and Securities: $18,981,142,000
Cash and Securities: $15,637,859,000
- Revenue - Water Utilities: $87,097,000
Water Utilities: $82,515,000
Transit Utilities: $4,088,000
Transit Utilities: $3,269,000
- Sinking Funds - Cash and Securities: $244,683,000
Cash and Securities: $146,403,000
- State Intergovernmental - Public Welfare: $5,445,722,000
Public Welfare: $5,182,355,000
Other: $3,490,217,000
Other: $3,139,423,000
Health and Hospitals: $2,058,691,000
Health and Hospitals: $1,663,196,000
Education: $348,164,000
Highways: $318,624,000
Highways: $222,655,000
Education: $207,812,000
General Local Government Support: $48,686,000
General Local Government Support: $44,609,000
Transit Utilities: $20,483,000
Transit Utilities: $19,623,000
Water Utilities: $492,000
Water Utilities: $428,000
Sewerage: $43,000
- Tax - Property: $9,222,570,000
Property: $7,110,264,000
General Sales and Gross Receipts: $714,924,000
General Sales and Gross Receipts: $452,202,000
Documentary and Stock Transfer: $104,872,000
Documentary and Stock Transfer: $83,371,000
Public Utilities Sales: $72,924,000
Public Utilities Sales: $72,776,000
Other License: $47,117,000
Other License: $35,360,000
Occupation and Business License - Other: $33,365,000
Occupation and Business License - Other: $29,850,000
Other Selective Sales: $22,404,000
Other: $19,672,000
Other Selective Sales: $19,343,000
Other: $6,802,000
- Total Salaries and Wages: $190,380,000
: $126,878,000
- Water Utilities - Interest on Debt: $156,000
Interest on Debt: $69,000
Los Angeles County government finances - Revenue in 2020:
- Assistance and Subsidies - Public Welfare, Cash Assistance Programs - Other: $2,159,886,000
Public Welfare, Cash Assistance Programs - Other: $1,983,451,000
- Bond Funds - Cash and Securities: $357,525,000
Cash and Securities: $179,733,000
- Charges - Hospital Public: $4,231,246,000
Hospital Public: $3,990,859,000
Other: $3,038,505,000
Other: $1,618,294,000
Natural Resources - Other: $158,353,000
Natural Resources - Other: $129,364,000
Solid Waste Management: $116,674,000
Sewerage: $80,106,000
Solid Waste Management: $58,973,000
Sewerage: $37,494,000
Parks and Recreation: $26,736,000
Regular Highways: $26,327,000
Parks and Recreation: $22,345,000
Elementary and Secondary Education - Other: $21,442,000
Elementary and Secondary Education - Other: $20,366,000
Regular Highways: $13,688,000
Air Transportation: $5,332,000
Air Transportation: $4,863,000
Higher Education - Other: $574,000
Higher Education - Other: $510,000
Elementary and Secondary Education School Lunch: $91,000
- Construction - Natural Resources - Other: $37,986,000
Parks and Recreation: $33,283,000
General - Other: $30,374,000
Parks and Recreation: $27,541,000
General - Other: $25,165,000
Natural Resources - Other: $20,106,000
General Public Buildings: $20,034,000
Police Protection: $19,426,000
Police Protection: $18,782,000
Local Fire Protection: $18,259,000
General Public Buildings: $16,611,000
Local Fire Protection: $15,340,000
Correctional Institutions: $13,670,000
Correctional Institutions: $11,379,000
Judicial and Legal Services: $7,109,000
Hospitals: $6,859,000
Corrections - Other: $6,140,000
Judicial and Legal Services: $5,863,000
Libraries: $5,123,000
Corrections - Other: $5,095,000
Health - Other: $3,916,000
Elementary and Secondary Education: $729,000
Elementary and Secondary Education: $227,000
Libraries: $123,000
- Current Operations - Health - Other: $5,707,981,000
Public Welfare - Other: $4,618,888,000
Public Welfare - Other: $4,081,879,000
Health - Other: $3,986,204,000
Hospitals: $3,792,309,000
Hospitals: $3,319,219,000
Police Protection: $2,049,887,000
Police Protection: $2,000,963,000
Correctional Institutions: $1,312,515,000
Local Fire Protection: $1,162,012,000
Correctional Institutions: $1,159,832,000
Local Fire Protection: $1,147,046,000
Judicial and Legal Services: $1,139,121,000
Judicial and Legal Services: $1,008,402,000
General - Other: $846,524,000
Housing and Community Development: $650,719,000
Corrections - Other: $541,896,000
Corrections - Other: $526,661,000
Parks and Recreation: $525,682,000
General - Other: $465,145,000
Housing and Community Development: $453,503,000
Parks and Recreation: $424,119,000
Regular Highways: $378,522,000
Elementary and Secondary Education: $372,393,000
Financial Administration: $337,462,000
Financial Administration: $325,067,000
Natural Resources - Other: $309,000,000
Central Staff Services: $290,711,000
Regular Highways: $282,738,000
Elementary and Secondary Education: $262,137,000
Central Staff Services: $252,196,000
Natural Resources - Other: $242,364,000
Transit Utilities: $202,473,000
Transit Utilities: $191,941,000
General Public Buildings: $151,957,000
Libraries: $142,014,000
Libraries: $138,465,000
General Public Buildings: $120,736,000
Solid Waste Management: $116,243,000
Water Utilities: $83,734,000
Water Utilities: $67,853,000
Sewerage: $60,986,000
Solid Waste Management: $49,482,000
Sewerage: $34,628,000
Protective Inspection and Regulation - Other: $11,990,000
Protective Inspection and Regulation - Other: $10,057,000
Other Higher Education: $8,622,000
Other Higher Education: $8,174,000
Air Transportation: $7,987,000
Parking Facilities: $6,626,000
Air Transportation: $3,405,000
- Federal Intergovernmental - Other: $1,326,391,000
Other: $715,800,000
Education: $169,325,000
Education: $166,596,000
Transit Utilities: $79,092,000
Transit Utilities: $66,487,000
Highways: $19,847,000
Highways: $13,866,000
Air Transportation: $8,316,000
Air Transportation: $8,194,000
Natural Resources: $7,751,000
Health and Hospitals: $6,641,000
Water Utilities: $2,183,000
General Local Government Support: $1,253,000
General Local Government Support: $1,160,000
Housing and Community Development: $806,000
Housing and Community Development: $759,000
Natural Resources: $738,000
Sewerage: $43,000
- General - Interest on Debt: $360,671,000
Interest on Debt: $323,718,000
- Intergovernmental to Local - Other - Elementary and Secondary Education: $105,727,000
Other - Elementary and Secondary Education: $56,619,000
Other - Natural Resources - Other: $3,583,000
Other - Natural Resources - Other: $2,315,000
Other - Local Fire Protection: $897,000
Other - Water Utilities: $2,000
- Intergovernmental to State - Judicial and Legal Services: $245,882,000
Judicial and Legal Services: $245,882,000
- Local Intergovernmental - Other: $422,105,000
Other: $385,826,000
Transit Utilities: $93,167,000
Transit Utilities: $76,647,000
Education: $61,153,000
Education: $41,976,000
Housing and Community Development: $33,276,000
Health and Hospitals: $23,207,000
Housing and Community Development: $16,477,000
Water Utilities: $1,947,000
Health and Hospitals: $76,000
Sewerage: $41,000
Sewerage: $41,000
Highways: $24,000
Water Utilities: $14,000
Highways: $13,000
- Long Term Debt - Outstanding Unspecified Public Purpose: $5,994,266,000
Beginning Outstanding - Unspecified Public Purpose: $5,757,331,000
Outstanding Unspecified Public Purpose: $5,252,097,000
Beginning Outstanding - Unspecified Public Purpose: $3,065,970,000
Issue, Unspecified Public Purpose: $2,254,792,000
Retired Unspecified Public Purpose: $1,157,057,000
Issue, Unspecified Public Purpose: $963,178,000
Retired Unspecified Public Purpose: $409,996,000
Beginning Outstanding - Public Debt for Private Purpose: $69,060,000
Outstanding Nonguaranteed - Industrial Revenue: $69,060,000
Beginning Outstanding - Public Debt for Private Purpose: $69,060,000
Outstanding Nonguaranteed - Industrial Revenue: $68,140,000
Retired Nonguaranteed - Public Debt for Private Purpose: $920,000
- Miscellaneous - Special Assessments: $400,198,000
General Revenue - Other: $382,258,000
Interest Earnings: $286,937,000
General Revenue - Other: $250,135,000
Rents: $152,892,000
Fines and Forfeits: $146,391,000
Rents: $144,128,000
Fines and Forfeits: $135,560,000
Special Assessments: $129,550,000
Interest Earnings: $114,274,000
Sale of Property: $1,862,000
Sale of Property: $1,800,000
Royalties: $482,000
Royalties: $88,000
Donations From Private Sources: $26,000
- Other Capital Outlay - General - Other: $343,509,000
General - Other: $227,869,000
Regular Highways: $44,332,000
Regular Highways: $41,890,000
Police Protection: $36,903,000
Health - Other: $29,412,000
Parking Facilities: $28,868,000
Parking Facilities: $28,522,000
Elementary and Secondary Education: $25,187,000
Public Welfare - Other: $10,840,000
Police Protection: $10,123,000
Correctional Institutions: $8,578,000
Correctional Institutions: $8,452,000
Air Transportation: $7,915,000
Elementary and Secondary Education: $6,376,000
Parks and Recreation: $6,100,000
Parks and Recreation: $4,481,000
Air Transportation: $4,044,000
Health - Other: $3,923,000
Public Welfare - Other: $3,776,000
Corrections - Other: $3,172,000
Central Staff Services: $2,762,000
Judicial and Legal Services: $2,711,000
Libraries: $2,457,000
Central Staff Services: $1,977,000
General Public Building: $1,826,000
Local Fire Protection: $964,000
Judicial and Legal Services: $893,000
Corrections - Other: $735,000
Natural Resources - Other: $638,000
Natural Resources - Other: $596,000
Financial Administration: $533,000
Libraries: $440,000
Financial Administration: $400,000
Protective Inspection and Regulation - Other: $205,000
- Other Funds - Cash and Securities: $18,981,142,000
Cash and Securities: $15,637,859,000
- Revenue - Water Utilities: $87,097,000
Water Utilities: $82,515,000
Transit Utilities: $4,088,000
Transit Utilities: $3,269,000
- Sinking Funds - Cash and Securities: $244,683,000
Cash and Securities: $146,403,000
- State Intergovernmental - Public Welfare: $5,445,722,000
Public Welfare: $5,182,355,000
Other: $3,490,217,000
Other: $3,139,423,000
Health and Hospitals: $2,058,691,000
Health and Hospitals: $1,663,196,000
Education: $348,164,000
Highways: $318,624,000
Highways: $222,655,000
Education: $207,812,000
General Local Government Support: $48,686,000
General Local Government Support: $44,609,000
Transit Utilities: $20,483,000
Transit Utilities: $19,623,000
Water Utilities: $492,000
Water Utilities: $428,000
Sewerage: $43,000
- Tax - Property: $9,222,570,000
Property: $7,110,264,000
General Sales and Gross Receipts: $714,924,000
General Sales and Gross Receipts: $452,202,000
Documentary and Stock Transfer: $104,872,000
Documentary and Stock Transfer: $83,371,000
Public Utilities Sales: $72,924,000
Public Utilities Sales: $72,776,000
Other License: $47,117,000
Other License: $35,360,000
Occupation and Business License - Other: $33,365,000
Occupation and Business License - Other: $29,850,000
Other Selective Sales: $22,404,000
Other: $19,672,000
Other Selective Sales: $19,343,000
Other: $6,802,000
- Total Salaries and Wages: $190,380,000
: $126,878,000
- Water Utilities - Interest on Debt: $156,000
Interest on Debt: $69,000
Los Angeles County government finances - Debt in 2020:
- Assistance and Subsidies - Public Welfare, Cash Assistance Programs - Other: $2,159,886,000
Public Welfare, Cash Assistance Programs - Other: $1,983,451,000
- Bond Funds - Cash and Securities: $357,525,000
Cash and Securities: $179,733,000
- Charges - Hospital Public: $4,231,246,000
Hospital Public: $3,990,859,000
Other: $3,038,505,000
Other: $1,618,294,000
Natural Resources - Other: $158,353,000
Natural Resources - Other: $129,364,000
Solid Waste Management: $116,674,000
Sewerage: $80,106,000
Solid Waste Management: $58,973,000
Sewerage: $37,494,000
Parks and Recreation: $26,736,000
Regular Highways: $26,327,000
Parks and Recreation: $22,345,000
Elementary and Secondary Education - Other: $21,442,000
Elementary and Secondary Education - Other: $20,366,000
Regular Highways: $13,688,000
Air Transportation: $5,332,000
Air Transportation: $4,863,000
Higher Education - Other: $574,000
Higher Education - Other: $510,000
Elementary and Secondary Education School Lunch: $91,000
- Construction - Natural Resources - Other: $37,986,000
Parks and Recreation: $33,283,000
General - Other: $30,374,000
Parks and Recreation: $27,541,000
General - Other: $25,165,000
Natural Resources - Other: $20,106,000
General Public Buildings: $20,034,000
Police Protection: $19,426,000
Police Protection: $18,782,000
Local Fire Protection: $18,259,000
General Public Buildings: $16,611,000
Local Fire Protection: $15,340,000
Correctional Institutions: $13,670,000
Correctional Institutions: $11,379,000
Judicial and Legal Services: $7,109,000
Hospitals: $6,859,000
Corrections - Other: $6,140,000
Judicial and Legal Services: $5,863,000
Libraries: $5,123,000
Corrections - Other: $5,095,000
Health - Other: $3,916,000
Elementary and Secondary Education: $729,000
Elementary and Secondary Education: $227,000
Libraries: $123,000
- Current Operations - Health - Other: $5,707,981,000
Public Welfare - Other: $4,618,888,000
Public Welfare - Other: $4,081,879,000
Health - Other: $3,986,204,000
Hospitals: $3,792,309,000
Hospitals: $3,319,219,000
Police Protection: $2,049,887,000
Police Protection: $2,000,963,000
Correctional Institutions: $1,312,515,000
Local Fire Protection: $1,162,012,000
Correctional Institutions: $1,159,832,000
Local Fire Protection: $1,147,046,000
Judicial and Legal Services: $1,139,121,000
Judicial and Legal Services: $1,008,402,000
General - Other: $846,524,000
Housing and Community Development: $650,719,000
Corrections - Other: $541,896,000
Corrections - Other: $526,661,000
Parks and Recreation: $525,682,000
General - Other: $465,145,000
Housing and Community Development: $453,503,000
Parks and Recreation: $424,119,000
Regular Highways: $378,522,000
Elementary and Secondary Education: $372,393,000
Financial Administration: $337,462,000
Financial Administration: $325,067,000
Natural Resources - Other: $309,000,000
Central Staff Services: $290,711,000
Regular Highways: $282,738,000
Elementary and Secondary Education: $262,137,000
Central Staff Services: $252,196,000
Natural Resources - Other: $242,364,000
Transit Utilities: $202,473,000
Transit Utilities: $191,941,000
General Public Buildings: $151,957,000
Libraries: $142,014,000
Libraries: $138,465,000
General Public Buildings: $120,736,000
Solid Waste Management: $116,243,000
Water Utilities: $83,734,000
Water Utilities: $67,853,000
Sewerage: $60,986,000
Solid Waste Management: $49,482,000
Sewerage: $34,628,000
Protective Inspection and Regulation - Other: $11,990,000
Protective Inspection and Regulation - Other: $10,057,000
Other Higher Education: $8,622,000
Other Higher Education: $8,174,000
Air Transportation: $7,987,000
Parking Facilities: $6,626,000
Air Transportation: $3,405,000
- Federal Intergovernmental - Other: $1,326,391,000
Other: $715,800,000
Education: $169,325,000
Education: $166,596,000
Transit Utilities: $79,092,000
Transit Utilities: $66,487,000
Highways: $19,847,000
Highways: $13,866,000
Air Transportation: $8,316,000
Air Transportation: $8,194,000
Natural Resources: $7,751,000
Health and Hospitals: $6,641,000
Water Utilities: $2,183,000
General Local Government Support: $1,253,000
General Local Government Support: $1,160,000
Housing and Community Development: $806,000
Housing and Community Development: $759,000
Natural Resources: $738,000
Sewerage: $43,000
- General - Interest on Debt: $360,671,000
Interest on Debt: $323,718,000
- Intergovernmental to Local - Other - Elementary and Secondary Education: $105,727,000
Other - Elementary and Secondary Education: $56,619,000
Other - Natural Resources - Other: $3,583,000
Other - Natural Resources - Other: $2,315,000
Other - Local Fire Protection: $897,000
Other - Water Utilities: $2,000
- Intergovernmental to State - Judicial and Legal Services: $245,882,000
Judicial and Legal Services: $245,882,000
- Local Intergovernmental - Other: $422,105,000
Other: $385,826,000
Transit Utilities: $93,167,000
Transit Utilities: $76,647,000
Education: $61,153,000
Education: $41,976,000
Housing and Community Development: $33,276,000
Health and Hospitals: $23,207,000
Housing and Community Development: $16,477,000
Water Utilities: $1,947,000
Health and Hospitals: $76,000
Sewerage: $41,000
Sewerage: $41,000
Highways: $24,000
Water Utilities: $14,000
Highways: $13,000
- Long Term Debt - Outstanding Unspecified Public Purpose: $5,994,266,000
Beginning Outstanding - Unspecified Public Purpose: $5,757,331,000
Outstanding Unspecified Public Purpose: $5,252,097,000
Beginning Outstanding - Unspecified Public Purpose: $3,065,970,000
Issue, Unspecified Public Purpose: $2,254,792,000
Retired Unspecified Public Purpose: $1,157,057,000
Issue, Unspecified Public Purpose: $963,178,000
Retired Unspecified Public Purpose: $409,996,000
Beginning Outstanding - Public Debt for Private Purpose: $69,060,000
Outstanding Nonguaranteed - Industrial Revenue: $69,060,000
Beginning Outstanding - Public Debt for Private Purpose: $69,060,000
Outstanding Nonguaranteed - Industrial Revenue: $68,140,000
Retired Nonguaranteed - Public Debt for Private Purpose: $920,000
- Miscellaneous - Special Assessments: $400,198,000
General Revenue - Other: $382,258,000
Interest Earnings: $286,937,000
General Revenue - Other: $250,135,000
Rents: $152,892,000
Fines and Forfeits: $146,391,000
Rents: $144,128,000
Fines and Forfeits: $135,560,000
Special Assessments: $129,550,000
Interest Earnings: $114,274,000
Sale of Property: $1,862,000
Sale of Property: $1,800,000
Royalties: $482,000
Royalties: $88,000
Donations From Private Sources: $26,000
- Other Capital Outlay - General - Other: $343,509,000
General - Other: $227,869,000
Regular Highways: $44,332,000
Regular Highways: $41,890,000
Police Protection: $36,903,000
Health - Other: $29,412,000
Parking Facilities: $28,868,000
Parking Facilities: $28,522,000
Elementary and Secondary Education: $25,187,000
Public Welfare - Other: $10,840,000
Police Protection: $10,123,000
Correctional Institutions: $8,578,000
Correctional Institutions: $8,452,000
Air Transportation: $7,915,000
Elementary and Secondary Education: $6,376,000
Parks and Recreation: $6,100,000
Parks and Recreation: $4,481,000
Air Transportation: $4,044,000
Health - Other: $3,923,000
Public Welfare - Other: $3,776,000
Corrections - Other: $3,172,000
Central Staff Services: $2,762,000
Judicial and Legal Services: $2,711,000
Libraries: $2,457,000
Central Staff Services: $1,977,000
General Public Building: $1,826,000
Local Fire Protection: $964,000
Judicial and Legal Services: $893,000
Corrections - Other: $735,000
Natural Resources - Other: $638,000
Natural Resources - Other: $596,000
Financial Administration: $533,000
Libraries: $440,000
Financial Administration: $400,000
Protective Inspection and Regulation - Other: $205,000
- Other Funds - Cash and Securities: $18,981,142,000
Cash and Securities: $15,637,859,000
- Revenue - Water Utilities: $87,097,000
Water Utilities: $82,515,000
Transit Utilities: $4,088,000
Transit Utilities: $3,269,000
- Sinking Funds - Cash and Securities: $244,683,000
Cash and Securities: $146,403,000
- State Intergovernmental - Public Welfare: $5,445,722,000
Public Welfare: $5,182,355,000
Other: $3,490,217,000
Other: $3,139,423,000
Health and Hospitals: $2,058,691,000
Health and Hospitals: $1,663,196,000
Education: $348,164,000
Highways: $318,624,000
Highways: $222,655,000
Education: $207,812,000
General Local Government Support: $48,686,000
General Local Government Support: $44,609,000
Transit Utilities: $20,483,000
Transit Utilities: $19,623,000
Water Utilities: $492,000
Water Utilities: $428,000
Sewerage: $43,000
- Tax - Property: $9,222,570,000
Property: $7,110,264,000
General Sales and Gross Receipts: $714,924,000
General Sales and Gross Receipts: $452,202,000
Documentary and Stock Transfer: $104,872,000
Documentary and Stock Transfer: $83,371,000
Public Utilities Sales: $72,924,000
Public Utilities Sales: $72,776,000
Other License: $47,117,000
Other License: $35,360,000
Occupation and Business License - Other: $33,365,000
Occupation and Business License - Other: $29,850,000
Other Selective Sales: $22,404,000
Other: $19,672,000
Other Selective Sales: $19,343,000
Other: $6,802,000
- Total Salaries and Wages: $190,380,000
: $126,878,000
- Water Utilities - Interest on Debt: $156,000
Interest on Debt: $69,000
Los Angeles County government finances - Cash and Securities in 2020:
- Assistance and Subsidies - Public Welfare, Cash Assistance Programs - Other: $2,159,886,000
Public Welfare, Cash Assistance Programs - Other: $1,983,451,000
- Bond Funds - Cash and Securities: $357,525,000
Cash and Securities: $179,733,000
- Charges - Hospital Public: $4,231,246,000
Hospital Public: $3,990,859,000
Other: $3,038,505,000
Other: $1,618,294,000
Natural Resources - Other: $158,353,000
Natural Resources - Other: $129,364,000
Solid Waste Management: $116,674,000
Sewerage: $80,106,000
Solid Waste Management: $58,973,000
Sewerage: $37,494,000
Parks and Recreation: $26,736,000
Regular Highways: $26,327,000
Parks and Recreation: $22,345,000
Elementary and Secondary Education - Other: $21,442,000
Elementary and Secondary Education - Other: $20,366,000
Regular Highways: $13,688,000
Air Transportation: $5,332,000
Air Transportation: $4,863,000
Higher Education - Other: $574,000
Higher Education - Other: $510,000
Elementary and Secondary Education School Lunch: $91,000
- Construction - Natural Resources - Other: $37,986,000
Parks and Recreation: $33,283,000
General - Other: $30,374,000
Parks and Recreation: $27,541,000
General - Other: $25,165,000
Natural Resources - Other: $20,106,000
General Public Buildings: $20,034,000
Police Protection: $19,426,000
Police Protection: $18,782,000
Local Fire Protection: $18,259,000
General Public Buildings: $16,611,000
Local Fire Protection: $15,340,000
Correctional Institutions: $13,670,000
Correctional Institutions: $11,379,000
Judicial and Legal Services: $7,109,000
Hospitals: $6,859,000
Corrections - Other: $6,140,000
Judicial and Legal Services: $5,863,000
Libraries: $5,123,000
Corrections - Other: $5,095,000
Health - Other: $3,916,000
Elementary and Secondary Education: $729,000
Elementary and Secondary Education: $227,000
Libraries: $123,000
- Current Operations - Health - Other: $5,707,981,000
Public Welfare - Other: $4,618,888,000
Public Welfare - Other: $4,081,879,000
Health - Other: $3,986,204,000
Hospitals: $3,792,309,000
Hospitals: $3,319,219,000
Police Protection: $2,049,887,000
Police Protection: $2,000,963,000
Correctional Institutions: $1,312,515,000
Local Fire Protection: $1,162,012,000
Correctional Institutions: $1,159,832,000
Local Fire Protection: $1,147,046,000
Judicial and Legal Services: $1,139,121,000
Judicial and Legal Services: $1,008,402,000
General - Other: $846,524,000
Housing and Community Development: $650,719,000
Corrections - Other: $541,896,000
Corrections - Other: $526,661,000
Parks and Recreation: $525,682,000
General - Other: $465,145,000
Housing and Community Development: $453,503,000
Parks and Recreation: $424,119,000
Regular Highways: $378,522,000
Elementary and Secondary Education: $372,393,000
Financial Administration: $337,462,000
Financial Administration: $325,067,000
Natural Resources - Other: $309,000,000
Central Staff Services: $290,711,000
Regular Highways: $282,738,000
Elementary and Secondary Education: $262,137,000
Central Staff Services: $252,196,000
Natural Resources - Other: $242,364,000
Transit Utilities: $202,473,000
Transit Utilities: $191,941,000
General Public Buildings: $151,957,000
Libraries: $142,014,000
Libraries: $138,465,000
General Public Buildings: $120,736,000
Solid Waste Management: $116,243,000
Water Utilities: $83,734,000
Water Utilities: $67,853,000
Sewerage: $60,986,000
Solid Waste Management: $49,482,000
Sewerage: $34,628,000
Protective Inspection and Regulation - Other: $11,990,000
Protective Inspection and Regulation - Other: $10,057,000
Other Higher Education: $8,622,000
Other Higher Education: $8,174,000
Air Transportation: $7,987,000
Parking Facilities: $6,626,000
Air Transportation: $3,405,000
- Federal Intergovernmental - Other: $1,326,391,000
Other: $715,800,000
Education: $169,325,000
Education: $166,596,000
Transit Utilities: $79,092,000
Transit Utilities: $66,487,000
Highways: $19,847,000
Highways: $13,866,000
Air Transportation: $8,316,000
Air Transportation: $8,194,000
Natural Resources: $7,751,000
Health and Hospitals: $6,641,000
Water Utilities: $2,183,000
General Local Government Support: $1,253,000
General Local Government Support: $1,160,000
Housing and Community Development: $806,000
Housing and Community Development: $759,000
Natural Resources: $738,000
Sewerage: $43,000
- General - Interest on Debt: $360,671,000
Interest on Debt: $323,718,000
- Intergovernmental to Local - Other - Elementary and Secondary Education: $105,727,000
Other - Elementary and Secondary Education: $56,619,000
Other - Natural Resources - Other: $3,583,000
Other - Natural Resources - Other: $2,315,000
Other - Local Fire Protection: $897,000
Other - Water Utilities: $2,000
- Intergovernmental to State - Judicial and Legal Services: $245,882,000
Judicial and Legal Services: $245,882,000
- Local Intergovernmental - Other: $422,105,000
Other: $385,826,000
Transit Utilities: $93,167,000
Transit Utilities: $76,647,000
Education: $61,153,000
Education: $41,976,000
Housing and Community Development: $33,276,000
Health and Hospitals: $23,207,000
Housing and Community Development: $16,477,000
Water Utilities: $1,947,000
Health and Hospitals: $76,000
Sewerage: $41,000
Sewerage: $41,000
Highways: $24,000
Water Utilities: $14,000
Highways: $13,000
- Long Term Debt - Outstanding Unspecified Public Purpose: $5,994,266,000
Beginning Outstanding - Unspecified Public Purpose: $5,757,331,000
Outstanding Unspecified Public Purpose: $5,252,097,000
Beginning Outstanding - Unspecified Public Purpose: $3,065,970,000
Issue, Unspecified Public Purpose: $2,254,792,000
Retired Unspecified Public Purpose: $1,157,057,000
Issue, Unspecified Public Purpose: $963,178,000
Retired Unspecified Public Purpose: $409,996,000
Beginning Outstanding - Public Debt for Private Purpose: $69,060,000
Outstanding Nonguaranteed - Industrial Revenue: $69,060,000
Beginning Outstanding - Public Debt for Private Purpose: $69,060,000
Outstanding Nonguaranteed - Industrial Revenue: $68,140,000
Retired Nonguaranteed - Public Debt for Private Purpose: $920,000
- Miscellaneous - Special Assessments: $400,198,000
General Revenue - Other: $382,258,000
Interest Earnings: $286,937,000
General Revenue - Other: $250,135,000
Rents: $152,892,000
Fines and Forfeits: $146,391,000
Rents: $144,128,000
Fines and Forfeits: $135,560,000
Special Assessments: $129,550,000
Interest Earnings: $114,274,000
Sale of Property: $1,862,000
Sale of Property: $1,800,000
Royalties: $482,000
Royalties: $88,000
Donations From Private Sources: $26,000
- Other Capital Outlay - General - Other: $343,509,000
General - Other: $227,869,000
Regular Highways: $44,332,000
Regular Highways: $41,890,000
Police Protection: $36,903,000
Health - Other: $29,412,000
Parking Facilities: $28,868,000
Parking Facilities: $28,522,000
Elementary and Secondary Education: $25,187,000
Public Welfare - Other: $10,840,000
Police Protection: $10,123,000
Correctional Institutions: $8,578,000
Correctional Institutions: $8,452,000
Air Transportation: $7,915,000
Elementary and Secondary Education: $6,376,000
Parks and Recreation: $6,100,000
Parks and Recreation: $4,481,000
Air Transportation: $4,044,000
Health - Other: $3,923,000
Public Welfare - Other: $3,776,000
Corrections - Other: $3,172,000
Central Staff Services: $2,762,000
Judicial and Legal Services: $2,711,000
Libraries: $2,457,000
Central Staff Services: $1,977,000
General Public Building: $1,826,000
Local Fire Protection: $964,000
Judicial and Legal Services: $893,000
Corrections - Other: $735,000
Natural Resources - Other: $638,000
Natural Resources - Other: $596,000
Financial Administration: $533,000
Libraries: $440,000
Financial Administration: $400,000
Protective Inspection and Regulation - Other: $205,000
- Other Funds - Cash and Securities: $18,981,142,000
Cash and Securities: $15,637,859,000
- Revenue - Water Utilities: $87,097,000
Water Utilities: $82,515,000
Transit Utilities: $4,088,000
Transit Utilities: $3,269,000
- Sinking Funds - Cash and Securities: $244,683,000
Cash and Securities: $146,403,000
- State Intergovernmental - Public Welfare: $5,445,722,000
Public Welfare: $5,182,355,000
Other: $3,490,217,000
Other: $3,139,423,000
Health and Hospitals: $2,058,691,000
Health and Hospitals: $1,663,196,000
Education: $348,164,000
Highways: $318,624,000
Highways: $222,655,000
Education: $207,812,000
General Local Government Support: $48,686,000
General Local Government Support: $44,609,000
Transit Utilities: $20,483,000
Transit Utilities: $19,623,000
Water Utilities: $492,000
Water Utilities: $428,000
Sewerage: $43,000
- Tax - Property: $9,222,570,000
Property: $7,110,264,000
General Sales and Gross Receipts: $714,924,000
General Sales and Gross Receipts: $452,202,000
Documentary and Stock Transfer: $104,872,000
Documentary and Stock Transfer: $83,371,000
Public Utilities Sales: $72,924,000
Public Utilities Sales: $72,776,000
Other License: $47,117,000
Other License: $35,360,000
Occupation and Business License - Other: $33,365,000
Occupation and Business License - Other: $29,850,000
Other Selective Sales: $22,404,000
Other: $19,672,000
Other Selective Sales: $19,343,000
Other: $6,802,000
- Total Salaries and Wages: $190,380,000
: $126,878,000
- Water Utilities - Interest on Debt: $156,000
Interest on Debt: $69,000
Supplemental Security Income (SSI) in 2006:
- Total number of recipients: 402,699
- Number of aged recipients: 141,771
- Number of blind and disabled recipients: 260,928
- Number of recipients under 18: 32,631
- Number of recipients between 18 and 64: 164,721
- Number of recipients older than 64: 205,347
- Number of recipients also receiving OASDI: 142,661
- Amount of payments (thousands of dollars): 247,897
| Home Mortgage Disclosure Act Aggregated Statistics For Year 2009 (Based on 2040 full tracts) | ||||||||||||||
| A) FHA, FSA/RHS & VA Home Purchase Loans | B) Conventional Home Purchase Loans | C) Refinancings | D) Home Improvement Loans | E) Loans on Dwellings For 5+ Families | F) Non-occupant Loans on < 5 Family Dwellings (A B C & D) | G) Loans On Manufactured Home Dwelling (A B C & D) | ||||||||
|---|---|---|---|---|---|---|---|---|---|---|---|---|---|---|
| Number | Average Value | Number | Average Value | Number | Average Value | Number | Average Value | Number | Average Value | Number | Average Value | Number | Average Value | |
| LOANS ORIGINATED | 24,296 | $281,608 | 35,879 | $375,805 | 123,285 | $346,977 | 6,326 | $255,378 | 1,281 | $2,131,729 | 11,867 | $292,816 | 374 | $129,890 |
| APPLICATIONS APPROVED, NOT ACCEPTED | 2,615 | $283,320 | 5,486 | $382,515 | 15,649 | $358,630 | 1,045 | $163,294 | 81 | $4,906,556 | 1,716 | $299,792 | 273 | $85,187 |
| APPLICATIONS DENIED | 6,328 | $289,429 | 9,849 | $363,382 | 50,375 | $371,926 | 4,050 | $160,565 | 451 | $1,317,293 | 6,195 | $285,711 | 683 | $93,236 |
| APPLICATIONS WITHDRAWN | 4,436 | $283,135 | 7,651 | $378,384 | 28,190 | $355,024 | 1,937 | $222,787 | 191 | $2,344,545 | 3,072 | $285,913 | 114 | $181,342 |
| FILES CLOSED FOR INCOMPLETENESS | 1,364 | $272,527 | 1,848 | $356,547 | 8,739 | $370,237 | 541 | $215,144 | 56 | $2,182,125 | 839 | $290,045 | 40 | $90,500 |
| Private Mortgage Insurance Companies Aggregated Statistics For Year 2009 (Based on 1614 full tracts) | ||||||||
| A) Conventional Home Purchase Loans | B) Refinancings | C) Non-occupant Loans on < 5 Family Dwellings (A & B) | D) Loans On Manufactured Home Dwelling (A & B) | |||||
|---|---|---|---|---|---|---|---|---|
| Number | Average Value | Number | Average Value | Number | Average Value | Number | Average Value | |
| LOANS ORIGINATED | 3,901 | $300,927 | 649 | $350,357 | 14 | $214,000 | 0 | $0 |
| APPLICATIONS APPROVED, NOT ACCEPTED | 2,176 | $312,815 | 546 | $377,522 | 25 | $308,240 | 0 | $0 |
| APPLICATIONS DENIED | 878 | $314,182 | 385 | $377,816 | 18 | $175,056 | 0 | $0 |
| APPLICATIONS WITHDRAWN | 366 | $322,025 | 114 | $345,570 | 5 | $204,400 | 2 | $100,000 |
| FILES CLOSED FOR INCOMPLETENESS | 275 | $333,651 | 39 | $348,795 | 10 | $258,900 | 1 | $320,000 |
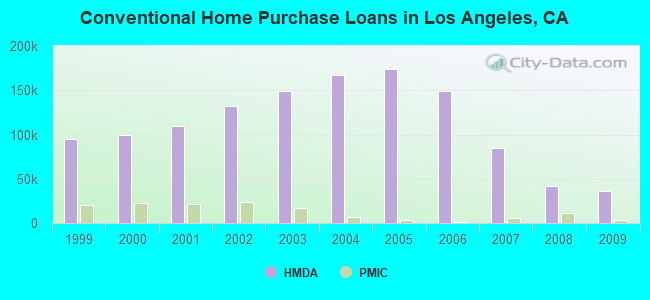
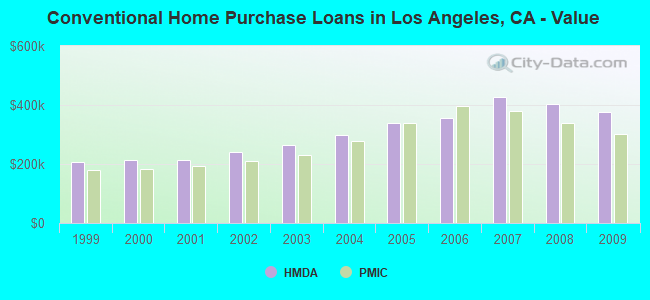
| Most common first names in Los Angeles County, CA among deceased individuals | ||
| Name | Count | Lived (average) |
|---|---|---|
| John | 32,387 | 73.6 years |
| Mary | 29,973 | 79.4 years |
| William | 27,287 | 74.2 years |
| Robert | 23,180 | 70.1 years |
| James | 21,926 | 71.1 years |
| George | 17,829 | 75.3 years |
| Charles | 17,630 | 74.0 years |
| Joseph | 14,790 | 74.7 years |
| Helen | 14,501 | 79.7 years |
| Frank | 13,062 | 75.3 years |
| Most common last names in Los Angeles County, CA among deceased individuals | ||
| Last name | Count | Lived (average) |
|---|---|---|
| Smith | 12,995 | 75.1 years |
| Johnson | 11,029 | 74.4 years |
| Williams | 8,744 | 72.7 years |
| Brown | 8,161 | 74.2 years |
| Jones | 7,661 | 73.8 years |
| Miller | 6,386 | 76.4 years |
| Davis | 5,860 | 74.0 years |
| Garcia | 5,334 | 71.6 years |
| Anderson | 5,148 | 75.8 years |
| Wilson | 4,668 | 74.8 years |
| Businesses in Los Angeles County, CA | ||||
| Name | Count | Name | Count | |
|---|---|---|---|---|
| 24 Hour Fitness | 46 | JoS. A. Bank | 5 | |
| 7-Eleven | 311 | Johnny Rockets | 22 | |
| 99 Cents Only Stores | 90 | Jones New York | 202 | |
| ALDO | 25 | Journeys | 13 | |
| AMF Bowling | 10 | Just Tires | 24 | |
| AT&T | 82 | Justice | 16 | |
| Abercrombie & Fitch | 12 | KFC | 149 | |
| Abercrombie Kids | 7 | Kincaid | 13 | |
| Ace Hardware | 28 | Kmart | 16 | |
| Aeropostale | 16 | Knights Inn | 2 | |
| Aerosoles | 5 | Kohl's | 19 | |
| Albertsons | 58 | Kroger | 184 | |
| American Eagle Outfitters | 20 | LA Fitness | 55 | |
| Ann Taylor | 18 | La Quinta | 3 | |
| Apple Store | 11 | La-Z-Boy | 11 | |
| Applebee's | 12 | Lane Bryant | 18 | |
| Arby's | 23 | Lane Furniture | 41 | |
| Ashley Furniture | 3 | LensCrafters | 28 | |
| Audi | 10 | Levi Strauss & Co. | 7 | |
| AutoZone | 136 | Little Caesars Pizza | 111 | |
| Avenue | 21 | Loews | 1 | |
| BMW | 13 | Long John Silver's | 6 | |
| Baja Fresh Mexican Grill | 44 | Lowe's | 20 | |
| Bakers | 17 | Macy's | 32 | |
| Bally Total Fitness | 27 | Marriott | 44 | |
| Banana Republic | 21 | Marshalls | 32 | |
| Barnes & Noble | 16 | MasterBrand Cabinets | 305 | |
| Baskin-Robbins | 141 | Mazda | 11 | |
| Bath & Body Works | 32 | McDonald's | 350 | |
| Bebe | 12 | Men's Wearhouse | 18 | |
| Bed Bath & Beyond | 25 | Motel 6 | 23 | |
| Ben & Jerry's | 13 | Motherhood Maternity | 47 | |
| Bentleymotors.Com | 2 | New Balance | 82 | |
| Best Western | 37 | New York & Co | 11 | |
| Big O Tires | 14 | Nike | 578 | |
| Blockbuster | 83 | Nissan | 18 | |
| Brooks Brothers | 2 | Nordstrom | 16 | |
| Brookstone | 11 | Office Depot | 41 | |
| Brunswick Bowling & Billiards | 5 | OfficeMax | 13 | |
| Budget Car Rental | 19 | Old Navy | 20 | |
| Buffalo Wild Wings | 5 | Olive Garden | 12 | |
| Burger King | 125 | On The Border | 1 | |
| Buybuy BABY | 1 | Outback | 11 | |
| CVS | 221 | Outback Steakhouse | 11 | |
| Cache | 9 | Pac Sun | 18 | |
| CarMax | 3 | Panda Express | 141 | |
| Carl\s Jr. | 169 | Panera Bread | 24 | |
| Casual Male XL | 14 | Papa John's Pizza | 41 | |
| Catherines | 7 | Payless | 130 | |
| Charlotte Russe | 15 | Penske | 47 | |
| Chevrolet | 18 | PetSmart | 21 | |
| Chick-Fil-A | 8 | Pier 1 Imports | 19 | |
| Chico's | 14 | Pizza Hut | 140 | |
| Chipotle | 40 | Popeyes | 47 | |
| Chuck E. Cheese's | 24 | Pottery Barn | 7 | |
| Church's Chicken | 35 | Pottery Barn Kids | 3 | |
| Cinnabon | 20 | Qdoba Mexican Grill | 6 | |
| Circle K | 44 | Quality | 7 | |
| Clarion | 1 | Quiznos | 113 | |
| Clarks | 5 | RadioShack | 153 | |
| Cold Stone Creamery | 54 | Ramada | 15 | |
| Coldwater Creek | 3 | Red Lobster | 7 | |
| Comfort Inn | 18 | Red Robin | 11 | |
| Comfort Suites | 3 | Red Roof Inn | 2 | |
| Costco | 23 | Rite Aid | 149 | |
| Crate & Barrel | 5 | Rodeway Inn | 8 | |
| Curves | 75 | Rue21 | 1 | |
| DHL | 148 | Ryder Rental & Truck Leasing | 9 | |
| Dairy Queen | 15 | SAS Shoes | 41 | |
| Days Inn | 15 | SONIC Drive-In | 2 | |
| Deb | 1 | Safeway | 89 | |
| Decora Cabinetry | 61 | Saks Fifth Avenue | 2 | |
| Dennys | 103 | Sam's Club | 11 | |
| Discount Tire | 17 | Sears | 66 | |
| Domino's Pizza | 96 | Sephora | 21 | |
| DressBarn | 5 | Sheraton | 8 | |
| Dressbarn | 5 | Skechers USA | 27 | |
| Econo Lodge | 5 | Soma Intimates | 4 | |
| Eddie Bauer | 1 | Spencer Gifts | 9 | |
| El Pollo Loco | 160 | Sprint Nextel | 87 | |
| Ethan Allen | 5 | Staples | 55 | |
| Express | 20 | Starbucks | 496 | |
| Extended Stay America | 13 | Studio 6 | 1 | |
| Famous Footwear | 14 | Subaru | 9 | |
| Fashion Bug | 4 | Subway | 408 | |
| FedEx | 1,082 | Super 8 | 15 | |
| Finish Line | 11 | T-Mobile | 343 | |
| Firestone Complete Auto Care | 37 | T.G.I. Driday's | 10 | |
| Foot Locker | 33 | T.J.Maxx | 22 | |
| Ford | 16 | Taco Bell | 165 | |
| Forever 21 | 29 | Talbots | 6 | |
| Fredericks Of Hollywood | 11 | Target | 58 | |
| GNC | 164 | The Cheesecake Factory | 10 | |
| GameStop | 124 | The Limited | 3 | |
| Gap | 30 | The Room Place | 30 | |
| Goodwill | 16 | Torrid | 11 | |
| Gymboree | 18 | Toyota | 30 | |
| H&M | 12 | Toys"R"Us | 54 | |
| H&R Block | 239 | Trader Joe's | 44 | |
| Haagen-Dazs | 4 | Travelodge | 10 | |
| Haworth | 7 | True Value | 43 | |
| Hilton | 31 | U-Haul | 193 | |
| Holiday Inn | 37 | UPS | 944 | |
| Hollister Co. | 16 | Urban Outfitters | 10 | |
| Home Depot | 48 | Vans | 159 | |
| HomeTown Buffet | 21 | Verizon Wireless | 73 | |
| Homestead Studio Suites | 4 | Victoria's Secret | 30 | |
| Honda | 28 | Volkswagen | 15 | |
| Hot Topic | 18 | Vons | 94 | |
| Howard Johnson | 4 | Walgreens | 104 | |
| Hyatt | 4 | Walmart | 27 | |
| IHOP | 60 | Wendy's | 42 | |
| IKEA | 3 | Westin | 4 | |
| IZOD | 1 | Wet Seal | 9 | |
| J. Jill | 7 | Whole Foods Market | 23 | |
| J.Crew | 10 | Wingate | 1 | |
| JCPenney | 17 | World Gym | 2 | |
| Jack In The Box | 114 | YMCA | 48 | |
| Jamba Juice | 75 | Z Gallerie | 4 | |
Los Angeles County on our top lists:
- #1 on the list of "Top 101 counties with the most Evangelical Protestant congregations"
- #1 on the list of "Top 101 counties with the most Evangelical Protestant congregations (pop. 50,000+)"
- #1 on the list of "Top 101 counties with the most Mainline Protestant congregations"
- #1 on the list of "Top 101 counties with the most Mainline Protestant congregations (pop. 50,000+)"
- #1 on the list of "Top 101 counties with the most Orthodox adherents"
- #1 on the list of "Top 101 counties with the highest ground withdrawal of fresh water for public supply (pop. 50,000+)"
- #1 on the list of "Top 101 counties with the most Catholic adherents (pop. 50,000+)"
- #1 on the list of "Top 101 counties with the highest total withdrawal of fresh water for public supply"
- #1 on the list of "Top 101 counties with the highest total withdrawal of fresh water for public supply (pop. 50,000+)"
- #1 on the list of "Top 101 counties with the most Orthodox congregations"
- #1 on the list of "Top 101 counties with the most Orthodox congregations (pop. 50,000+)"
- #1 on the list of "Top 101 counties with the highest ground withdrawal of fresh water for public supply"
- #1 on the list of "Top 101 counties with the most Orthodox adherents (pop. 50,000+)"
- #1 on the list of "Top 101 counties with the most Catholic adherents"
- #2 on the list of "Top 101 counties with the highest surface withdrawal of fresh water for public supply"
- #2 on the list of "Top 101 counties with the highest surface withdrawal of fresh water for public supply (pop. 50,000+)"
- #2 on the list of "Top 101 counties with the highest Particulate Matter (PM2.5) Annual air pollution readings in 2012 (µg/m3)"
- #2 on the list of "Top 101 counties with the most Catholic congregations (pop. 50,000+)"
- #2 on the list of "Top 101 counties with the most Catholic congregations"
- #2 on the list of "Top 101 counties with the most Mainline Protestant adherents (pop. 50,000+)"