Ontario, California Submit your own pictures of this city and show them to the world
OSM Map
General Map
Google Map
MSN Map
OSM Map
General Map
Google Map
MSN Map
OSM Map
General Map
Google Map
MSN Map
OSM Map
General Map
Google Map
MSN Map
Please wait while loading the map...
Population in 2022: 179,061 (99% urban, 1% rural). Population change since 2000: +13.3%Males: 87,095 Females: 91,966
March 2022 cost of living index in Ontario: 83.8 (less than average, U.S. average is 100) Percentage of residents living in poverty in 2022: 12.6%for White Non-Hispanic residents , 18.2% for Black residents , 12.9% for Hispanic or Latino residents , 6.8% for American Indian residents , 4.7% for Native Hawaiian and other Pacific Islander residents , 15.2% for other race residents , 10.6% for two or more races residents )
Profiles of local businesses
Business Search - 14 Million verified businesses
Data:
Median household income ($)
Median household income (% change since 2000)
Household income diversity
Ratio of average income to average house value (%)
Ratio of average income to average rent
Median household income ($) - White
Median household income ($) - Black or African American
Median household income ($) - Asian
Median household income ($) - Hispanic or Latino
Median household income ($) - American Indian and Alaska Native
Median household income ($) - Multirace
Median household income ($) - Other Race
Median household income for houses/condos with a mortgage ($)
Median household income for apartments without a mortgage ($)
Races - White alone (%)
Races - White alone (% change since 2000)
Races - Black alone (%)
Races - Black alone (% change since 2000)
Races - American Indian alone (%)
Races - American Indian alone (% change since 2000)
Races - Asian alone (%)
Races - Asian alone (% change since 2000)
Races - Hispanic (%)
Races - Hispanic (% change since 2000)
Races - Native Hawaiian and Other Pacific Islander alone (%)
Races - Native Hawaiian and Other Pacific Islander alone (% change since 2000)
Races - Two or more races (%)
Races - Two or more races (% change since 2000)
Races - Other race alone (%)
Races - Other race alone (% change since 2000)
Racial diversity
Unemployment (%)
Unemployment (% change since 2000)
Unemployment (%) - White
Unemployment (%) - Black or African American
Unemployment (%) - Asian
Unemployment (%) - Hispanic or Latino
Unemployment (%) - American Indian and Alaska Native
Unemployment (%) - Multirace
Unemployment (%) - Other Race
Population density (people per square mile)
Population - Males (%)
Population - Females (%)
Population - Males (%) - White
Population - Males (%) - Black or African American
Population - Males (%) - Asian
Population - Males (%) - Hispanic or Latino
Population - Males (%) - American Indian and Alaska Native
Population - Males (%) - Multirace
Population - Males (%) - Other Race
Population - Females (%) - White
Population - Females (%) - Black or African American
Population - Females (%) - Asian
Population - Females (%) - Hispanic or Latino
Population - Females (%) - American Indian and Alaska Native
Population - Females (%) - Multirace
Population - Females (%) - Other Race
Coronavirus confirmed cases (Apr 27, 2024)
Deaths caused by coronavirus (Apr 27, 2024)
Coronavirus confirmed cases (per 100k population) (Apr 27, 2024)
Deaths caused by coronavirus (per 100k population) (Apr 27, 2024)
Daily increase in number of cases (Apr 27, 2024)
Weekly increase in number of cases (Apr 27, 2024)
Cases doubled (in days) (Apr 27, 2024)
Hospitalized patients (Apr 18, 2022)
Negative test results (Apr 18, 2022)
Total test results (Apr 18, 2022)
COVID Vaccine doses distributed (per 100k population) (Sep 19, 2023)
COVID Vaccine doses administered (per 100k population) (Sep 19, 2023)
COVID Vaccine doses distributed (Sep 19, 2023)
COVID Vaccine doses administered (Sep 19, 2023)
Likely homosexual households (%)
Likely homosexual households (% change since 2000)
Likely homosexual households - Lesbian couples (%)
Likely homosexual households - Lesbian couples (% change since 2000)
Likely homosexual households - Gay men (%)
Likely homosexual households - Gay men (% change since 2000)
Cost of living index
Median gross rent ($)
Median contract rent ($)
Median monthly housing costs ($)
Median house or condo value ($)
Median house or condo value ($ change since 2000)
Mean house or condo value by units in structure - 1, detached ($)
Mean house or condo value by units in structure - 1, attached ($)
Mean house or condo value by units in structure - 2 ($)
Mean house or condo value by units in structure by units in structure - 3 or 4 ($)
Mean house or condo value by units in structure - 5 or more ($)
Mean house or condo value by units in structure - Boat, RV, van, etc. ($)
Mean house or condo value by units in structure - Mobile home ($)
Median house or condo value ($) - White
Median house or condo value ($) - Black or African American
Median house or condo value ($) - Asian
Median house or condo value ($) - Hispanic or Latino
Median house or condo value ($) - American Indian and Alaska Native
Median house or condo value ($) - Multirace
Median house or condo value ($) - Other Race
Median resident age
Resident age diversity
Median resident age - Males
Median resident age - Females
Median resident age - White
Median resident age - Black or African American
Median resident age - Asian
Median resident age - Hispanic or Latino
Median resident age - American Indian and Alaska Native
Median resident age - Multirace
Median resident age - Other Race
Median resident age - Males - White
Median resident age - Males - Black or African American
Median resident age - Males - Asian
Median resident age - Males - Hispanic or Latino
Median resident age - Males - American Indian and Alaska Native
Median resident age - Males - Multirace
Median resident age - Males - Other Race
Median resident age - Females - White
Median resident age - Females - Black or African American
Median resident age - Females - Asian
Median resident age - Females - Hispanic or Latino
Median resident age - Females - American Indian and Alaska Native
Median resident age - Females - Multirace
Median resident age - Females - Other Race
Commute - mean travel time to work (minutes)
Travel time to work - Less than 5 minutes (%)
Travel time to work - Less than 5 minutes (% change since 2000)
Travel time to work - 5 to 9 minutes (%)
Travel time to work - 5 to 9 minutes (% change since 2000)
Travel time to work - 10 to 19 minutes (%)
Travel time to work - 10 to 19 minutes (% change since 2000)
Travel time to work - 20 to 29 minutes (%)
Travel time to work - 20 to 29 minutes (% change since 2000)
Travel time to work - 30 to 39 minutes (%)
Travel time to work - 30 to 39 minutes (% change since 2000)
Travel time to work - 40 to 59 minutes (%)
Travel time to work - 40 to 59 minutes (% change since 2000)
Travel time to work - 60 to 89 minutes (%)
Travel time to work - 60 to 89 minutes (% change since 2000)
Travel time to work - 90 or more minutes (%)
Travel time to work - 90 or more minutes (% change since 2000)
Marital status - Never married (%)
Marital status - Now married (%)
Marital status - Separated (%)
Marital status - Widowed (%)
Marital status - Divorced (%)
Median family income ($)
Median family income (% change since 2000)
Median non-family income ($)
Median non-family income (% change since 2000)
Median per capita income ($)
Median per capita income (% change since 2000)
Median family income ($) - White
Median family income ($) - Black or African American
Median family income ($) - Asian
Median family income ($) - Hispanic or Latino
Median family income ($) - American Indian and Alaska Native
Median family income ($) - Multirace
Median family income ($) - Other Race
Median year house/condo built
Median year apartment built
Year house built - Built 2005 or later (%)
Year house built - Built 2000 to 2004 (%)
Year house built - Built 1990 to 1999 (%)
Year house built - Built 1980 to 1989 (%)
Year house built - Built 1970 to 1979 (%)
Year house built - Built 1960 to 1969 (%)
Year house built - Built 1950 to 1959 (%)
Year house built - Built 1940 to 1949 (%)
Year house built - Built 1939 or earlier (%)
Average household size
Household density (households per square mile)
Average household size - White
Average household size - Black or African American
Average household size - Asian
Average household size - Hispanic or Latino
Average household size - American Indian and Alaska Native
Average household size - Multirace
Average household size - Other Race
Occupied housing units (%)
Vacant housing units (%)
Owner occupied housing units (%)
Renter occupied housing units (%)
Vacancy status - For rent (%)
Vacancy status - For sale only (%)
Vacancy status - Rented or sold, not occupied (%)
Vacancy status - For seasonal, recreational, or occasional use (%)
Vacancy status - For migrant workers (%)
Vacancy status - Other vacant (%)
Residents with income below the poverty level (%)
Residents with income below 50% of the poverty level (%)
Children below poverty level (%)
Poor families by family type - Married-couple family (%)
Poor families by family type - Male, no wife present (%)
Poor families by family type - Female, no husband present (%)
Poverty status for native-born residents (%)
Poverty status for foreign-born residents (%)
Poverty among high school graduates not in families (%)
Poverty among people who did not graduate high school not in families (%)
Residents with income below the poverty level (%) - White
Residents with income below the poverty level (%) - Black or African American
Residents with income below the poverty level (%) - Asian
Residents with income below the poverty level (%) - Hispanic or Latino
Residents with income below the poverty level (%) - American Indian and Alaska Native
Residents with income below the poverty level (%) - Multirace
Residents with income below the poverty level (%) - Other Race
Air pollution - Air Quality Index (AQI)
Air pollution - CO
Air pollution - NO2
Air pollution - SO2
Air pollution - Ozone
Air pollution - PM10
Air pollution - PM25
Air pollution - Pb
Crime - Murders per 100,000 population
Crime - Rapes per 100,000 population
Crime - Robberies per 100,000 population
Crime - Assaults per 100,000 population
Crime - Burglaries per 100,000 population
Crime - Thefts per 100,000 population
Crime - Auto thefts per 100,000 population
Crime - Arson per 100,000 population
Crime - City-data.com crime index
Crime - Violent crime index
Crime - Property crime index
Crime - Murders per 100,000 population (5 year average)
Crime - Rapes per 100,000 population (5 year average)
Crime - Robberies per 100,000 population (5 year average)
Crime - Assaults per 100,000 population (5 year average)
Crime - Burglaries per 100,000 population (5 year average)
Crime - Thefts per 100,000 population (5 year average)
Crime - Auto thefts per 100,000 population (5 year average)
Crime - Arson per 100,000 population (5 year average)
Crime - City-data.com crime index (5 year average)
Crime - Violent crime index (5 year average)
Crime - Property crime index (5 year average)
1996 Presidential Elections Results (%) - Democratic Party (Clinton)
1996 Presidential Elections Results (%) - Republican Party (Dole)
1996 Presidential Elections Results (%) - Other
2000 Presidential Elections Results (%) - Democratic Party (Gore)
2000 Presidential Elections Results (%) - Republican Party (Bush)
2000 Presidential Elections Results (%) - Other
2004 Presidential Elections Results (%) - Democratic Party (Kerry)
2004 Presidential Elections Results (%) - Republican Party (Bush)
2004 Presidential Elections Results (%) - Other
2008 Presidential Elections Results (%) - Democratic Party (Obama)
2008 Presidential Elections Results (%) - Republican Party (McCain)
2008 Presidential Elections Results (%) - Other
2012 Presidential Elections Results (%) - Democratic Party (Obama)
2012 Presidential Elections Results (%) - Republican Party (Romney)
2012 Presidential Elections Results (%) - Other
2016 Presidential Elections Results (%) - Democratic Party (Clinton)
2016 Presidential Elections Results (%) - Republican Party (Trump)
2016 Presidential Elections Results (%) - Other
2020 Presidential Elections Results (%) - Democratic Party (Biden)
2020 Presidential Elections Results (%) - Republican Party (Trump)
2020 Presidential Elections Results (%) - Other
Ancestries Reported - Arab (%)
Ancestries Reported - Czech (%)
Ancestries Reported - Danish (%)
Ancestries Reported - Dutch (%)
Ancestries Reported - English (%)
Ancestries Reported - French (%)
Ancestries Reported - French Canadian (%)
Ancestries Reported - German (%)
Ancestries Reported - Greek (%)
Ancestries Reported - Hungarian (%)
Ancestries Reported - Irish (%)
Ancestries Reported - Italian (%)
Ancestries Reported - Lithuanian (%)
Ancestries Reported - Norwegian (%)
Ancestries Reported - Polish (%)
Ancestries Reported - Portuguese (%)
Ancestries Reported - Russian (%)
Ancestries Reported - Scotch-Irish (%)
Ancestries Reported - Scottish (%)
Ancestries Reported - Slovak (%)
Ancestries Reported - Subsaharan African (%)
Ancestries Reported - Swedish (%)
Ancestries Reported - Swiss (%)
Ancestries Reported - Ukrainian (%)
Ancestries Reported - United States (%)
Ancestries Reported - Welsh (%)
Ancestries Reported - West Indian (%)
Ancestries Reported - Other (%)
Educational Attainment - No schooling completed (%)
Educational Attainment - Less than high school (%)
Educational Attainment - High school or equivalent (%)
Educational Attainment - Less than 1 year of college (%)
Educational Attainment - 1 or more years of college (%)
Educational Attainment - Associate degree (%)
Educational Attainment - Bachelor's degree (%)
Educational Attainment - Master's degree (%)
Educational Attainment - Professional school degree (%)
Educational Attainment - Doctorate degree (%)
School Enrollment - Nursery, preschool (%)
School Enrollment - Kindergarten (%)
School Enrollment - Grade 1 to 4 (%)
School Enrollment - Grade 5 to 8 (%)
School Enrollment - Grade 9 to 12 (%)
School Enrollment - College undergrad (%)
School Enrollment - Graduate or professional (%)
School Enrollment - Not enrolled in school (%)
School enrollment - Public schools (%)
School enrollment - Private schools (%)
School enrollment - Not enrolled (%)
Median number of rooms in houses and condos
Median number of rooms in apartments
Housing units lacking complete plumbing facilities (%)
Housing units lacking complete kitchen facilities (%)
Density of houses
Urban houses (%)
Rural houses (%)
Households with people 60 years and over (%)
Households with people 65 years and over (%)
Households with people 75 years and over (%)
Households with one or more nonrelatives (%)
Households with no nonrelatives (%)
Population in households (%)
Family households (%)
Nonfamily households (%)
Population in families (%)
Family households with own children (%)
Median number of bedrooms in owner occupied houses
Mean number of bedrooms in owner occupied houses
Median number of bedrooms in renter occupied houses
Mean number of bedrooms in renter occupied houses
Median number of vehichles in owner occupied houses
Mean number of vehichles in owner occupied houses
Median number of vehichles in renter occupied houses
Mean number of vehichles in renter occupied houses
Mortgage status - with mortgage (%)
Mortgage status - with second mortgage (%)
Mortgage status - with home equity loan (%)
Mortgage status - with both second mortgage and home equity loan (%)
Mortgage status - without a mortgage (%)
Average family size
Average family size - White
Average family size - Black or African American
Average family size - Asian
Average family size - Hispanic or Latino
Average family size - American Indian and Alaska Native
Average family size - Multirace
Average family size - Other Race
Geographical mobility - Same house 1 year ago (%)
Geographical mobility - Moved within same county (%)
Geographical mobility - Moved from different county within same state (%)
Geographical mobility - Moved from different state (%)
Geographical mobility - Moved from abroad (%)
Place of birth - Born in state of residence (%)
Place of birth - Born in other state (%)
Place of birth - Native, outside of US (%)
Place of birth - Foreign born (%)
Housing units in structures - 1, detached (%)
Housing units in structures - 1, attached (%)
Housing units in structures - 2 (%)
Housing units in structures - 3 or 4 (%)
Housing units in structures - 5 to 9 (%)
Housing units in structures - 10 to 19 (%)
Housing units in structures - 20 to 49 (%)
Housing units in structures - 50 or more (%)
Housing units in structures - Mobile home (%)
Housing units in structures - Boat, RV, van, etc. (%)
House/condo owner moved in on average (years ago)
Renter moved in on average (years ago)
Year householder moved into unit - Moved in 1999 to March 2000 (%)
Year householder moved into unit - Moved in 1995 to 1998 (%)
Year householder moved into unit - Moved in 1990 to 1994 (%)
Year householder moved into unit - Moved in 1980 to 1989 (%)
Year householder moved into unit - Moved in 1970 to 1979 (%)
Year householder moved into unit - Moved in 1969 or earlier (%)
Means of transportation to work - Drove car alone (%)
Means of transportation to work - Carpooled (%)
Means of transportation to work - Public transportation (%)
Means of transportation to work - Bus or trolley bus (%)
Means of transportation to work - Streetcar or trolley car (%)
Means of transportation to work - Subway or elevated (%)
Means of transportation to work - Railroad (%)
Means of transportation to work - Ferryboat (%)
Means of transportation to work - Taxicab (%)
Means of transportation to work - Motorcycle (%)
Means of transportation to work - Bicycle (%)
Means of transportation to work - Walked (%)
Means of transportation to work - Other means (%)
Working at home (%)
Industry diversity
Most Common Industries - Agriculture, forestry, fishing and hunting, and mining (%)
Most Common Industries - Agriculture, forestry, fishing and hunting (%)
Most Common Industries - Mining, quarrying, and oil and gas extraction (%)
Most Common Industries - Construction (%)
Most Common Industries - Manufacturing (%)
Most Common Industries - Wholesale trade (%)
Most Common Industries - Retail trade (%)
Most Common Industries - Transportation and warehousing, and utilities (%)
Most Common Industries - Transportation and warehousing (%)
Most Common Industries - Utilities (%)
Most Common Industries - Information (%)
Most Common Industries - Finance and insurance, and real estate and rental and leasing (%)
Most Common Industries - Finance and insurance (%)
Most Common Industries - Real estate and rental and leasing (%)
Most Common Industries - Professional, scientific, and management, and administrative and waste management services (%)
Most Common Industries - Professional, scientific, and technical services (%)
Most Common Industries - Management of companies and enterprises (%)
Most Common Industries - Administrative and support and waste management services (%)
Most Common Industries - Educational services, and health care and social assistance (%)
Most Common Industries - Educational services (%)
Most Common Industries - Health care and social assistance (%)
Most Common Industries - Arts, entertainment, and recreation, and accommodation and food services (%)
Most Common Industries - Arts, entertainment, and recreation (%)
Most Common Industries - Accommodation and food services (%)
Most Common Industries - Other services, except public administration (%)
Most Common Industries - Public administration (%)
Occupation diversity
Most Common Occupations - Management, business, science, and arts occupations (%)
Most Common Occupations - Management, business, and financial occupations (%)
Most Common Occupations - Management occupations (%)
Most Common Occupations - Business and financial operations occupations (%)
Most Common Occupations - Computer, engineering, and science occupations (%)
Most Common Occupations - Computer and mathematical occupations (%)
Most Common Occupations - Architecture and engineering occupations (%)
Most Common Occupations - Life, physical, and social science occupations (%)
Most Common Occupations - Education, legal, community service, arts, and media occupations (%)
Most Common Occupations - Community and social service occupations (%)
Most Common Occupations - Legal occupations (%)
Most Common Occupations - Education, training, and library occupations (%)
Most Common Occupations - Arts, design, entertainment, sports, and media occupations (%)
Most Common Occupations - Healthcare practitioners and technical occupations (%)
Most Common Occupations - Health diagnosing and treating practitioners and other technical occupations (%)
Most Common Occupations - Health technologists and technicians (%)
Most Common Occupations - Service occupations (%)
Most Common Occupations - Healthcare support occupations (%)
Most Common Occupations - Protective service occupations (%)
Most Common Occupations - Fire fighting and prevention, and other protective service workers including supervisors (%)
Most Common Occupations - Law enforcement workers including supervisors (%)
Most Common Occupations - Food preparation and serving related occupations (%)
Most Common Occupations - Building and grounds cleaning and maintenance occupations (%)
Most Common Occupations - Personal care and service occupations (%)
Most Common Occupations - Sales and office occupations (%)
Most Common Occupations - Sales and related occupations (%)
Most Common Occupations - Office and administrative support occupations (%)
Most Common Occupations - Natural resources, construction, and maintenance occupations (%)
Most Common Occupations - Farming, fishing, and forestry occupations (%)
Most Common Occupations - Construction and extraction occupations (%)
Most Common Occupations - Installation, maintenance, and repair occupations (%)
Most Common Occupations - Production, transportation, and material moving occupations (%)
Most Common Occupations - Production occupations (%)
Most Common Occupations - Transportation occupations (%)
Most Common Occupations - Material moving occupations (%)
People in Group quarters - Institutionalized population (%)
People in Group quarters - Correctional institutions (%)
People in Group quarters - Federal prisons and detention centers (%)
People in Group quarters - Halfway houses (%)
People in Group quarters - Local jails and other confinement facilities (including police lockups) (%)
People in Group quarters - Military disciplinary barracks (%)
People in Group quarters - State prisons (%)
People in Group quarters - Other types of correctional institutions (%)
People in Group quarters - Nursing homes (%)
People in Group quarters - Hospitals/wards, hospices, and schools for the handicapped (%)
People in Group quarters - Hospitals/wards and hospices for chronically ill (%)
People in Group quarters - Hospices or homes for chronically ill (%)
People in Group quarters - Military hospitals or wards for chronically ill (%)
People in Group quarters - Other hospitals or wards for chronically ill (%)
People in Group quarters - Hospitals or wards for drug/alcohol abuse (%)
People in Group quarters - Mental (Psychiatric) hospitals or wards (%)
People in Group quarters - Schools, hospitals, or wards for the mentally retarded (%)
People in Group quarters - Schools, hospitals, or wards for the physically handicapped (%)
People in Group quarters - Institutions for the deaf (%)
People in Group quarters - Institutions for the blind (%)
People in Group quarters - Orthopedic wards and institutions for the physically handicapped (%)
People in Group quarters - Wards in general hospitals for patients who have no usual home elsewhere (%)
People in Group quarters - Wards in military hospitals for patients who have no usual home elsewhere (%)
People in Group quarters - Juvenile institutions (%)
People in Group quarters - Long-term care (%)
People in Group quarters - Homes for abused, dependent, and neglected children (%)
People in Group quarters - Residential treatment centers for emotionally disturbed children (%)
People in Group quarters - Training schools for juvenile delinquents (%)
People in Group quarters - Short-term care, detention or diagnostic centers for delinquent children (%)
People in Group quarters - Type of juvenile institution unknown (%)
People in Group quarters - Noninstitutionalized population (%)
People in Group quarters - College dormitories (includes college quarters off campus) (%)
People in Group quarters - Military quarters (%)
People in Group quarters - On base (%)
People in Group quarters - Barracks, unaccompanied personnel housing (UPH), (Enlisted/Officer), ;and similar group living quarters for military personnel (%)
People in Group quarters - Transient quarters for temporary residents (%)
People in Group quarters - Military ships (%)
People in Group quarters - Group homes (%)
People in Group quarters - Homes or halfway houses for drug/alcohol abuse (%)
People in Group quarters - Homes for the mentally ill (%)
People in Group quarters - Homes for the mentally retarded (%)
People in Group quarters - Homes for the physically handicapped (%)
People in Group quarters - Other group homes (%)
People in Group quarters - Religious group quarters (%)
People in Group quarters - Dormitories (%)
People in Group quarters - Agriculture workers' dormitories on farms (%)
People in Group quarters - Job Corps and vocational training facilities (%)
People in Group quarters - Other workers' dormitories (%)
People in Group quarters - Crews of maritime vessels (%)
People in Group quarters - Other nonhousehold living situations (%)
People in Group quarters - Other noninstitutional group quarters (%)
Residents speaking English at home (%)
Residents speaking English at home - Born in the United States (%)
Residents speaking English at home - Native, born elsewhere (%)
Residents speaking English at home - Foreign born (%)
Residents speaking Spanish at home (%)
Residents speaking Spanish at home - Born in the United States (%)
Residents speaking Spanish at home - Native, born elsewhere (%)
Residents speaking Spanish at home - Foreign born (%)
Residents speaking other language at home (%)
Residents speaking other language at home - Born in the United States (%)
Residents speaking other language at home - Native, born elsewhere (%)
Residents speaking other language at home - Foreign born (%)
Class of Workers - Employee of private company (%)
Class of Workers - Self-employed in own incorporated business (%)
Class of Workers - Private not-for-profit wage and salary workers (%)
Class of Workers - Local government workers (%)
Class of Workers - State government workers (%)
Class of Workers - Federal government workers (%)
Class of Workers - Self-employed workers in own not incorporated business and Unpaid family workers (%)
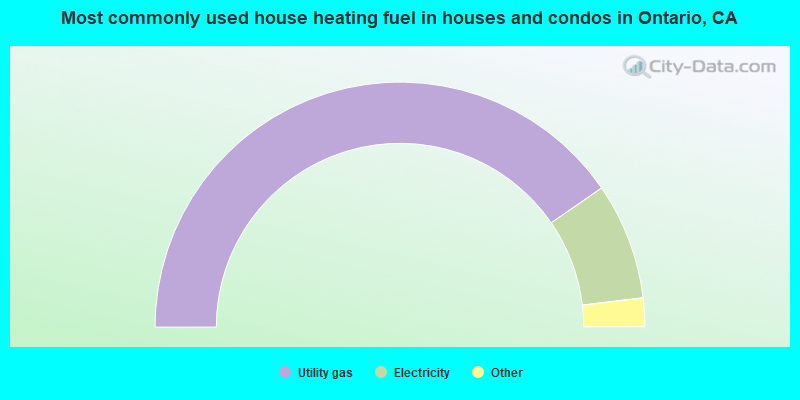
House heating fuel used in houses and condos - Utility gas (%)
House heating fuel used in houses and condos - Bottled, tank, or LP gas (%)
House heating fuel used in houses and condos - Electricity (%)
House heating fuel used in houses and condos - Fuel oil, kerosene, etc. (%)
House heating fuel used in houses and condos - Coal or coke (%)
House heating fuel used in houses and condos - Wood (%)
House heating fuel used in houses and condos - Solar energy (%)
House heating fuel used in houses and condos - Other fuel (%)
House heating fuel used in houses and condos - No fuel used (%)
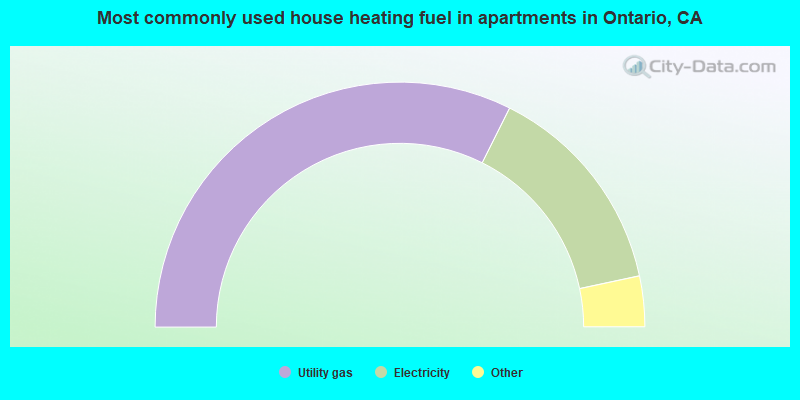
House heating fuel used in apartments - Utility gas (%)
House heating fuel used in apartments - Bottled, tank, or LP gas (%)
House heating fuel used in apartments - Electricity (%)
House heating fuel used in apartments - Fuel oil, kerosene, etc. (%)
House heating fuel used in apartments - Coal or coke (%)
House heating fuel used in apartments - Wood (%)
House heating fuel used in apartments - Solar energy (%)
House heating fuel used in apartments - Other fuel (%)
House heating fuel used in apartments - No fuel used (%)
Armed forces status - In Armed Forces (%)
Armed forces status - Civilian (%)
Armed forces status - Civilian - Veteran (%)
Armed forces status - Civilian - Nonveteran (%)
Fatal accidents locations in years 2005-2021
Fatal accidents locations in 2005
Fatal accidents locations in 2006
Fatal accidents locations in 2007
Fatal accidents locations in 2008
Fatal accidents locations in 2009
Fatal accidents locations in 2010
Fatal accidents locations in 2011
Fatal accidents locations in 2012
Fatal accidents locations in 2013
Fatal accidents locations in 2014
Fatal accidents locations in 2015
Fatal accidents locations in 2016
Fatal accidents locations in 2017
Fatal accidents locations in 2018
Fatal accidents locations in 2019
Fatal accidents locations in 2020
Fatal accidents locations in 2021
Alcohol use - People drinking some alcohol every month (%)
Alcohol use - People not drinking at all (%)
Alcohol use - Average days/month drinking alcohol
Alcohol use - Average drinks/week
Alcohol use - Average days/year people drink much
Audiometry - Average condition of hearing (%)
Audiometry - People that can hear a whisper from across a quiet room (%)
Audiometry - People that can hear normal voice from across a quiet room (%)
Audiometry - Ears ringing, roaring, buzzing (%)
Audiometry - Had a job exposure to loud noise (%)
Audiometry - Had off-work exposure to loud noise (%)
Blood Pressure & Cholesterol - Has high blood pressure (%)
Blood Pressure & Cholesterol - Checking blood pressure at home (%)
Blood Pressure & Cholesterol - Frequently checking blood cholesterol (%)
Blood Pressure & Cholesterol - Has high cholesterol level (%)
Consumer Behavior - Money monthly spent on food at supermarket/grocery store
Consumer Behavior - Money monthly spent on food at other stores
Consumer Behavior - Money monthly spent on eating out
Consumer Behavior - Money monthly spent on carryout/delivered foods
Consumer Behavior - Income spent on food at supermarket/grocery store (%)
Consumer Behavior - Income spent on food at other stores (%)
Consumer Behavior - Income spent on eating out (%)
Consumer Behavior - Income spent on carryout/delivered foods (%)
Current Health Status - General health condition (%)
Current Health Status - Blood donors (%)
Current Health Status - Has blood ever tested for HIV virus (%)
Current Health Status - Left-handed people (%)
Dermatology - People using sunscreen (%)
Diabetes - Diabetics (%)
Diabetes - Had a blood test for high blood sugar (%)
Diabetes - People taking insulin (%)
Diet Behavior & Nutrition - Diet health (%)
Diet Behavior & Nutrition - Milk product consumption (# of products/month)
Diet Behavior & Nutrition - Meals not home prepared (#/week)
Diet Behavior & Nutrition - Meals from fast food or pizza place (#/week)
Diet Behavior & Nutrition - Ready-to-eat foods (#/month)
Diet Behavior & Nutrition - Frozen meals/pizza (#/month)
Drug Use - People that ever used marijuana or hashish (%)
Drug Use - Ever used hard drugs (%)
Drug Use - Ever used any form of cocaine (%)
Drug Use - Ever used heroin (%)
Drug Use - Ever used methamphetamine (%)
Health Insurance - People covered by health insurance (%)
Kidney Conditions-Urology - Avg. # of times urinating at night
Medical Conditions - People with asthma (%)
Medical Conditions - People with anemia (%)
Medical Conditions - People with psoriasis (%)
Medical Conditions - People with overweight (%)
Medical Conditions - Elderly people having difficulties in thinking or remembering (%)
Medical Conditions - People who ever received blood transfusion (%)
Medical Conditions - People having trouble seeing even with glass/contacts (%)
Medical Conditions - People with arthritis (%)
Medical Conditions - People with gout (%)
Medical Conditions - People with congestive heart failure (%)
Medical Conditions - People with coronary heart disease (%)
Medical Conditions - People with angina pectoris (%)
Medical Conditions - People who ever had heart attack (%)
Medical Conditions - People who ever had stroke (%)
Medical Conditions - People with emphysema (%)
Medical Conditions - People with thyroid problem (%)
Medical Conditions - People with chronic bronchitis (%)
Medical Conditions - People with any liver condition (%)
Medical Conditions - People who ever had cancer or malignancy (%)
Mental Health - People who have little interest in doing things (%)
Mental Health - People feeling down, depressed, or hopeless (%)
Mental Health - People who have trouble sleeping or sleeping too much (%)
Mental Health - People feeling tired or having little energy (%)
Mental Health - People with poor appetite or overeating (%)
Mental Health - People feeling bad about themself (%)
Mental Health - People who have trouble concentrating on things (%)
Mental Health - People moving or speaking slowly or too fast (%)
Mental Health - People having thoughts they would be better off dead (%)
Oral Health - Average years since last visit a dentist
Oral Health - People embarrassed because of mouth (%)
Oral Health - People with gum disease (%)
Oral Health - General health of teeth and gums (%)
Oral Health - Average days a week using dental floss/device
Oral Health - Average days a week using mouthwash for dental problem
Oral Health - Average number of teeth
Pesticide Use - Households using pesticides to control insects (%)
Pesticide Use - Households using pesticides to kill weeds (%)
Physical Activity - People doing vigorous-intensity work activities (%)
Physical Activity - People doing moderate-intensity work activities (%)
Physical Activity - People walking or bicycling (%)
Physical Activity - People doing vigorous-intensity recreational activities (%)
Physical Activity - People doing moderate-intensity recreational activities (%)
Physical Activity - Average hours a day doing sedentary activities
Physical Activity - Average hours a day watching TV or videos
Physical Activity - Average hours a day using computer
Physical Functioning - People having limitations keeping them from working (%)
Physical Functioning - People limited in amount of work they can do (%)
Physical Functioning - People that need special equipment to walk (%)
Physical Functioning - People experiencing confusion/memory problems (%)
Physical Functioning - People requiring special healthcare equipment (%)
Prescription Medications - Average number of prescription medicines taking
Preventive Aspirin Use - Adults 40+ taking low-dose aspirin (%)
Reproductive Health - Vaginal deliveries (%)
Reproductive Health - Cesarean deliveries (%)
Reproductive Health - Deliveries resulted in a live birth (%)
Reproductive Health - Pregnancies resulted in a delivery (%)
Reproductive Health - Women breastfeeding newborns (%)
Reproductive Health - Women that had a hysterectomy (%)
Reproductive Health - Women that had both ovaries removed (%)
Reproductive Health - Women that have ever taken birth control pills (%)
Reproductive Health - Women taking birth control pills (%)
Reproductive Health - Women that have ever used Depo-Provera or injectables (%)
Reproductive Health - Women that have ever used female hormones (%)
Sexual Behavior - People 18+ that ever had sex (vaginal, anal, or oral) (%)
Sexual Behavior - Males 18+ that ever had vaginal sex with a woman (%)
Sexual Behavior - Males 18+ that ever performed oral sex on a woman (%)
Sexual Behavior - Males 18+ that ever had anal sex with a woman (%)
Sexual Behavior - Males 18+ that ever had any sex with a man (%)
Sexual Behavior - Females 18+ that ever had vaginal sex with a man (%)
Sexual Behavior - Females 18+ that ever performed oral sex on a man (%)
Sexual Behavior - Females 18+ that ever had anal sex with a man (%)
Sexual Behavior - Females 18+ that ever had any kind of sex with a woman (%)
Sexual Behavior - Average age people first had sex
Sexual Behavior - Average number of female sex partners in lifetime (males 18+)
Sexual Behavior - Average number of female vaginal sex partners in lifetime (males 18+)
Sexual Behavior - Average age people first performed oral sex on a woman (18+)
Sexual Behavior - Average number of woman performed oral sex on in lifetime (18+)
Sexual Behavior - Average number of male sex partners in lifetime (males 18+)
Sexual Behavior - Average number of male anal sex partners in lifetime (males 18+)
Sexual Behavior - Average age people first performed oral sex on a man (18+)
Sexual Behavior - Average number of male oral sex partners in lifetime (18+)
Sexual Behavior - People using protection when performing oral sex (%)
Sexual Behavior - Average number of times people have vaginal or anal sex a year
Sexual Behavior - People having sex without condom (%)
Sexual Behavior - Average number of male sex partners in lifetime (females 18+)
Sexual Behavior - Average number of male vaginal sex partners in lifetime (females 18+)
Sexual Behavior - Average number of female sex partners in lifetime (females 18+)
Sexual Behavior - Circumcised males 18+ (%)
Sleep Disorders - Average hours sleeping at night
Sleep Disorders - People that has trouble sleeping (%)
Smoking-Cigarette Use - People smoking cigarettes (%)
Taste & Smell - People 40+ having problems with smell (%)
Taste & Smell - People 40+ having problems with taste (%)
Taste & Smell - People 40+ that ever had wisdom teeth removed (%)
Taste & Smell - People 40+ that ever had tonsils teeth removed (%)
Taste & Smell - People 40+ that ever had a loss of consciousness because of a head injury (%)
Taste & Smell - People 40+ that ever had a broken nose or other serious injury to face or skull (%)
Taste & Smell - People 40+ that ever had two or more sinus infections (%)
Weight - Average height (inches)
Weight - Average weight (pounds)
Weight - Average BMI
Weight - People that are obese (%)
Weight - People that ever were obese (%)
Weight - People trying to lose weight (%)
126,071 70.4% Hispanic 21,452 12.0% White alone 18,132 10.1% Asian alone 7,669 4.3% Black alone 4,537 2.5% Two or more races 523 0.3% Other race alone 417 0.2% American Indian alone 261 0.1% Native Hawaiian and Other
According to our research of California and other state lists, there were 202 registered sex offenders living in Ontario, California as of April 27, 2024 . The ratio of all residents to sex offenders in Ontario is 857 to 1.The ratio of registered sex offenders to all residents in this city is near the state average.
The City-Data.com crime index weighs serious crimes and violent crimes more heavily. Higher means more crime, U.S. average is 246.1. It adjusts for the number of visitors and daily workers commuting into cities.
- means the value is smaller than the state average.
- means the value is about the same as the state average.
- means the value is bigger than the state average.
- means the value is much bigger than the state average.
Crime rate in Ontario detailed stats: murders, rapes, robberies, assaults, burglaries, thefts, arson Officers per 1,000 residents here:
1.41California average:
2.30
Latest news from Ontario, CA collected exclusively by city-data.com from local newspapers, TV, and radio stations
Ancestries: American (2.1%), German (1.1%).
Current Local Time:
Land area: 49.8 square miles.
Population density: 3,597 people per square mile (average).
48,939 residents are foreign born (21.5% Latin America , 5.2% Asia ).
This city:
27.6%California:
26.5%
Median real estate property taxes paid for housing units with mortgages in 2022: $3,810 (0.6%)Median real estate property taxes paid for housing units with no mortgage in 2022: $2,135 (0.4%)
Nearest city with pop. 200,000+: East San Gabriel Valley, CA
Nearest city with pop. 1,000,000+: Los Angeles, CA
Nearest cities:
Latitude: 34.05 N, Longitude: 117.63 W
Daytime population change due to commuting: +45,637 (+25.5%)Workers who live and work in this city: 27,244 (32.7%)
Property values in Ontario, CA
Ontario tourist attractions:
Single-family new house construction building permits:
2022: 746 buildings , average cost: $177,9002021: 738 buildings , average cost: $182,5002020: 645 buildings , average cost: $212,1002019: 1167 buildings , average cost: $249,6002018: 1056 buildings , average cost: $209,9002017: 649 buildings , average cost: $190,3002016: 448 buildings , average cost: $198,4002015: 291 buildings , average cost: $192,9002014: 132 buildings , average cost: $180,1002013: 171 buildings , average cost: $167,6002012: 37 buildings , average cost: $131,1002011: 36 buildings , average cost: $122,1002010: 30 buildings , average cost: $111,8002009: 35 buildings , average cost: $125,1002008: 8 buildings , average cost: $164,1002007: 307 buildings , average cost: $148,8002006: 69 buildings , average cost: $177,7002005: 153 buildings , average cost: $145,4002004: 132 buildings , average cost: $138,4002003: 87 buildings , average cost: $204,7002002: 60 buildings , average cost: $191,1002001: 149 buildings , average cost: $205,8002000: 236 buildings , average cost: $197,2001999: 109 buildings , average cost: $187,6001998: 207 buildings , average cost: $198,4001997: 186 buildings , average cost: $171,900Unemployment in December 2023:
Population change in the 1990s: +22,882 (+16.9%).
Most common occupations in Ontario, CA (%)
Both Males Females
Laborers and material movers, hand (5.9%)
Building and grounds cleaning and maintenance occupations (5.2%)
Cooks and food preparation workers (5.0%)
Driver/sales workers and truck drivers (4.8%)
Material recording, scheduling, dispatching, and distributing workers (4.2%)
Other management occupations, except farmers and farm managers (4.0%)
Other office and administrative support workers, including supervisors (3.4%)
Driver/sales workers and truck drivers (8.5%)
Laborers and material movers, hand (7.1%)
Building and grounds cleaning and maintenance occupations (5.8%)
Material recording, scheduling, dispatching, and distributing workers (5.0%)
Cooks and food preparation workers (4.1%)
Electrical equipment mechanics and other installation, maintenance, and repair workers, including supervisors (4.0%)
Other production occupations, including supervisors (3.5%)
Cooks and food preparation workers (6.0%)
Other office and administrative support workers, including supervisors (5.6%)
Cashiers (5.0%)
Other management occupations, except farmers and farm managers (4.6%)
Building and grounds cleaning and maintenance occupations (4.5%)
Laborers and material movers, hand (4.4%)
Retail sales workers, except cashiers (4.1%)
Earthquake activity:
Ontario-area historical earthquake activity is significantly above California state average. It is 7258% greater than the overall U.S. average. On 6/28/1992 at 11:57:34, a magnitude 7.6 (6.2 MB, 7.6 MS, 7.3 MW, Depth: 0.7 mi, Class: Major, Intensity: VIII - XII) earthquake occurred 63.4 miles away from the city center, causing 3 deaths ( 1 shaking deaths, 2 other deaths) and 400 injuries, causing $100,000,000 total damage and $40,000,000 insured lossesOn 7/21/1952 at 11:52:14, a magnitude 7.7 (7.7 UK) earthquake occurred 102.0 miles away from the city center, causing $50,000,000 total damage On 10/16/1999 at 09:46:44, a magnitude 7.4 (6.3 MB, 7.4 MS, 7.2 MW, 7.3 ML) earthquake occurred 75.3 miles away from the city center On 4/21/1918 at 22:32:30, a magnitude 6.8 (6.8 UK, Class: Strong, Intensity: VII - IX) earthquake occurred 19.8 miles away from Ontario center On 6/28/1992 at 15:05:30, a magnitude 6.9 (6.3 MB, 6.7 MS, 6.5 MW, 6.9 ME, Depth: 3.1 mi) earthquake occurred 49.2 miles away from Ontario center On 5/19/1940 at 04:36:40, a magnitude 7.2 (7.2 UK) earthquake occurred 125.2 miles away from Ontario center, causing $33,000,000 total damage Magnitude types: body-wave magnitude (MB), energy magnitude (ME), local magnitude (ML), surface-wave magnitude (MS), moment magnitude (MW) Natural disasters: The number of natural disasters in San Bernardino County (46) is a lot greater than the US average (15).Major Disasters (Presidential) Declared: 27Emergencies Declared: 2Fires: 24, Floods: 18, Storms: 9, Winter Storms: 6, Landslides: 5, Mudslides: 4, Heavy Rains: 2, Earthquake: 1, Flash Flood: 1, Freeze: 1, Hurricane: 1, Snow: 1, Tornado: 1, Tropical Storm: 1, Wind: 1, Other: 1 (Note: some incidents may be assigned to more than one category). Main business address for: KAISER VENTURES LLC LESSORS OF REAL PROPERTY, NEC ), CVB FINANCIAL CORP STATE COMMERCIAL BANKS ).
Hospitals in Ontario: KINDRED HOSPITAL (550 NORTH MONTEREY) MANZANITA HOME (708 MANZANITA COURT) ODESSEY HOME (2032 OLIVE COURT) VENCOR HOSPITAL - ONTARIO (550 N MONTEREY AVE) Nursing Homes in Ontario: BELLA VISTA HEALTHCARE CENTER (933 EAST DEODAR STREET) HOME OF ANGELS (540 W MAPLE STREET) INLAND CHRISTIAN HOME (1950 S. MOUNTAIN AVE) ONTARIO HEALTHCARE CENTER (1661 SOUTH EUCLID AVENUE) PLOTT NURSING HOME (800 EAST FIFTH STREET) Dialysis Facilities in Ontario: DAVITA-ONTARIO DIALYSIS (1950-A GROVE AVENUE, SUITE 101) DIALYSIS CENTER OF ONTARIO, LLC (2850 INLAND EMPIRE BLVD., SUITE C) ONTARIO DIALYSIS INC. (1001 W. SIXTH STREET, SUITE A) Home Health Centers in Ontario: ACCENTCARE HOME HEALTH OF CALIFORNIA, INC (1455 SOUTH AUTO CENTER DRIVE) ADEPT HOME HEALTH SERVICES, INC (1131 W 6TH STREET #270) AJA PLUS HOME HEALTH SERVICES, INC (4295 EAST JURUPA STREET SUITE 213) ALLCARE HEALTH SERVICES, INC (360 SOUTH MILLIKEN AVENUE SUITE F&G) BEST HOME HEALTH CARE INC (1630 E FRANCIS STREET SUITE K) QUALITY HOME HEALTH AGENCY (4375 E LOWELL STREET SUITE I) Airports located in Ontario: Amtrak station: ONTARIO (228 S. PLUM ST.)
.
Services: fully wheelchair accessible, public payphones, vending machines, free short-term parking, call for taxi service.
Colleges/Universities in Ontario: West Coast University-Ontario Full-time enrollment: 1,887; Location: 2855 E. Guasti Rd; Private, for-profit; Website: westcoastuniversity.edu/campuses/ontario.html)
American Career College-Ontario Full-time enrollment: 1,312; Location: 3130 East Sedona Court; Private, for-profit; Website: www.americancareercollege.edu)
Everest College-Ontario Metro Full-time enrollment: 1,266; Location: 1819 South Excise Avenue; Private, for-profit; Website: www.everest.edu/campus/ontario_metro)
Everest College-Ontario Full-time enrollment: 1,132; Location: 1460 S. Milliken Ave; Private, for-profit; Website: www.everest.edu/campus/ontario)
San Joaquin Valley College-Ontario Full-time enrollment: 1,008; Location: 4580 Ontario Mills Parkway; Private, for-profit; Website: sjvc.edu)
Platt College-Ontario Full-time enrollment: 575; Location: 3700 Inland Empire Boulevard; Private, for-profit; Website: www.plattcollege.edu)
Argosy University-Inland Empire Full-time enrollment: 558; Location: 3401 Centre Lake Drive, Suite 200; Private, for-profit; Website: www.argosy.edu/inlandempire; Offers Doctor's degree )
Franklin Career College Location: 1274 Slater Cir; Private, for-profit; Website: www.franklincareercollege.com)
Colleges/universities with over 2000 students nearest to Ontario:
Universal Technical Institute of California Inc (about 4 miles; Rancho Cucamonga, CA ; Full-time enrollment: 4,158)
Chaffey College (about 8 miles; Rancho Cucamonga, CA ; FT enrollment: 10,496)
University of La Verne (about 9 miles; La Verne, CA ; FT enrollment: 6,983)
Norco College (about 11 miles; Norco, CA ; FT enrollment: 4,916)
DeVry University-California (about 11 miles; Pomona, CA ; FT enrollment: 10,875)
California State Polytechnic University-Pomona (about 11 miles; Pomona, CA ; FT enrollment: 18,141)
Mt San Antonio College (about 13 miles; Walnut, CA ; FT enrollment: 19,891)
Public high schools in Ontario: CHAFFEY HIGH Students: 2,394, Location: 1245 N. EUCLID AVE., Grades: 9-12)ONTARIO HIGH Students: 1,990, Location: 901 W. FRANCIS ST., Grades: 9-12)COLONY HIGH Students: 1,562, Location: 3850 E. RIVERSIDE DR., Grades: 9-12)VALLEY VIEW HIGH (CONTINUATION) Students: 68, Location: 1801 E. SIXTH ST., Grades: 9-12)CHAFFEY COMMUNITY DAY Students: 45, Location: 1802 E. SEVENTH ST., Grades: 9-12)CHAFFEY DISTRICT ONLINE HIGH Location: 1802 E. 7TH ST., Grades: 9-12)
Private high schools in Ontario: ONTARIO CHRISTIAN SCHOOLS Students: 1,270, Location: 931 W PHILADELPHIA ST, Grades: KG-12)
MONTECITO BAPTIST SCHOOL Students: 87, Location: 2560 S ARCHIBALD AVE, Grades: KG-12)
SAN ANTONIO CHRISTIAN SCHOOL Students: 85, Location: 1722 E 8TH ST, Grades: KG-10)
Biggest public elementary/middle schools in Ontario: VINA DANKS MIDDLE Students: 1,091, Location: 1020 N. VINE AVE., Grades: 7-8)GRACE YOKLEY MIDDLE Students: 979, Location: 2947 S. TURNER AVE., Grades: 6-8)OAKS MIDDLE Students: 907, Location: 1221 S. OAKS AVE., Grades: 7-8)RAY WILTSEY MIDDLE Students: 854, Location: 1450 E. G ST., Grades: 6-8)DE ANZA MIDDLE Students: 846, Location: 1450 S. SULTANA AVE., Grades: 7-8)RICHARD HAYNES ELEMENTARY Students: 547, Location: 715 W. FRANCIS ST., Grades: KG-6)BERLYN ELEMENTARY Students: 542, Location: 1320 N. BERLYN AVE., Grades: KG-6)SULTANA ELEMENTARY Students: 525, Location: 1845 S. SULTANA AVE., Grades: KG-6)BON VIEW ELEMENTARY Students: 506, Location: 2121 S. BON VIEW AVE., Grades: KG-6)HAWTHORNE ELEMENTARY Students: 495, Location: 705 W. HAWTHORNE ST., Grades: KG-6)Private elementary/middle schools in Ontario: ST GEORGE PARISH SCHOOL Students: 292, Location: 322 W D ST, Grades: KG-8)
REDEEMER LUTHERAN CHRISTIAN SCHOOL Students: 68, Location: 920 W 6TH ST, Grades: PK-8)
ONTARIO PROGRESSIVE MONTESSORI SCHOOL Students: 25, Location: 328 W PHILLIPS ST, Grades: PK-1)
See full list of schools located in Ontario Library in Ontario: ONTARIO CITY LIBRARY Operating income: $4,263,509; Location: 215 EAST C STREET; 217,579 books ; 1,215 e-books ; 17,753 audio materials ; 10,902 video materials ; 11 local licensed databases ; 1 other licensed databases ; 686 print serial subscriptions ; 1 electronic serial subscriptions )
Notable locations in Ontario: (A) , Three Palms Dairy (B) , Bacho's Dairy (C) , Bangma Dairy (D) , Brothers Three Dairy (E) , Chino Dairy (F) , Dehoog Dairy (G) , Dykstra Dairy (H) , Heims Pride Dairy (I) , Jai Alai Dairy (J) , K and B Dairy (K) , L and M Dairy (L) , Pyrenees Dairy (M) , Veenendaal Dairy (N) , Two B Dairy (O) , Tiva Dairy (P) , Sultana Dairy (Q) , R and V Dairy (R) , Woodcrest Dairy (S) , Venegas Dairy (T) . Display/hide their locations on the map
Shopping Centers: (1) , Ontario Village Shopping Center (2) , Ontario Plaza Shopping Center (3) , Ontario Plaza Shopping Center (4) , Galvin Park Shopping Center (5) , Vineyard Freeway Shopping Center (6) , The Vineyard Shopping Center (7) , The Vineyard Ontario Shopping Center (8) , Ontario Vineyard Marketplace Shopping Center (9) . Display/hide their locations on the map
Main business address in Ontario include: (A) , CVB FINANCIAL CORP (B) . Display/hide their locations on the map
Churches in Ontario include: (A) , Army of the Word World Church (B) , Brethren In Christ Church (C) , Church of Secundo d'Asti (D) , First Church of God (E) , Fourth Street Baptist Church (F) , Iglesia Evangelica Cristo (G) , Church of Christ (H) , The Church of Jesus Christ of Latter Day Saints (I) . Display/hide their locations on the map
Cemetery: (1) . Display/hide its location on the map
Creek: (A) . Display/hide its location on the map
Parks in Ontario include: (1) , Colony Park (2) , Del Rancho Park (3) , Galanis Park (4) , Galvin Park (5) , Memorial Grove Park (6) , Cucamonga-Gusti Regional Park (7) , Vineyard Park (8) , Oaks Avenue Pioneer Park (9) . Display/hide their locations on the map
Tourist attraction: (1) . Display/hide its approximate location on the map
Hotels: (1) , Best Western Ontario Airport (209 North Vineyard Avenue) (2) , Amerisuites Ontario Mills (4760 Mills Cir) (3) , AmeriSuites Hotel (4760 E Mills Circle) (4) , Best Western Inn (209 North Vineyard Avenue) (5) , American Inn (755 North Euclid Av) (6) , Bright Star Motel (1530 West Mission Boulevard) (7) . Display/hide their approximate locations on the map
Court: (1) . Display/hide its approximate location on the map
Birthplace of: Del Crandall - Baseball player and coach, Anthony Muñoz - Football player, Antonio Pierce - 2005 NFL player (New York Giants, born : Oct 26, 1978), Charles G. Irion - Businessperson, Cle Kooiman - Soccer player-coach, Jason Bowles - Stock car racing driver, Jeff Pendergraph - Basketball player, Omar Bolden - Football defensive back, Prince Fielder - 2005 Major League Baseball player (Milwaukee Brewers, born : May 18, 1984), Reuben Duran - Martial artist.
San Bernardino County has a predicted average indoor radon screening level between 2 and 4 pCi/L (pico curies per liter) - Moderate Potential Drinking water stations with addresses in Ontario that have no violations reported:
MACLIN MARKETS (Population served: 1,000, Primary Water Source Type: Groundwater)
HOLCOMB VALLEY SCOUT RANCH (Population served: 250, Primary Water Source Type: Groundwater)
CHINO BASIN DESALTER AUTH. - DESALTER 2 (Population served: 0, Primary Water Source Type: Groundwater)
CHINO BASIN DESALTER AUTH. - DESALTER 1 (Population served: 0, Primary Water Source Type: Groundwater)
Average household size: This city:
3.6 peopleCalifornia:
2.9 people
Percentage of family households: This city:
79.2%Whole state:
68.7%
Percentage of households with unmarried partners: This city:
8.6%Whole state:
7.2%
Likely homosexual households (counted as self-reported same-sex unmarried-partner households)
Lesbian couples: 0.5% of all households Gay men: 0.4% of all households
People in group quarters in Ontario in 2010:
347 people in nursing facilities/skilled-nursing facilities
152 people in other noninstitutional facilities
141 people in group homes intended for adults
47 people in college/university student housing
41 people in emergency and transitional shelters (with sleeping facilities) for people experiencing homelessness
28 people in workers' group living quarters and job corps centers
2 people in residential treatment centers for adults
People in group quarters in Ontario in 2000:
557 people in other noninstitutional group quarters
412 people in nursing homes
82 people in homes for the mentally retarded
45 people in homes or halfway houses for drug/alcohol abuse
14 people in homes for the mentally ill
10 people in agriculture workers' dormitories on farms
6 people in homes for abused, dependent, and neglected children
5 people in orthopedic wards and institutions for the physically handicapped
5 people in unknown juvenile institutions
5 people in other group homes
Banks with most branches in Ontario (2011 data):
Wells Fargo Bank, National Association: South Ontario Branch, Ontario Mills Branch, Ontario Branch, Albertsons Ontario Branch, Inland Empire Rcbo Branch. Info updated 2011/04/05: Bank assets: $1,161,490.0 mil, Deposits: $905,653.0 mil, headquarters in Sioux Falls, SD, positive income , 6395 total offices , Holding Company: Wells Fargo & Company
U.S. Bank National Association: Ontario Ralphs Branch, Ontario - Euclid Avenue Branch, Ontario - Grove Avenue Branch, Ontario Branch. Info updated 2012/01/30: Bank assets: $330,470.8 mil, Deposits: $236,091.5 mil, headquarters in Cincinnati, OH, positive income , 3121 total offices , Holding Company: U.S. Bancorp
Pacific Western Bank: Ontario Branch at 2401 South Grove Avenue, branch established on 1983/01/10; Limited Service Branch (Courier) at 845 North Euclid Avenue, branch established on 1985/10/17. Info updated 2011/03/14: Bank assets: $5,513.1 mil, Deposits: $4,614.5 mil, headquarters in Los Angeles, CA, positive income , Commercial Lending Specialization, 78 total offices , Holding Company: Capgen Capital Group Ii Lp
Bank of America, National Association: Ontario Branch at 735 North Euclid Avenue, branch established on 1923/05/28; Ontario Plaza Branch at 910 North Mountain Avenue, branch established on 1957/04/08. Info updated 2009/11/18: Bank assets: $1,451,969.3 mil, Deposits: $1,077,176.8 mil, headquarters in Charlotte, NC, positive income , 5782 total offices , Holding Company: Bank Of America Corporation
Cathay Bank: Ontario Branch at 2000a South Grove Avenue, Suite 103, branch established on 2007/07/23. Info updated 2010/12/08: Bank assets: $10,628.9 mil, Deposits: $7,249.8 mil, headquarters in Los Angeles, CA, positive income , Commercial Lending Specialization, 52 total offices , Holding Company: Cathay General Bancorp
Inland Community Bank, National Association: Ontario Regional Branch at 3999 Inland Empire Blvd, branch established on 1995/01/11. Info updated 2006/09/19: Bank assets: $223.2 mil, Deposits: $194.4 mil, headquarters in Rialto, CA, negative income in the last year , Commercial Lending Specialization, 5 total offices , Holding Company: Fa Capital, Llc
Compass Bank: Ontario Superior Branch at 815 W Holt Blvd, branch established on 2006/06/30. Info updated 2011/02/24: Bank assets: $63,107.0 mil, Deposits: $46,232.4 mil, headquarters in Birmingham, AL, negative income in the last year , Commercial Lending Specialization, 720 total offices , Holding Company: Banco Bilbao Vizcaya Argentaria, S.A.
Community Bank: Ontario Branch at 3110 East Guasti Road, Suite 500, branch established on 2005/01/03. Info updated 2010/02/16: Bank assets: $2,601.3 mil, Deposits: $1,941.4 mil, headquarters in Pasadena, CA, positive income , Commercial Lending Specialization, 17 total offices
Manufacturers Bank: Ontario Office Branch at 2855 E. Guasti Rd., Suite 212, branch established on 2008/11/01. Info updated 2011/09/29: Bank assets: $1,982.9 mil, Deposits: $1,480.0 mil, headquarters in Los Angeles, CA, positive income , Commercial Lending Specialization, 10 total offices , Holding Company: Sumitomo Mitsui Financial Group, Inc.
9 other banks with 9 local branches
For population 15 years and over in Ontario:
Never married: 41.9%Now married: 44.4%Separated: 2.1%Widowed: 4.2%Divorced: 7.4% For population 25 years and over in Ontario:
High school or higher: 80.0%Bachelor's degree or higher: 18.5%Graduate or professional degree: 4.9%Unemployed: 8.9%Mean travel time to work (commute): 28.1 minutes
Education Gini index (Inequality in education) Here:
16.4California average:
15.5
Religion statistics for Ontario, CA (based on San Bernardino County data)
Religion Adherents Congregations Catholic 445,334 55 Evangelical Protestant 243,524 832 Other 80,047 205 Mainline Protestant 26,062 135 Black Protestant 14,969 37 Orthodox 3,868 10 None 1,221,406 -
Source: Clifford Grammich, Kirk Hadaway, Richard Houseal, Dale E.Jones, Alexei Krindatch, Richie Stanley and Richard H.Taylor. 2012. 2010 U.S.Religion Census: Religious Congregations & Membership Study. Association of Statisticians of American Religious Bodies. Jones, Dale E., et al. 2002. Congregations and Membership in the United States 2000. Nashville, TN: Glenmary Research Center. Graphs represent county-level data
Food Environment Statistics: Number of grocery stores : 301This county :
1.50 / 10,000 pop.State :
2.14 / 10,000 pop.
Number of supercenters and club stores : 11San Bernardino County :
0.05 / 10,000 pop.California :
0.04 / 10,000 pop.
Number of convenience stores (no gas) : 114Here :
0.57 / 10,000 pop.State :
0.62 / 10,000 pop.
Number of convenience stores (with gas) : 320San Bernardino County :
1.60 / 10,000 pop.State :
1.49 / 10,000 pop.
Number of full-service restaurants : 940This county :
4.69 / 10,000 pop.California :
7.42 / 10,000 pop.
Adult obesity rate : This county :
27.1%California :
21.3%
Low-income preschool obesity rate : San Bernardino County :
16.2%California :
17.9%
Health and Nutrition: Healthy diet rate : Ontario:
46.8%California:
49.4%
Average overall health of teeth and gums : Ontario:
47.1%California:
48.0%
Average BMI : This city:
28.4California:
28.1
People feeling badly about themselves : Ontario:
21.7%California:
20.2%
People not drinking alcohol at all : Here:
10.0%California:
11.2%
Average hours sleeping at night : Overweight people : This city:
31.6%State:
31.5%
General health condition : Here:
55.5%California:
56.4%
Average condition of hearing : Here:
82.2%California:
80.9%
More about Health and Nutrition of Ontario, CA Residents
Local government employment and payroll (March 2022)
Function
Full-time employees
Monthly full-time payroll
Average yearly full-time wage
Part-time employees
Monthly part-time payroll
Police Protection - Officers
224 $3,411,448 $182,756 0 $0 Firefighters
142 $2,283,374 $192,961 0 $0 Other and Unallocable
110 $1,275,278 $139,121 5 $7,212 Water Supply
108 $978,629 $108,737 11 $24,593 Solid Waste Management
96 $743,199 $92,900 0 $0 Parks and Recreation
83 $663,883 $95,983 197 $175,507 Airports
80 $1,351,708 $202,756 0 $0 Police - Other
73 $626,063 $102,914 16 $23,794 Other Government Administration
72 $830,874 $138,479 22 $29,748 Financial Administration
67 $778,347 $139,405 11 $18,708 Fire - Other
37 $366,063 $118,723 13 $31,375 Local Libraries
21 $158,755 $90,717 43 $72,086 Housing and Community Development (Local)
14 $175,460 $150,394 2 $4,977
Totals for Government
1,127 $13,643,083 $145,268 320 $388,001
Ontario government finances - Expenditure in 2021 (per resident):
Current Operations - General - Other: $145,850,000 ($814.53)
Police Protection: $102,216,000 ($570.84)Local Fire Protection: $76,152,000 ($425.29)Central Staff Services: $75,565,000 ($422.01)Water Utilities: $51,672,000 ($288.57)Solid Waste Management: $41,308,000 ($230.69)Regular Highways: $34,303,000 ($191.57)Parks and Recreation: $27,307,000 ($152.50)Sewerage: $24,256,000 ($135.46)Protective Inspection and Regulation - Other: $21,475,000 ($119.93)Housing and Community Development: $12,533,000 ($69.99)Libraries: $5,271,000 ($29.44)Health - Other: $1,742,000 ($9.73)General - Interest on Debt: $16,155,000 ($90.22)
Water Utilities - Interest on Debt: $3,154,000 ($17.61)
Ontario government finances - Revenue in 2021 (per resident):
Charges - Other: $53,695,000 ($299.87)
Solid Waste Management: $41,913,000 ($234.07)Sewerage: $30,012,000 ($167.61)Parks and Recreation: $210,000 ($1.17)Federal Intergovernmental - Other: $28,676,000 ($160.15)
Housing and Community Development: $27,000 ($0.15)Miscellaneous - General Revenue - Other: $107,290,000 ($599.18)
Interest Earnings: $7,825,000 ($43.70)Rents: $838,000 ($4.68)Fines and Forfeits: $679,000 ($3.79)Revenue - Water Utilities: $61,508,000 ($343.50)
State Intergovernmental - Other: $21,251,000 ($118.68)
Highways: $7,388,000 ($41.26)Water Utilities: $2,577,000 ($14.39)General Local Government Support: $313,000 ($1.75)Tax - General Sales and Gross Receipts: $107,310,000 ($599.29)
Property: $71,900,000 ($401.54)Other License: $63,577,000 ($355.06)Other Selective Sales: $12,339,000 ($68.91)Occupation and Business License - Other: $8,559,000 ($47.80)Public Utilities Sales: $3,512,000 ($19.61)Documentary and Stock Transfer: $1,782,000 ($9.95)
Ontario government finances - Debt in 2021 (per resident):
Long Term Debt - Outstanding Unspecified Public Purpose: $707,394,000 ($3950.58)
Beginning Outstanding - Unspecified Public Purpose: $675,346,000 ($3771.60)Issue, Unspecified Public Purpose: $66,380,000 ($370.71)Beginning Outstanding - Public Debt for Private Purpose: $48,300,000 ($269.74)Outstanding Nonguaranteed - Industrial Revenue: $48,250,000 ($269.46)Retired Unspecified Public Purpose: $34,332,000 ($191.73)Retired Nonguaranteed - Public Debt for Private Purpose: $50,000 ($0.28)
Ontario government finances - Cash and Securities in 2021 (per resident):
Bond Funds - Cash and Securities: $243,685,000 ($1360.90)
Other Funds - Cash and Securities: $299,253,000 ($1671.23)
Sinking Funds - Cash and Securities: $60,628,000 ($338.59)
6.45% of this county's 2021 resident taxpayers lived in other counties in 2020 ($54,954 average adjusted gross income )
Here:
6.45%California average:
5.19%
0.03% of residents moved from foreign countries ($259 average AGI )San Bernardino County:
0.03%California average:
0.03%
Top counties from which taxpayers relocated into this county between 2020 and 2021:
6.46% of this county's 2020 resident taxpayers moved to other counties in 2021 ($59,647 average adjusted gross income )
Here:
6.46%California average:
6.14%
0.03% of residents moved to foreign countries ($253 average AGI )San Bernardino County:
0.03%California average:
0.02%
Top counties to which taxpayers relocated from this county between 2020 and 2021:
Businesses in Ontario, CA
Name Count Name Count
24 Hour Fitness 1 KFC 3 7-Eleven 8 Kincaid 1 99 Cents Only Stores 1 Kmart 2 ALDO 1 Knights Inn 1 AT&T 1 Kohl's 1 Aeropostale 1 Kroger 3 Albertsons 2 La Quinta 1 American Eagle Outfitters 1 La-Z-Boy 1 Ann Taylor 1 Lane Furniture 1 Applebee's 1 LensCrafters 1 Arby's 2 Levi Strauss & Co. 1 AutoZone 5 Little Caesars Pizza 5 Avenue 1 Lowe's 1 BMW 1 Marriott 2 Baja Fresh Mexican Grill 1 Marshalls 1 Bakers 1 MasterBrand Cabinets 2 Banana Republic 1 Mazda 1 Baskin-Robbins 2 McDonald's 6 Bath & Body Works 1 Motel 6 2 Bed Bath & Beyond 1 Motherhood Maternity 1 Best Western 2 New Balance 2 Big O Tires 1 Nike 9 Blockbuster 1 Nissan 1 Budget Car Rental 1 Nordstrom 1 Burger King 7 Office Depot 1 Burlington Coat Factory 1 Old Navy 1 CVS 2 Olive Garden 1 CarMax 1 Outback 1 Carl\s Jr. 8 Outback Steakhouse 1 Casual Male XL 1 Pac Sun 1 Charlotte Russe 1 Panda Express 2 Chevrolet 1 Papa John's Pizza 1 Chick-Fil-A 1 Payless 1 Church's Chicken 1 Penske 1 Cinnabon 1 PetSmart 1 Circle K 4 Pizza Hut 3 Clarks 1 Popeyes 2 Cold Stone Creamery 2 Qdoba Mexican Grill 1 Curves 1 Quality 1 DHL 1 Quiznos 2 Dairy Queen 1 RadioShack 2 Days Inn 1 Ramada 1 Decora Cabinetry 1 Red Lobster 1 Dennys 4 Red Roof Inn 1 Discount Tire 1 Rite Aid 4 Domino's Pizza 2 Rodeway Inn 1 DressBarn 1 Sam's Club 1 Econo Lodge 1 Sears 4 El Pollo Loco 4 Sheraton 1 Extended Stay America 1 Skechers USA 1 Famous Footwear 1 Spencer Gifts 1 FedEx 12 Sprint Nextel 3 Finish Line 1 Staples 1 Foot Locker 1 Starbucks 9 Forever 21 1 Subaru 1 Fredericks Of Hollywood 1 Subway 7 GNC 2 Super 8 1 GameStop 1 T-Mobile 6 Gap 1 T.G.I. Driday's 2 Gymboree 1 Taco Bell 5 H&M 1 Target 1 H&R Block 5 The Room Place 1 Haagen-Dazs 1 Torrid 1 Hilton 3 Toyota 1 Holiday Inn 2 Toys"R"Us 2 Home Depot 1 U-Haul 5 Honda 1 UPS 22 Hot Topic 1 Vans 6 IHOP 2 Verizon Wireless 2 J.Crew 1 Victoria's Secret 1 JCPenney 1 Volkswagen 1 Jack In The Box 11 Walgreens 2 Jamba Juice 1 Wendy's 3 Journeys 1 Wet Seal 1 Justice 1 YMCA 1
Strongest AM radio stations in Ontario:
KPLS (830 AM; 50 kW; ORANGE, CA; Owner: CRN LICENSES, LLC)
KSPA (1510 AM; 10 kW; ONTARIO, CA; Owner: ONTARIO BROADCASTING, LLC)
KLAC (570 AM; 50 kW; LOS ANGELES, CA; Owner: AMFM RADIO LICENSES, L.L.C.)
KTNQ (1020 AM; 50 kW; LOS ANGELES, CA; Owner: KTNQ-AM LICENSE CORP.)
KFI (640 AM; 50 kW; LOS ANGELES, CA; Owner: CAPSTAR TX LIMITED PARTNERSHIP)
KXTA (1150 AM; 50 kW; LOS ANGELES, CA; Owner: CITICASTERS LICENSES, L.P.)
KDIS (1110 AM; 50 kW; PASADENA, CA; Owner: ABC,INC.)
KMNY (1600 AM; 5 kW; POMONA, CA; Owner: MULTICULTURAL RADIO BROADCASTING, INC.)
KFWB (980 AM; 50 kW; LOS ANGELES, CA; Owner: INFINITY BROADCASTING OPERATIONS, INC.)
KMPC (1540 AM; 50 kW; LOS ANGELES, CA; Owner: ROSE CITY RADIO CORPORATION)
KSPN (710 AM; 50 kW; LOS ANGELES, CA; Owner: KABC-AM RADIO, INC.)
KBLA (1580 AM; 50 kW; SANTA MONICA, CA)
KNX (1070 AM; 50 kW; LOS ANGELES, CA; Owner: INFINITY BROADCASTING OPERATIONS, INC.)
Strongest FM radio stations in Ontario:
K264AF (100.7 FM; GUASTI, CA; Owner: EDUCATIONAL MEDIA FOUNDATION)
K295AI (106.9 FM; MUSCOY, CA; Owner: ASSOCIATION FOR COMMUNITY EDUCATION, INC.)
KCBS-FM (93.1 FM; LOS ANGELES, CA; Owner: INFINITY BROADCASTING OPERATIONS, INC.)
KSCA (101.9 FM; GLENDALE, CA; Owner: HBC LICENSE CORPORATION)
KLOS (95.5 FM; LOS ANGELES, CA; Owner: KLOS-FM RADIO, INC.)
K212FA (90.3 FM; TEMPLE CITY, CA; Owner: EDUCATIONAL MEDIA FOUNDATION)
KOST (103.5 FM; LOS ANGELES, CA; Owner: CAPSTAR TX LIMITED PARTNERSHIP)
KRCV (98.3 FM; WEST COVINA, CA; Owner: HBC LICENSE CORPORATION)
KIIS-FM (102.7 FM; LOS ANGELES, CA; Owner: CITICASTERS LICENSES, L.P.)
KLVE (107.5 FM; LOS ANGELES, CA; Owner: KLVE-FM LICENSE CORP.)
KUOR-FM (89.1 FM; REDLANDS, CA; Owner: UNIVERSITY OF REDLANDS)
KPCC (89.3 FM; PASADENA, CA; Owner: PASADENA AREA COMMUNITY COLLEGE DISTRICT)
KHHT (92.3 FM; LOS ANGELES, CA; Owner: AMFM RADIO LICENSES, L.L.C.)
KBIG-FM (104.3 FM; LOS ANGELES, CA; Owner: AMFM RADIO LICENSES, L.L.C.)
KMZT-FM (105.1 FM; LOS ANGELES, CA; Owner: MOUNT WILSON FM BROADCASTERS, INC.)
KTWV (94.7 FM; LOS ANGELES, CA; Owner: INFINITY BROADCASTING OPERATIONS, INC.)
KPFK (90.7 FM; LOS ANGELES, CA; Owner: PACIFICA FOUNDATION, INC)
K216EM (91.1 FM; ARCADIA, CA; Owner: LIFE ON THE WAY COMMUNICATIONS, INC.)
KOLA (99.9 FM; SAN BERNARDINO, CA; Owner: INLAND EMPIRE BROADCASTING CORP.)
KZLA-FM (93.9 FM; LOS ANGELES, CA; Owner: EMMIS RADIO LICENSE CORPORATION)
TV broadcast stations around Ontario:
KTRO-LP (Channel 50; LANCASTER, CA; Owner: ROBERT D. ADELMAN)
KHIZ (Channel 64; BARSTOW, CA; Owner: SUNBELT TELEVISION, INC.)
KCBS-TV (Channel 2; LOS ANGELES, CA; Owner: CBS BROADCASTING INC.)
KRCA (Channel 62; RIVERSIDE, CA; Owner: KRCA LICENSE CORP.)
KPXN (Channel 30; SAN BERNARDINO, CA; Owner: PAXSON LOS ANGELES LICENSE, INC.)
KTLA-TV (Channel 5; LOS ANGELES, CA; Owner: KTLA INC.)
KABC-TV (Channel 7; LOS ANGELES, CA; Owner: ABC HOLDING COMPANY, INC.)
KCAL-TV (Channel 9; LOS ANGELES, CA; Owner: VIACOM TELEVISION STATIONS GROUP OF LOS ANGELES LLC)
KNBC (Channel 4; LOS ANGELES, CA; Owner: NBC SUBSIDIARY (KNBC-TV), INC.)
KVCR-TV (Channel 24; SAN BERNARDINO, CA; Owner: SAN BERNARDINO COMMUNITY COLLEGE DISTRICT)
National Bridge Inventory (NBI) Statistics 156 Number of bridges1,709ft / 521m Total length $1,897,000 Total costs11,238,700 Total average daily traffic1,092,420 Total average daily truck traffic
New bridges - historical statistics
1 1910-1919 1 1920-1929 2 1930-1939 3 1940-1949 12 1950-1959 8 1960-1969 87 1970-1979 23 1980-1989 10 1990-1999 2 2000-2009 7 2010-2019
See full National Bridge Inventory statistics for Ontario, CA
Home Mortgage Disclosure Act Aggregated Statistics For Year 2009(Based on 14 full and 5 partial tracts) A) FHA, FSA/RHS & VA B) Conventional C) Refinancings D) Home Improvement Loans E) Loans on Dwellings For 5+ Families F) Non-occupant Loans on G) Loans On Manufactured Number Average Value Number Average Value Number Average Value Number Average Value Number Average Value Number Average Value Number Average Value
LOANS ORIGINATED 1,019 $225,288 513 $185,944 1,233 $213,213 60 $132,374 11 $2,559,281 156 $163,551 11 $42,021 APPLICATIONS APPROVED, NOT ACCEPTED 101 $232,639 100 $195,498 202 $217,827 32 $41,973 0 $0 35 $171,474 4 $40,558 APPLICATIONS DENIED 187 $229,145 169 $175,585 689 $228,131 88 $78,513 0 $0 107 $151,758 24 $64,809 APPLICATIONS WITHDRAWN 208 $215,680 94 $193,238 365 $220,111 18 $117,601 1 $210,620 41 $159,963 1 $33,430 FILES CLOSED FOR INCOMPLETENESS 57 $202,468 36 $203,245 117 $240,939 10 $135,879 0 $0 17 $167,044 0 $0
Aggregated Statistics For Year 2008(Based on 14 full and 5 partial tracts) A) FHA, FSA/RHS & VA B) Conventional C) Refinancings D) Home Improvement Loans E) Loans on Dwellings For 5+ Families F) Non-occupant Loans on G) Loans On Manufactured Number Average Value Number Average Value Number Average Value Number Average Value Number Average Value Number Average Value Number Average Value
LOANS ORIGINATED 587 $266,079 654 $233,260 1,142 $229,387 166 $105,953 11 $4,721,534 238 $191,604 32 $51,756 APPLICATIONS APPROVED, NOT ACCEPTED 49 $250,167 191 $232,873 413 $256,372 51 $101,642 0 $0 54 $217,513 42 $66,618 APPLICATIONS DENIED 131 $277,354 327 $238,923 1,449 $279,088 232 $90,504 6 $528,833 148 $230,205 42 $64,574 APPLICATIONS WITHDRAWN 104 $272,416 183 $232,801 446 $264,240 49 $126,358 1 $800,000 62 $207,506 1 $58,300 FILES CLOSED FOR INCOMPLETENESS 22 $283,370 68 $254,499 148 $281,157 15 $139,247 0 $0 21 $242,334 0 $0
Aggregated Statistics For Year 2007(Based on 14 full and 5 partial tracts) A) FHA, FSA/RHS & VA B) Conventional C) Refinancings D) Home Improvement Loans E) Loans on Dwellings For 5+ Families F) Non-occupant Loans on G) Loans On Manufactured Number Average Value Number Average Value Number Average Value Number Average Value Number Average Value Number Average Value Number Average Value
LOANS ORIGINATED 22 $287,132 1,610 $261,798 3,590 $272,106 558 $172,866 24 $2,646,572 404 $265,080 56 $63,078 APPLICATIONS APPROVED, NOT ACCEPTED 1 $337,000 574 $253,732 1,118 $286,395 146 $149,208 2 $325,000 111 $280,265 62 $69,375 APPLICATIONS DENIED 5 $255,838 969 $280,742 2,874 $304,610 476 $163,149 3 $636,667 273 $301,387 57 $74,555 APPLICATIONS WITHDRAWN 4 $224,258 370 $277,452 1,124 $289,252 148 $198,143 0 $0 106 $314,443 4 $74,750 FILES CLOSED FOR INCOMPLETENESS 0 $0 114 $279,363 466 $306,546 33 $184,629 0 $0 28 $268,357 1 $2,520
Aggregated Statistics For Year 2006(Based on 14 full and 5 partial tracts) A) FHA, FSA/RHS & VA B) Conventional C) Refinancings D) Home Improvement Loans E) Loans on Dwellings For 5+ Families F) Non-occupant Loans on G) Loans On Manufactured Number Average Value Number Average Value Number Average Value Number Average Value Number Average Value Number Average Value Number Average Value
LOANS ORIGINATED 9 $246,873 3,532 $230,598 5,862 $273,361 930 $176,807 31 $1,314,684 705 $257,123 38 $53,128 APPLICATIONS APPROVED, NOT ACCEPTED 2 $84,500 794 $219,615 1,305 $275,169 164 $147,691 0 $0 169 $256,089 76 $57,008 APPLICATIONS DENIED 1 $96,000 1,557 $236,056 2,899 $296,129 602 $156,838 1 $540,000 281 $279,874 39 $71,394 APPLICATIONS WITHDRAWN 3 $214,683 810 $243,696 1,991 $285,832 238 $190,993 2 $321,000 173 $269,918 1 $235,010 FILES CLOSED FOR INCOMPLETENESS 0 $0 163 $239,144 462 $300,532 45 $192,148 1 $250,000 28 $292,244 0 $0
Aggregated Statistics For Year 2005(Based on 14 full and 5 partial tracts) A) FHA, FSA/RHS & VA B) Conventional C) Refinancings D) Home Improvement Loans E) Loans on Dwellings For 5+ Families F) Non-occupant Loans on G) Loans On Manufactured Number Average Value Number Average Value Number Average Value Number Average Value Number Average Value Number Average Value Number Average Value
LOANS ORIGINATED 14 $216,494 4,240 $226,183 7,130 $243,245 968 $162,331 46 $1,242,849 883 $245,278 31 $70,342 APPLICATIONS APPROVED, NOT ACCEPTED 3 $218,737 928 $211,751 1,331 $232,554 169 $146,466 2 $741,945 183 $243,811 92 $64,775 APPLICATIONS DENIED 4 $235,490 1,584 $214,782 2,853 $252,065 647 $124,110 4 $1,188,000 299 $240,702 93 $73,654 APPLICATIONS WITHDRAWN 6 $243,568 978 $229,344 2,275 $247,396 334 $177,224 7 $842,199 194 $256,684 19 $130,742 FILES CLOSED FOR INCOMPLETENESS 0 $0 197 $231,774 754 $247,116 60 $137,803 1 $1,860,000 43 $220,793 6 $119,000
Aggregated Statistics For Year 2004(Based on 14 full and 5 partial tracts) A) FHA, FSA/RHS & VA B) Conventional C) Refinancings D) Home Improvement Loans E) Loans on Dwellings For 5+ Families F) Non-occupant Loans on G) Loans On Manufactured Number Average Value Number Average Value Number Average Value Number Average Value Number Average Value Number Average Value Number Average Value
LOANS ORIGINATED 63 $200,388 3,900 $193,773 7,630 $198,381 869 $131,973 44 $1,562,546 807 $191,065 47 $58,550 APPLICATIONS APPROVED, NOT ACCEPTED 16 $196,781 898 $193,670 1,536 $193,472 171 $115,304 0 $0 177 $184,189 80 $55,609 APPLICATIONS DENIED 18 $183,238 1,083 $189,477 3,105 $195,031 574 $102,134 5 $336,228 247 $189,616 76 $60,718 APPLICATIONS WITHDRAWN 28 $185,833 689 $196,809 2,370 $191,046 266 $125,522 6 $1,978,333 132 $186,719 14 $92,679 FILES CLOSED FOR INCOMPLETENESS 2 $311,680 155 $218,217 564 $201,670 56 $92,797 0 $0 30 $174,517 0 $0
Aggregated Statistics For Year 2003(Based on 14 full and 5 partial tracts) A) FHA, FSA/RHS & VA B) Conventional C) Refinancings D) Home Improvement Loans E) Loans on Dwellings For 5+ Families F) Non-occupant Loans on Number Average Value Number Average Value Number Average Value Number Average Value Number Average Value Number Average Value
LOANS ORIGINATED 279 $162,215 2,900 $157,651 10,398 $155,876 360 $53,188 37 $1,298,316 844 $143,194 APPLICATIONS APPROVED, NOT ACCEPTED 21 $159,315 500 $160,459 1,655 $156,450 89 $48,261 1 $510,000 150 $155,261 APPLICATIONS DENIED 50 $158,220 827 $148,392 2,980 $151,441 368 $44,159 6 $2,132,500 254 $150,183 APPLICATIONS WITHDRAWN 40 $172,024 432 $164,866 2,627 $158,670 97 $58,690 3 $1,737,667 123 $137,128 FILES CLOSED FOR INCOMPLETENESS 26 $166,198 140 $174,630 541 $155,467 26 $37,718 0 $0 38 $139,148
Aggregated Statistics For Year 2002(Based on 13 full and 3 partial tracts) A) FHA, FSA/RHS & VA B) Conventional C) Refinancings D) Home Improvement Loans E) Loans on Dwellings For 5+ Families F) Non-occupant Loans on Number Average Value Number Average Value Number Average Value Number Average Value Number Average Value Number Average Value
LOANS ORIGINATED 572 $144,297 2,034 $140,944 5,525 $139,628 302 $32,348 36 $748,059 463 $119,800 APPLICATIONS APPROVED, NOT ACCEPTED 49 $127,316 342 $133,972 1,003 $137,189 89 $29,373 1 $490,000 86 $114,236 APPLICATIONS DENIED 102 $148,373 503 $118,019 1,926 $132,021 371 $22,288 5 $461,800 104 $125,231 APPLICATIONS WITHDRAWN 105 $141,847 266 $143,659 1,429 $143,328 107 $41,559 1 $250,000 73 $121,341 FILES CLOSED FOR INCOMPLETENESS 26 $142,571 117 $140,266 508 $144,224 4 $28,512 2 $4,012,500 27 $126,193
Aggregated Statistics For Year 2001(Based on 13 full and 3 partial tracts) A) FHA, FSA/RHS & VA B) Conventional C) Refinancings D) Home Improvement Loans E) Loans on Dwellings For 5+ Families F) Non-occupant Loans on Number Average Value Number Average Value Number Average Value Number Average Value Number Average Value Number Average Value
LOANS ORIGINATED 964 $135,480 1,424 $125,632 3,850 $128,898 202 $28,129 25 $1,922,299 384 $120,298 APPLICATIONS APPROVED, NOT ACCEPTED 47 $139,418 248 $116,836 590 $121,315 52 $24,879 0 $0 63 $111,917 APPLICATIONS DENIED 107 $140,698 505 $98,946 1,793 $116,510 321 $20,931 6 $941,833 119 $108,800 APPLICATIONS WITHDRAWN 88 $137,916 212 $119,123 1,277 $128,090 130 $31,853 3 $848,333 74 $120,201 FILES CLOSED FOR INCOMPLETENESS 17 $137,989 53 $123,663 302 $126,010 9 $51,168 5 $1,443,800 18 $103,788
Aggregated Statistics For Year 2000(Based on 13 full and 3 partial tracts) A) FHA, FSA/RHS & VA B) Conventional C) Refinancings D) Home Improvement Loans E) Loans on Dwellings For 5+ Families F) Non-occupant Loans on Number Average Value Number Average Value Number Average Value Number Average Value Number Average Value Number Average Value
LOANS ORIGINATED 1,011 $126,709 1,172 $114,825 914 $99,136 236 $27,034 15 $765,394 159 $94,785 APPLICATIONS APPROVED, NOT ACCEPTED 76 $118,838 187 $111,059 201 $100,271 178 $26,298 0 $0 33 $102,049 APPLICATIONS DENIED 140 $127,494 561 $87,279 986 $87,425 337 $25,606 10 $1,250,826 65 $87,001 APPLICATIONS WITHDRAWN 135 $127,051 280 $116,344 406 $85,600 48 $23,162 1 $2,555,000 26 $101,624 FILES CLOSED FOR INCOMPLETENESS 53 $127,795 58 $126,372 177 $119,164 12 $30,689 4 $1,454,000 13 $104,529
Aggregated Statistics For Year 1999(Based on 13 full and 5 partial tracts) A) FHA, FSA/RHS & VA B) Conventional C) Refinancings D) Home Improvement Loans E) Loans on Dwellings For 5+ Families F) Non-occupant Loans on Number Average Value Number Average Value Number Average Value Number Average Value Number Average Value Number Average Value
LOANS ORIGINATED 1,251 $118,025 1,130 $123,006 1,970 $101,657 288 $27,625 35 $313,338 284 $94,554 APPLICATIONS APPROVED, NOT ACCEPTED 57 $115,935 189 $119,668 449 $98,106 192 $25,511 5 $118,974 42 $90,470 APPLICATIONS DENIED 160 $119,319 451 $87,799 1,328 $110,469 395 $21,162 13 $298,428 80 $99,658 APPLICATIONS WITHDRAWN 156 $117,466 221 $112,759 656 $98,735 38 $29,081 14 $192,084 58 $105,645 FILES CLOSED FOR INCOMPLETENESS 27 $117,078 47 $120,405 281 $106,114 9 $26,622 3 $2,550,947 23 $86,364
Detailed mortgage data for all 19 tracts in Ontario, CA
Private Mortgage Insurance Companies Aggregated Statistics For Year 2009(Based on 14 full and 4 partial tracts) A) Conventional B) Refinancings C) Non-occupant Loans on Number Average Value Number Average Value Number Average Value
LOANS ORIGINATED 71 $232,294 15 $257,164 0 $0 APPLICATIONS APPROVED, NOT ACCEPTED 46 $231,312 9 $265,887 1 $225,000 APPLICATIONS DENIED 12 $226,410 4 $252,145 0 $0 APPLICATIONS WITHDRAWN 6 $283,458 1 $287,870 0 $0 FILES CLOSED FOR INCOMPLETENESS 6 $228,768 1 $289,770 1 $121,000
Aggregated Statistics For Year 2008(Based on 14 full and 5 partial tracts) A) Conventional B) Refinancings C) Non-occupant Loans on Number Average Value Number Average Value Number Average Value
LOANS ORIGINATED 246 $284,495 79 $328,779 5 $259,446 APPLICATIONS APPROVED, NOT ACCEPTED 191 $328,883 168 $357,864 7 $339,706 APPLICATIONS DENIED 45 $256,363 37 $323,855 22 $299,836 APPLICATIONS WITHDRAWN 29 $282,621 10 $377,192 1 $200,000 FILES CLOSED FOR INCOMPLETENESS 8 $277,262 6 $349,770 5 $369,210
Aggregated Statistics For Year 2007(Based on 14 full and 5 partial tracts) A) Conventional B) Refinancings C) Non-occupant Loans on Number Average Value Number Average Value Number Average Value
LOANS ORIGINATED 206 $354,651 183 $377,772 9 $347,919 APPLICATIONS APPROVED, NOT ACCEPTED 35 $378,531 68 $402,260 1 $355,000 APPLICATIONS DENIED 10 $379,250 19 $436,647 5 $453,378 APPLICATIONS WITHDRAWN 14 $351,467 29 $376,680 3 $194,970 FILES CLOSED FOR INCOMPLETENESS 0 $0 1 $487,640 0 $0
Aggregated Statistics For Year 2006(Based on 14 full and 4 partial tracts) A) Conventional B) Refinancings C) Non-occupant Loans on Number Average Value Number Average Value Number Average Value
LOANS ORIGINATED 47 $382,693 80 $364,066 6 $322,650 APPLICATIONS APPROVED, NOT ACCEPTED 16 $355,021 26 $347,462 4 $349,152 APPLICATIONS DENIED 8 $429,348 6 $397,683 0 $0 APPLICATIONS WITHDRAWN 6 $394,337 13 $373,652 0 $0 FILES CLOSED FOR INCOMPLETENESS 0 $0 2 $378,500 0 $0
Aggregated Statistics For Year 2005(Based on 14 full and 5 partial tracts) A) Conventional B) Refinancings C) Non-occupant Loans on D) Loans On Manufactured Number Average Value Number Average Value Number Average Value Number Average Value
LOANS ORIGINATED 93 $319,151 108 $310,584 11 $342,738 1 $197,360 APPLICATIONS APPROVED, NOT ACCEPTED 30 $299,639 36 $275,754 1 $194,890 0 $0 APPLICATIONS DENIED 5 $316,474 4 $348,415 3 $256,463 0 $0 APPLICATIONS WITHDRAWN 7 $283,469 14 $304,888 2 $291,915 0 $0 FILES CLOSED FOR INCOMPLETENESS 1 $228,000 2 $240,495 0 $0 0 $0
Aggregated Statistics For Year 2004(Based on 14 full and 5 partial tracts) A) Conventional B) Refinancings C) Non-occupant Loans on D) Loans On Manufactured Number Average Value Number Average Value Number Average Value Number Average Value
LOANS ORIGINATED 206 $239,222 143 $227,445 23 $202,284 1 $68,000 APPLICATIONS APPROVED, NOT ACCEPTED 74 $224,724 91 $213,563 10 $200,172 0 $0 APPLICATIONS DENIED 6 $284,063 3 $216,333 1 $261,000 0 $0 APPLICATIONS WITHDRAWN 21 $247,739 14 $231,656 3 $241,790 0 $0 FILES CLOSED FOR INCOMPLETENESS 3 $283,910 6 $236,667 0 $0 0 $0
Aggregated Statistics For Year 2003(Based on 14 full and 5 partial tracts) A) Conventional B) Refinancings C) Non-occupant Loans on Number Average Value Number Average Value Number Average Value
LOANS ORIGINATED 519 $204,022 531 $183,597 43 $168,036 APPLICATIONS APPROVED, NOT ACCEPTED 119 $190,667 184 $183,916 11 $182,114 APPLICATIONS DENIED 17 $199,119 11 $195,345 5 $212,526 APPLICATIONS WITHDRAWN 27 $205,595 26 $196,162 5 $186,876 FILES CLOSED FOR INCOMPLETENESS 1 $259,000 3 $167,707 0 $0
Aggregated Statistics For Year 2002(Based on 13 full and 3 partial tracts) A) Conventional B) Refinancings C) Non-occupant Loans on Number Average Value Number Average Value Number Average Value
LOANS ORIGINATED 556 $177,108 442 $174,457 35 $137,267 APPLICATIONS APPROVED, NOT ACCEPTED 103 $157,925 195 $164,018 10 $134,500 APPLICATIONS DENIED 18 $178,150 12 $180,578 4 $141,488 APPLICATIONS WITHDRAWN 34 $163,406 21 $180,086 2 $161,610 FILES CLOSED FOR INCOMPLETENESS 10 $157,676 2 $191,540 0 $0
Aggregated Statistics For Year 2001(Based on 13 full and 3 partial tracts) A) Conventional B) Refinancings C) Non-occupant Loans on Number Average Value Number Average Value Number Average Value
LOANS ORIGINATED 419 $168,550 422 $161,709 16 $132,613 APPLICATIONS APPROVED, NOT ACCEPTED 75 $152,142 113 $155,801 8 $130,801 APPLICATIONS DENIED 14 $168,646 27 $164,488 5 $156,920 APPLICATIONS WITHDRAWN 13 $158,032 12 $162,089 0 $0 FILES CLOSED FOR INCOMPLETENESS 3 $175,000 3 $164,287 0 $0
Aggregated Statistics For Year 2000(Based on 13 full and 3 partial tracts) A) Conventional B) Refinancings C) Non-occupant Loans on Number Average Value Number Average Value Number Average Value
LOANS ORIGINATED 363 $147,555 108 $138,557 25 $105,853 APPLICATIONS APPROVED, NOT ACCEPTED 54 $154,094 34 $139,858 8 $105,484 APPLICATIONS DENIED 28 $143,763 13 $169,298 8 $73,030 APPLICATIONS WITHDRAWN 11 $143,401 6 $135,762 2 $122,725 FILES CLOSED FOR INCOMPLETENESS 0 $0 2 $94,500 0 $0
Aggregated Statistics For Year 1999(Based on 13 full and 5 partial tracts) A) Conventional B) Refinancings C) Non-occupant Loans on Number Average Value Number Average Value Number Average Value
LOANS ORIGINATED 409 $151,596 306 $135,725 26 $120,743 APPLICATIONS APPROVED, NOT ACCEPTED 50 $149,997 67 $133,041 6 $136,933 APPLICATIONS DENIED 39 $159,022 13 $142,940 1 $143,300 APPLICATIONS WITHDRAWN 23 $148,113 11 $144,535 0 $0 FILES CLOSED FOR INCOMPLETENESS 7 $134,471 4 $151,580 2 $79,625
Fire-safe hotels and motels in Ontario, California:
Ontario Airport Hotel, 700 N Haven Ave, Ontario, California 91764 Phone: (909) 980-0400, Fax: (909) 948-3809
Radisson Ontario Airport, 2200 E Holt Blvd, Ontario, California 91761 Phone: (909) 986-8811, Fax: (909) 391-6151
Fairfield Inn-ontario, 3201 CTR LK Dr, Ontario, California 91761 Phone: (909) 390-9855, Fax: (909) 390-9855
Country Inn & Suites By Carlson, 231 N Vineyard Ave, Ontario, California 91764 Phone: (909) 937-6000, Fax: (909) 472-9010
Residence Inn By Marriott - Ontario Airport, 2025 Convention Center Way, Ontario, California 91764 Phone: (909) 937-6788, Fax: (909) 937-2462
Econolodge Airport S, 2301 S Euclid Ave, Ontario, California 91762 Phone: (909) 986-3556
Extended Stay America - Los Angeles - Ontario Airport, 3990 E Inland Empire Blvd, Ontario, California 91764 Phone: (909) 944-8900, Fax: (909) 944-8911
Best Western Inn & Suites, 3400 Shelby St, Ontario, California 91764 Phone: (909) 466-9600, Fax: (909) 941-1445
19 other hotels and motels
All 27 fire-safe hotels and motels in Ontario, California
Most common first names in Ontario, CA among deceased individuals Name Count Lived (average)
John 473 72.4 years Mary 410 78.2 years William 361 73.2 years Robert 355 68.0 years James 307 70.7 years Charles 261 73.1 years George 201 73.7 years Helen 198 77.8 years Frank 180 74.3 years Maria 178 75.7 years
Most common last names in Ontario, CA among deceased individuals Last name Count Lived (average)
Smith 155 74.5 years Brown 99 71.3 years Johnson 98 74.2 years Williams 92 70.4 years Hernandez 83 65.5 years Martinez 82 67.7 years Garcia 78 69.2 years Anderson 76 73.6 years Davis 74 74.4 years Miller 72 71.8 years
Ontario compared to California state average:
Unemployed percentage below state average. Hispanic race population percentage above state average. Ontario, CA compared to other similar cities:
#24 on the list of "Top 101 cities with largest percentage of females in industries: wholesale trade (population 50,000+)"
#29 on the list of "Top 101 cities with the highest percentage of family households, population 100,000+"
#32 on the list of "Top 101 cities with the least people having Doctorate degrees (population 50,000+)"
#40 on the list of "Top 101 cities with largest percentage of males in industries: transportation and warehousing (population 50,000+)"
#40 on the list of "Top 101 cities with the least people having Master's or Doctorate degrees (population 50,000+)"
#49 on the list of "Top 101 cities with largest percentage of females in occupations: material moving occupations (population 50,000+)"
#50 on the list of "Top 101 cities with largest percentage of females in occupations: production occupations (population 50,000+)"
#50 on the list of "Top 100 low-educated but high-earning cities (pop. 50,000+)"
#53 on the list of "Top 101 cities with largest percentage of males in occupations: transportation occupations (population 50,000+)"
#57 on the list of "Top 101 cities with the most cars per house, population 50,000+"
#57 on the list of "Top 100 least-educated cities (pop. 50,000+)"
#58 on the list of "Top 101 cities with largest percentage of males in occupations: farming, fishing, and forestry occupations (population 50,000+)"
#61 on the list of "Top 101 cities with largest percentage of males in occupations: installation, maintenance, and repair occupations (population 50,000+)"
#66 on the list of "Top 101 cities with largest percentage of males in occupations: material moving occupations (population 50,000+)"
#73 on the list of "Top 101 cities with the lowest percentage of English-only speaking households, population 50,000+"
#73 on the list of "Top 101 cities with the smallest percentage of elementary and middle school students in private schools (5,000+ students)"
#77 on the list of "Top 101 cities with largest percentage of males in industries: agriculture, forestry, fishing and hunting (population 50,000+)"
#82 on the list of "Top 101 cities with the lowest average snowfall in a year (population 50,000+)"
#90 on the list of "Top 101 cities with the largest city-data.com crime index decrease from 2002 to 2012 (population 50,000+)"
#92 on the list of "Top 101 cities with the highest number of auto thefts per 100,000 residents, excludes tourist destinations and others with a lot of outsiders visiting based on city industries data (population 50,000+)"
#99 (91761) on the list of "Top 101 zip codes with the most medium-big companies in 2005 (at least 100 employees)"
#5 on the list of "Top 101 counties with the highest Nitrogen Dioxide air pollution readings in 2012 (ppm)"
#5 on the list of "Top 101 counties with the highest ground withdrawal of fresh water for public supply"
#10 on the list of "Top 101 counties with the most Evangelical Protestant congregations"
#14 on the list of "Top 101 counties with the highest total withdrawal of fresh water for public supply"
#15 on the list of "Top 101 counties with the most Evangelical Protestant adherents (pop. 50,000+)"
Top Patent Applicants
Anthony Maglica (21)
Sayandro Versteylen (11)
Shou Qiang Zhu (10)
Jefferson Sabilla (9)
Stuart Williams (5)
Jay Clarke Hanan (5)
Spiros Dimitratos (5)
Wayne Russell (4)
Jose Jimenez (4)
Benny M. Osorio (4)
Total of 228 patent applications in 2008-2024.
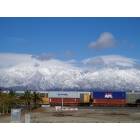
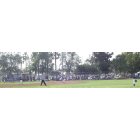
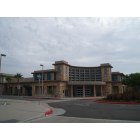
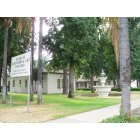
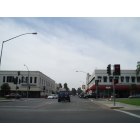
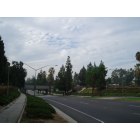
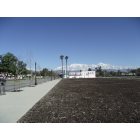

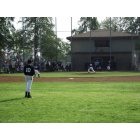
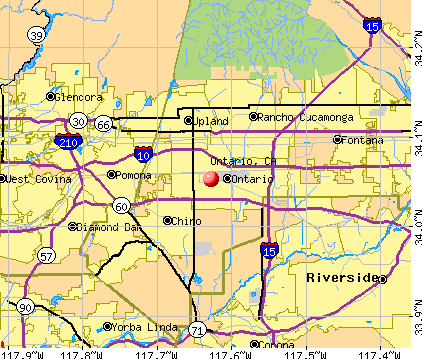


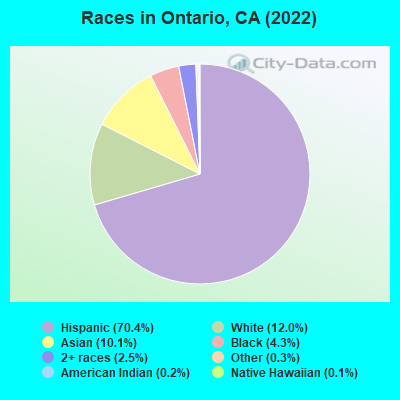
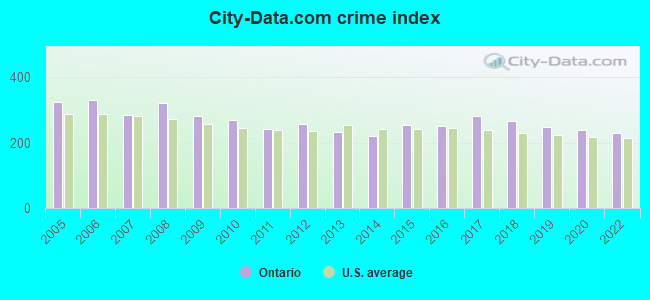
 Recent articles from our blog. Our writers, many of them Ph.D. graduates or candidates, create easy-to-read articles on a wide variety of topics.

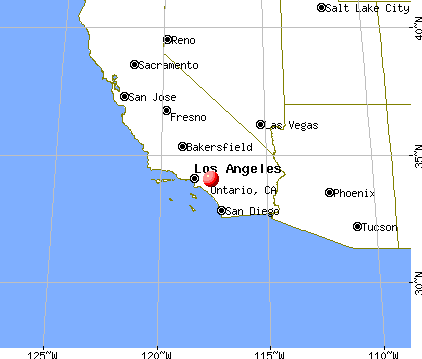
 (13.6 miles
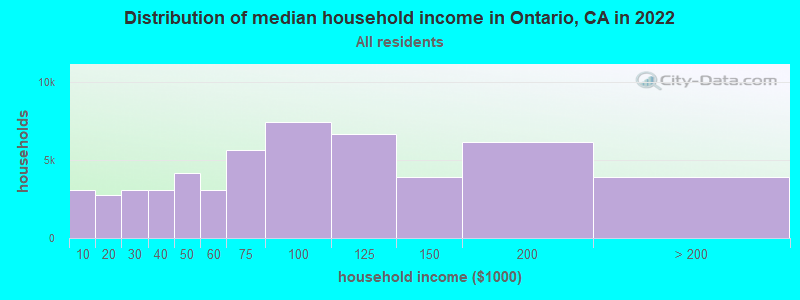
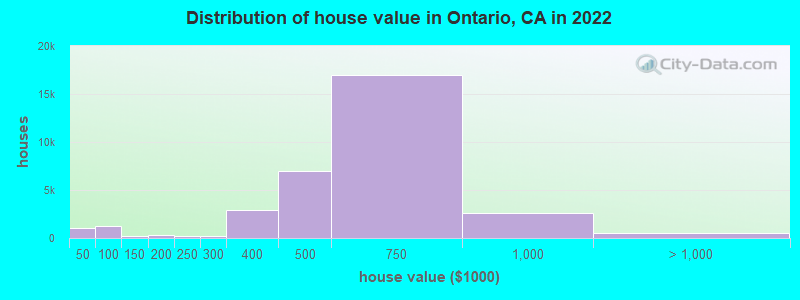

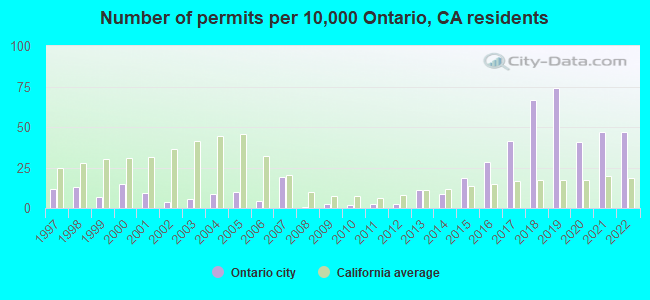
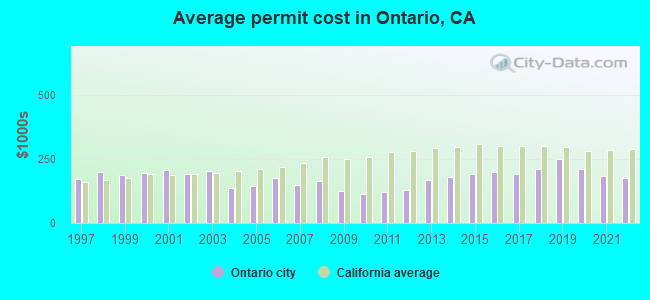
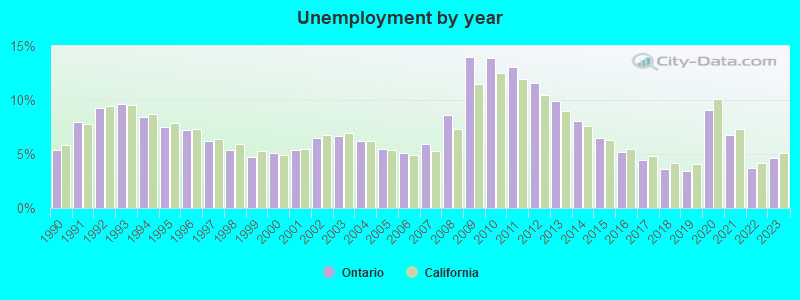
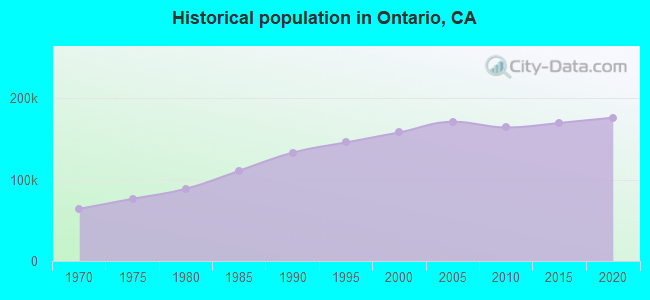
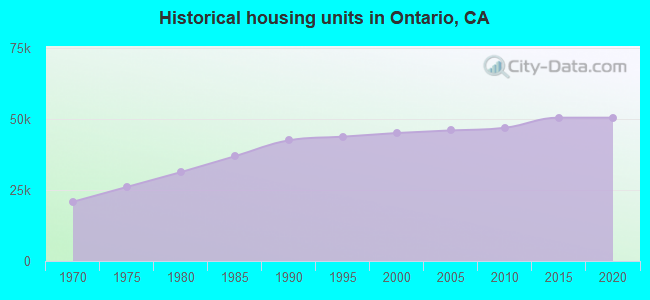
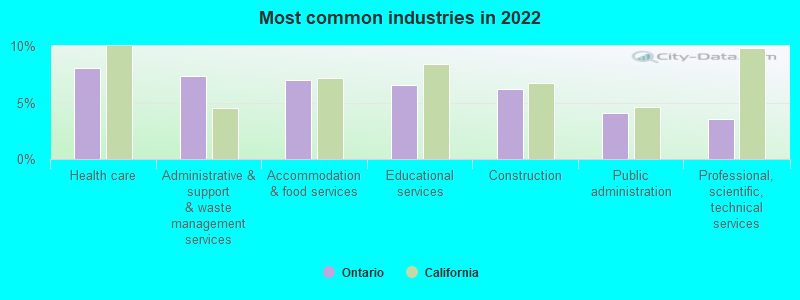
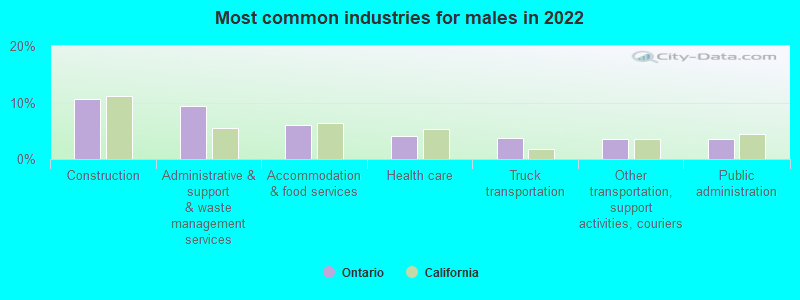
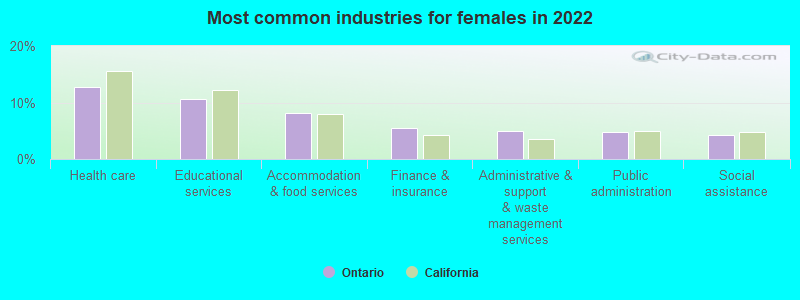
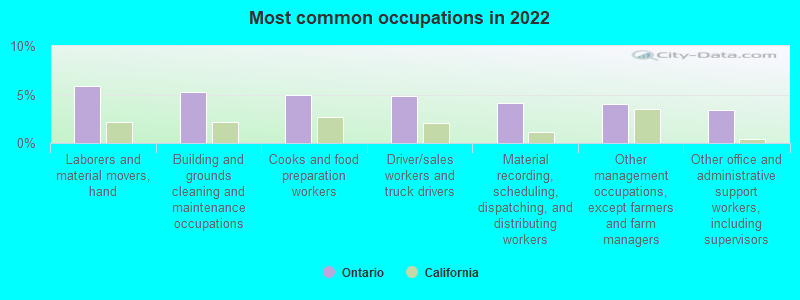
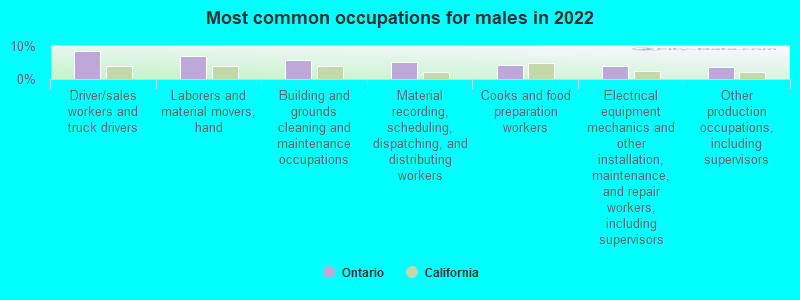
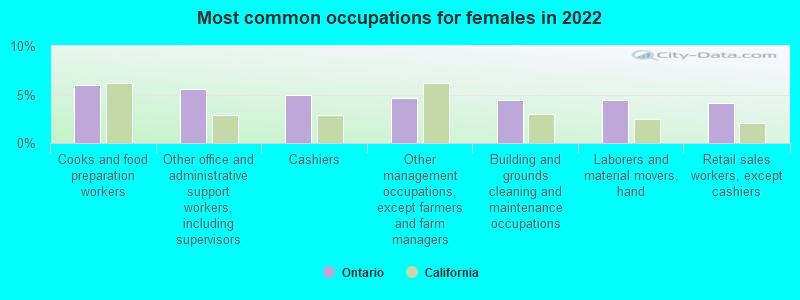
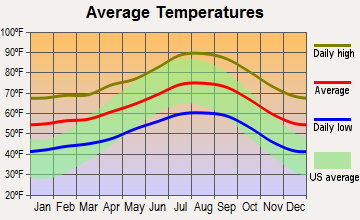


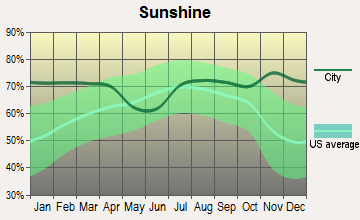

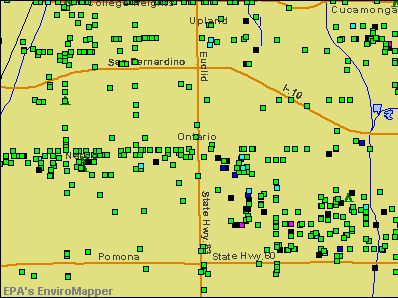

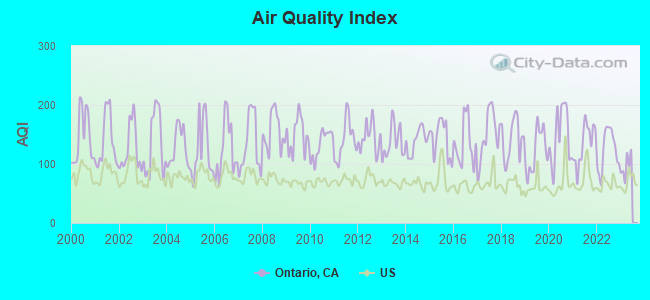
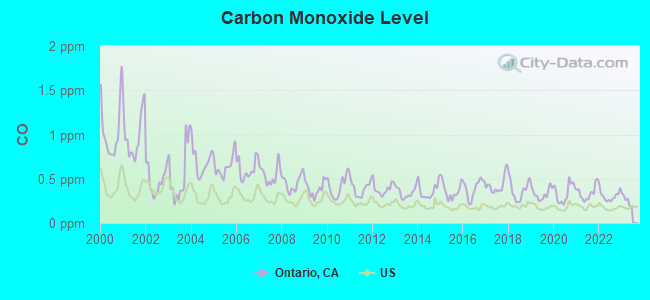
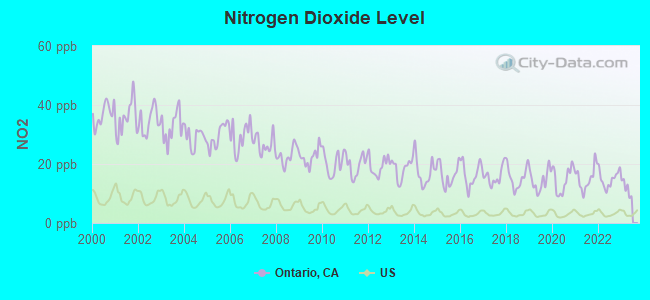
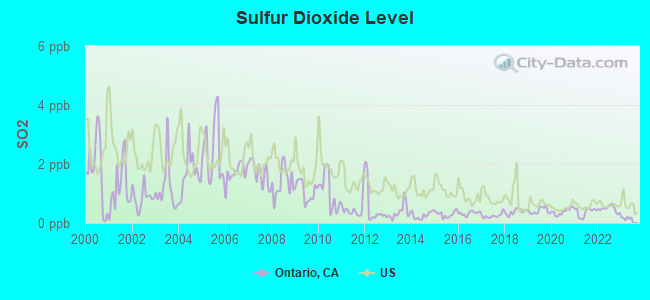
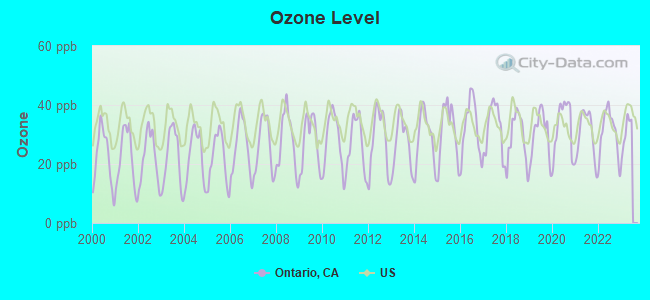
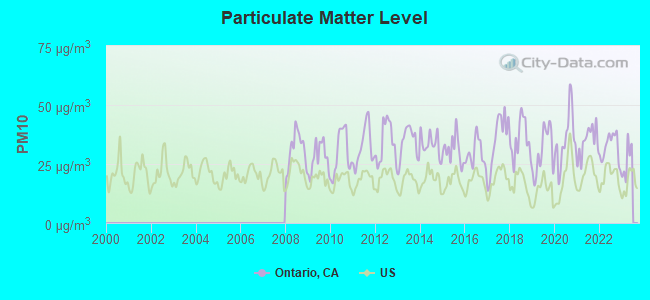
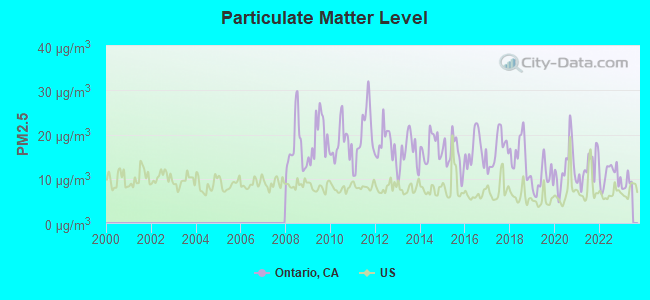
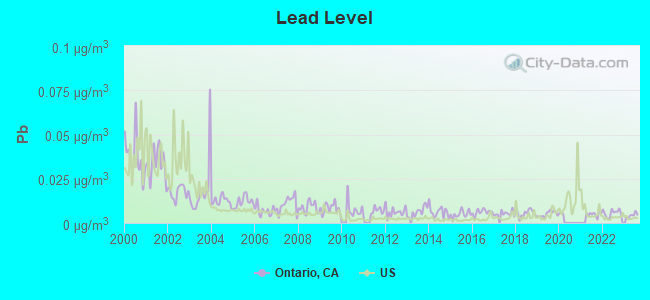
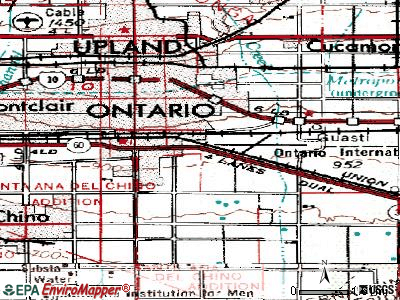
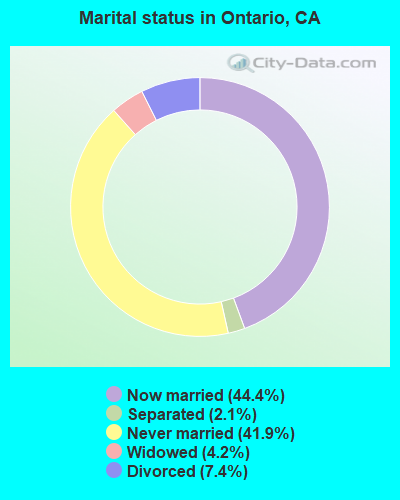
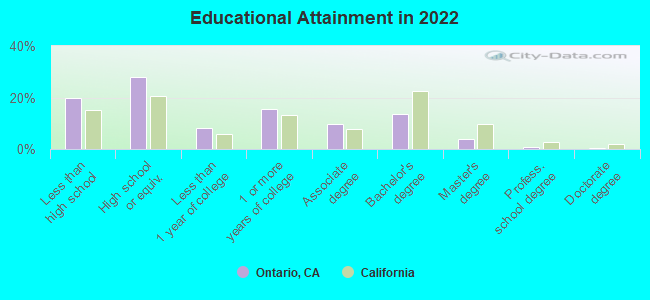
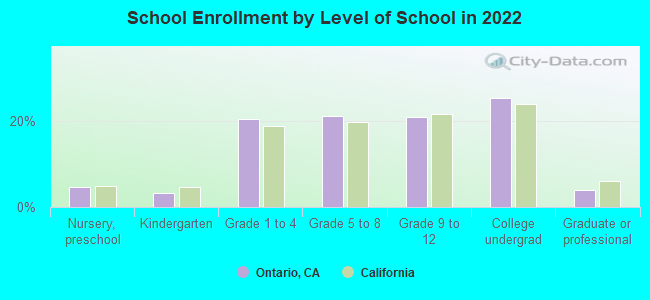
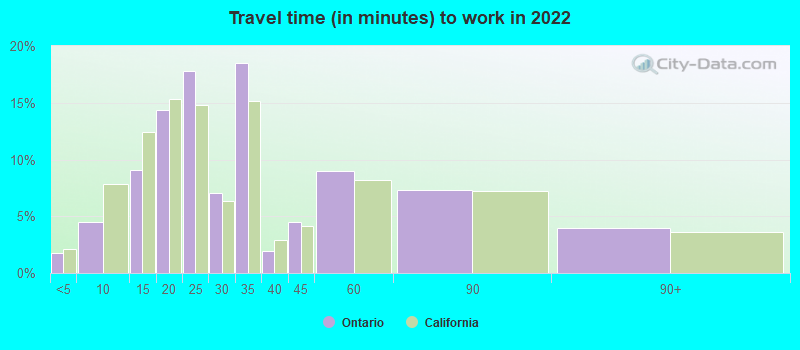
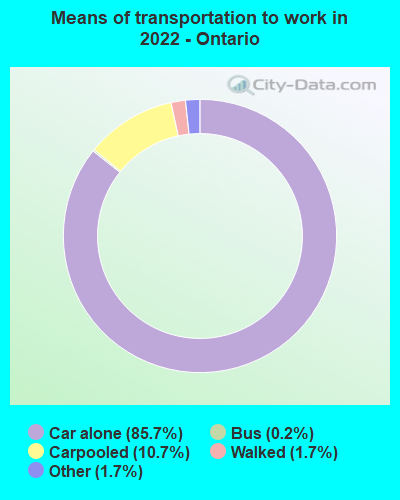
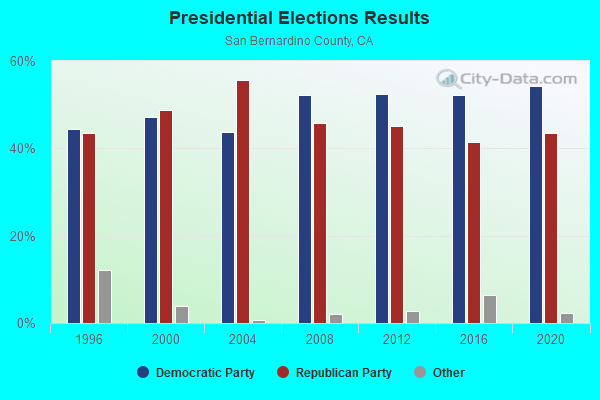
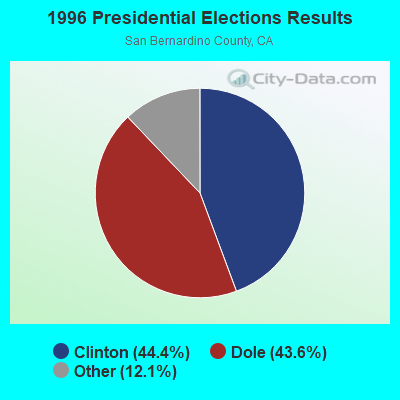
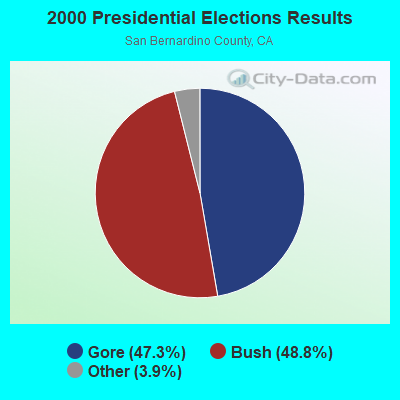
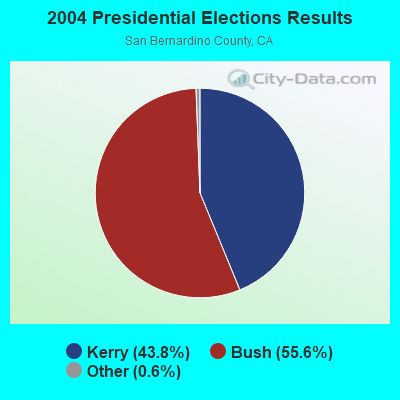
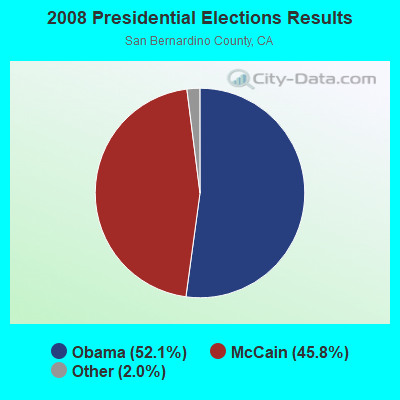
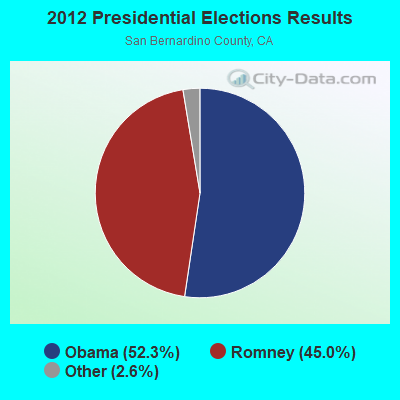
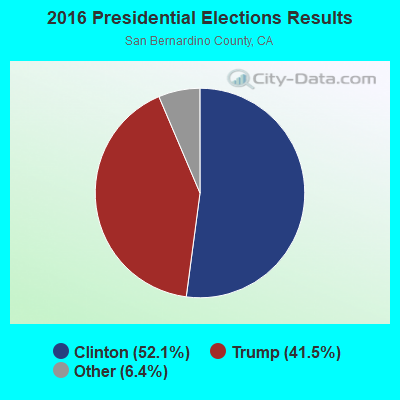
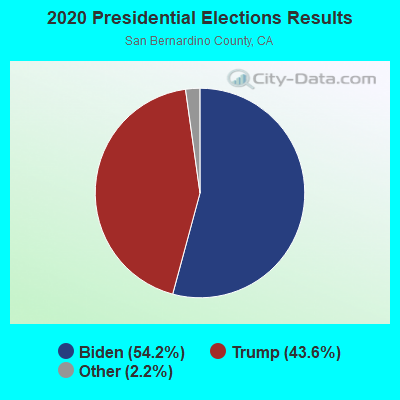
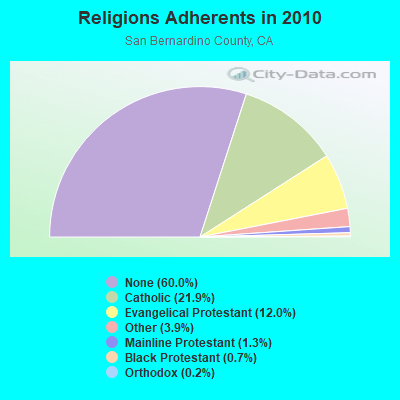
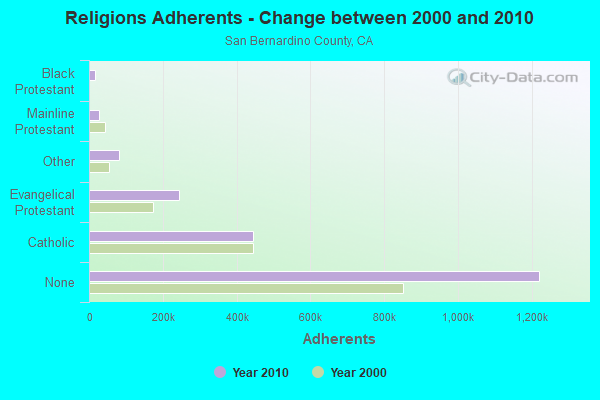
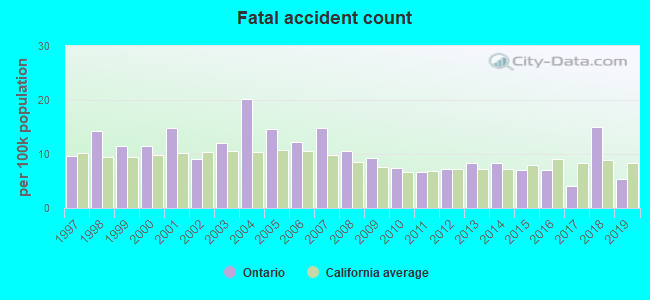
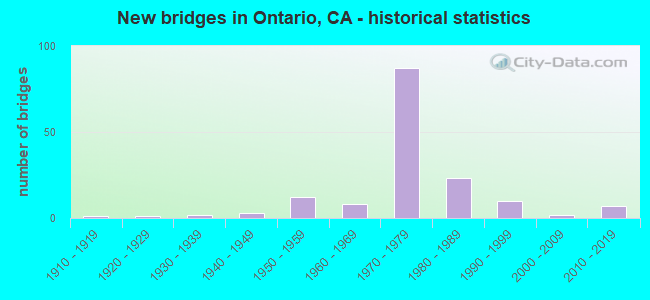
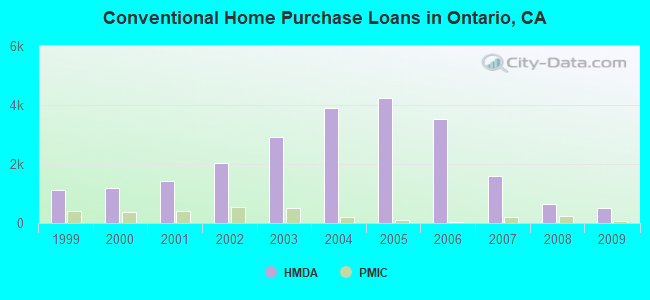
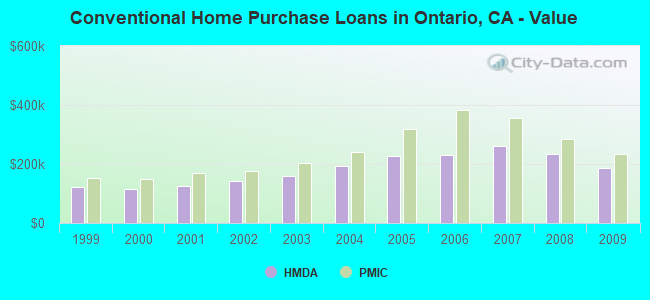
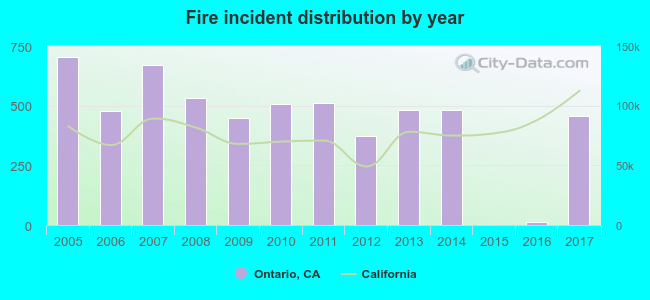 Based on the data from the years 2005 - 2017 the average number of fire incidents per year is 435. The highest number of fires - 703 took place in 2005, and the least - 2 in 2015. The data has a dropping trend.
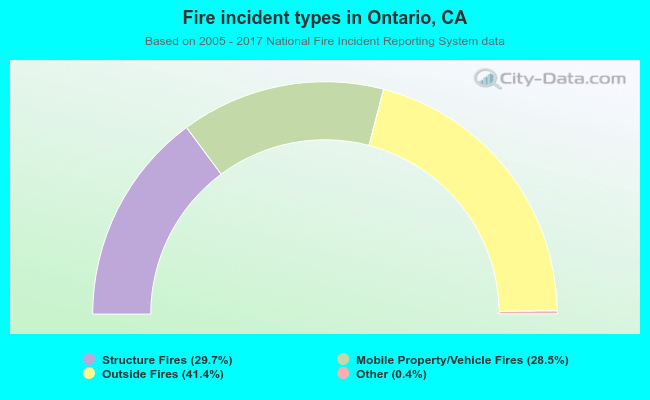 When looking into fire subcategories, the most incidents belonged to: Outside Fires (41.4%), and Structure Fires (29.7%).