Crime rate in Ontario, California (CA): murders, rapes, robberies, assaults, burglaries, thefts, auto thefts, arson, law enforcement employees, police officers, crime map
Crime rate in Ontario, CA
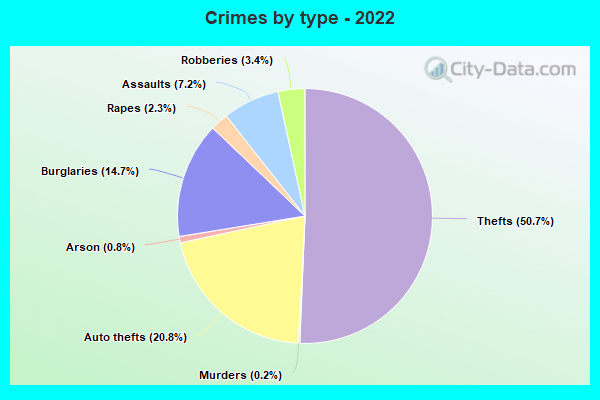
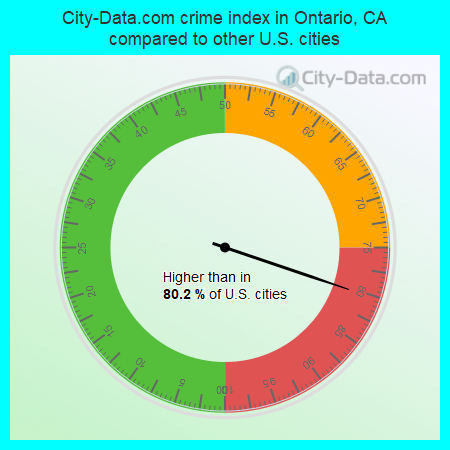
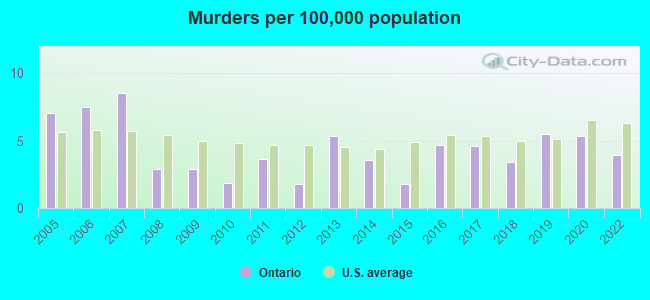
The 2022 crime rate in Ontario, CA is 231 (City-Data.com crime index), which is about the average for the U.S. cities. It was higher than in 80.2% U.S. cities. The 2022 Ontario crime rate fell by 3% compared to 2020. The number of homicides stood at 7 - a decrease of 3 compared to 2020. In the last 5 years Ontario has seen decline of violent crime and decreasing property crime.See how dangerous Ontario, CA is compared to the nearest cities:
(Note: Higher means more crime)
(Note: Higher means more crime)
| Ontario: | 231.3 |
| Montclair: | 398.1 |
| Chino: | 213.0 |
| Upland: | 212.2 |
| Rancho Cucamonga: | 194.1 |
| Claremont: | 215.2 |
| Eastvale: | 121.6 |
| Pomona: | 349.1 |
| Chino Hills: | 122.1 |
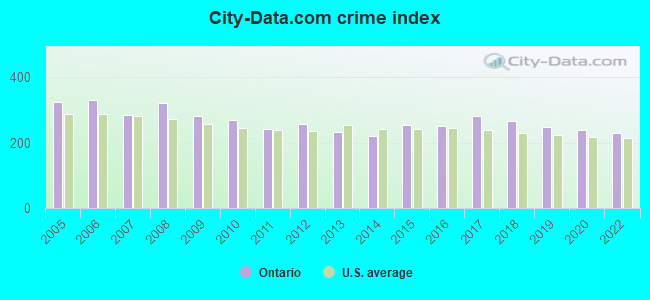
The City-Data.com crime index weighs serious crimes and violent crimes more heavily. Higher means more crime, U.S. average is 246.1. It adjusts for the number of visitors and daily workers commuting into cities.
- means the value is smaller than the state average.- means the value is about the same as the state average.
- means the value is bigger than the state average.
- means the value is much bigger than the state average.
According to our research of California and other state lists, there were 203 registered sex offenders living in Ontario, California as of May 07, 2024.
The ratio of all residents to sex offenders in Ontario is 853 to 1.
The ratio of registered sex offenders to all residents in this city is near the state average.
Violent crime rate in 2022
| Ontario: | 196.4 |
| U.S. Average: | 219.8 |
Violent crime rate in 2020
| Ontario: | 213.1 |
| U.S. Average: | 228.2 |
Violent crime rate in 2019
| Ontario: | 211.1 |
| U.S. Average: | 219.9 |
Violent crime rate in 2018
| Ontario: | 223.6 |
| U.S. Average: | 221.2 |
Violent crime rate in 2017
| Ontario: | 241.2 |
| U.S. Average: | 226.2 |
Violent crime rate in 2016
| Ontario: | 190.6 |
| U.S. Average: | 227.3 |
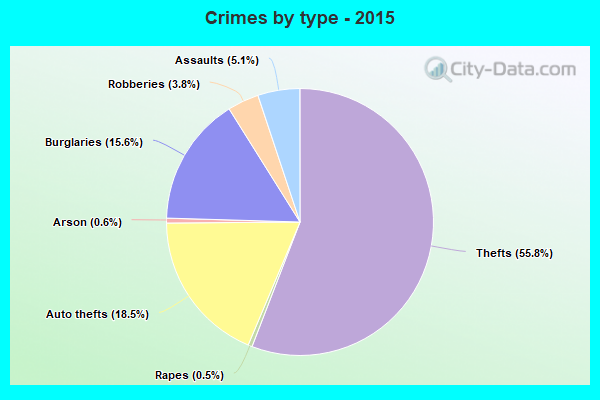
Violent crime rate in 2015
| Ontario: | 172.4 |
| U.S. Average: | 219.3 |
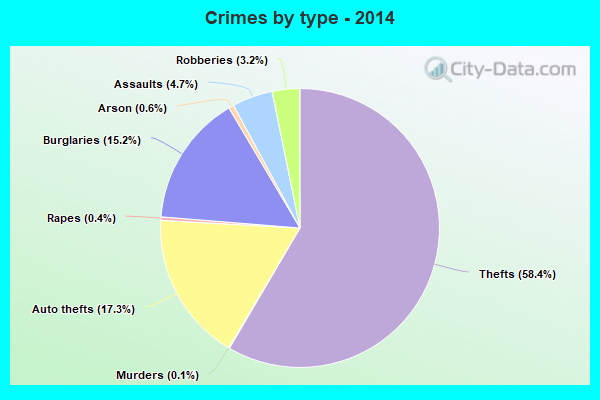
Violent crime rate in 2014
| Ontario: | 139.4 |
| U.S. Average: | 211.1 |
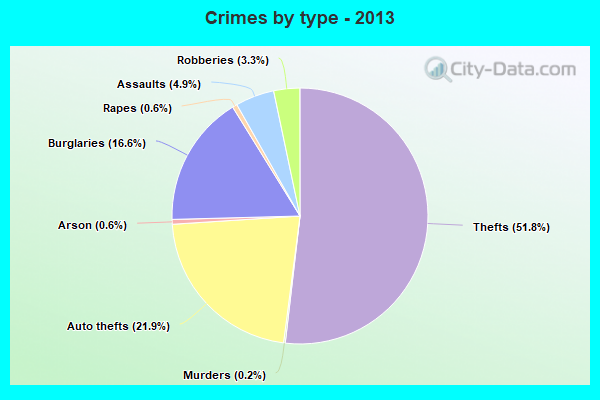
Violent crime rate in 2013
| Ontario: | 152.0 |
| U.S. Average: | 214.2 |
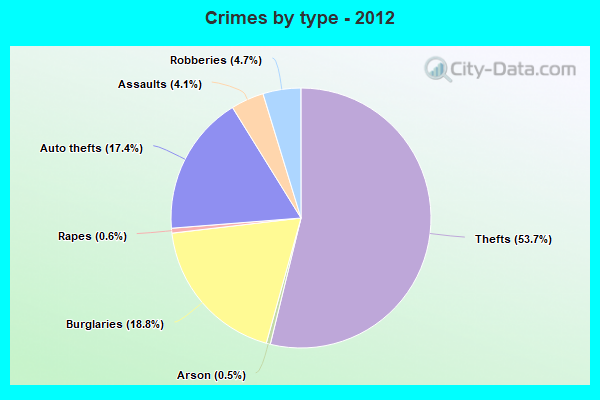
Violent crime rate in 2012
| Ontario: | 172.4 |
| U.S. Average: | 187.4 |
Violent crime rate in 2011
| Ontario: | 162.2 |
| U.S. Average: | 187.1 |
Violent crime rate in 2010
| Ontario: | 209.5 |
| U.S. Average: | 195.7 |
Violent crime rate in 2009
| Ontario: | 229.8 |
| U.S. Average: | 208.9 |
Violent crime rate in 2008
| Ontario: | 278.2 |
| U.S. Average: | 222.5 |
Violent crime rate in 2007
| Ontario: | 233.9 |
| U.S. Average: | 229.1 |
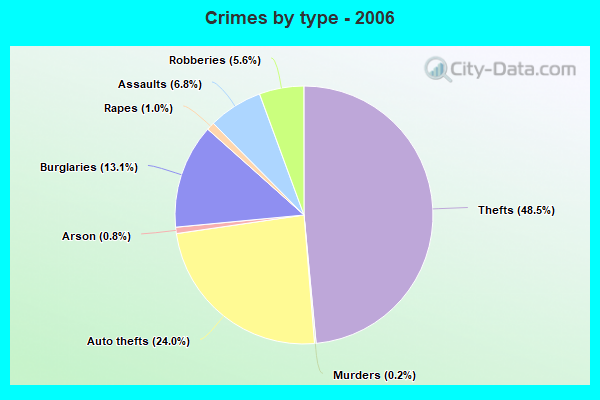
Violent crime rate in 2006
| Ontario: | 280.3 |
| U.S. Average: | 232.6 |
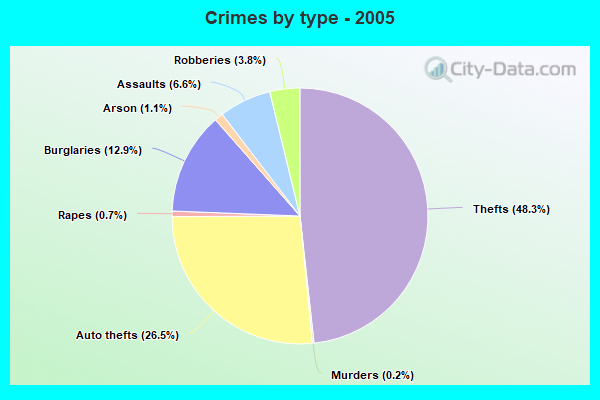
Violent crime rate in 2005
| Ontario: | 243.1 |
| U.S. Average: | 227.0 |
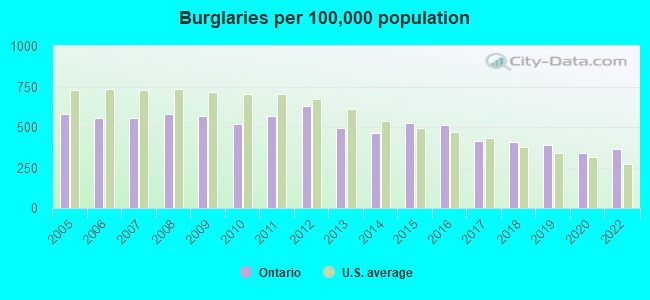
Property crime rate in 2022
| Ontario: | 212.3 |
| U.S. Average: | 166.5 |
Property crime rate in 2020
| Ontario: | 214.2 |
| U.S. Average: | 169.6 |
Property crime rate in 2019
| Ontario: | 225.7 |
| U.S. Average: | 179.7 |
Property crime rate in 2018
| Ontario: | 246.7 |
| U.S. Average: | 190.2 |
Property crime rate in 2017
| Ontario: | 242.0 |
| U.S. Average: | 206.4 |
Property crime rate in 2016
| Ontario: | 275.5 |
| U.S. Average: | 216.6 |
Property crime rate in 2015
| Ontario: | 293.4 |
| U.S. Average: | 221.5 |
Property crime rate in 2014
| Ontario: | 260.5 |
| U.S. Average: | 230.8 |
Property crime rate in 2013
| Ontario: | 273.0 |
| U.S. Average: | 250.4 |
Property crime rate in 2012
| Ontario: | 303.3 |
| U.S. Average: | 267.3 |
Property crime rate in 2011
| Ontario: | 283.4 |
| U.S. Average: | 273.5 |
Property crime rate in 2010
| Ontario: | 282.6 |
| U.S. Average: | 276.4 |
Property crime rate in 2009
| Ontario: | 289.0 |
| U.S. Average: | 285.6 |
Property crime rate in 2008
| Ontario: | 314.1 |
| U.S. Average: | 302.2 |
Property crime rate in 2007
| Ontario: | 282.6 |
| U.S. Average: | 309.2 |
Property crime rate in 2006
| Ontario: | 319.0 |
| U.S. Average: | 317.3 |
Property crime rate in 2005
| Ontario: | 350.1 |
| U.S. Average: | 322.3 |
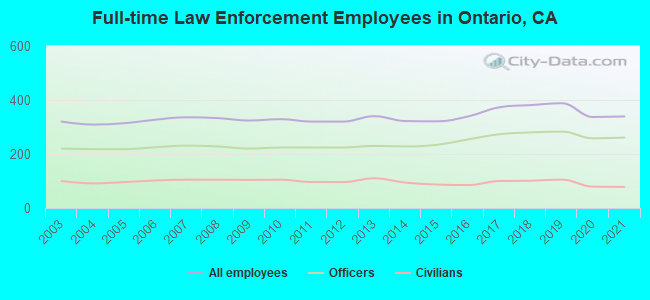
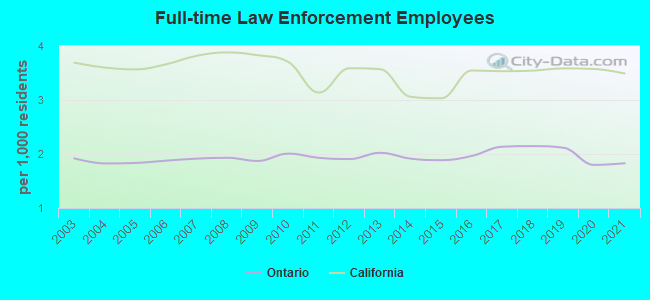
Full-time law enforcement employees in 2021, including police officers: 339 (261 officers - 238 male; 23 female).
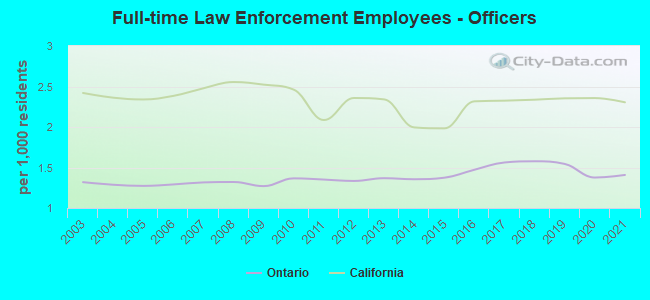
| Officers per 1,000 residents here: | 1.41 |
| California average: | 2.30 |
Full-time law enforcement employees in 2020, including police officers: 337 (258 officers - 235 male; 23 female).
| Officers per 1,000 residents here: | 1.38 |
| California average: | 2.36 |
Full-time law enforcement employees in 2019, including police officers: 388 (283 officers - 260 male; 23 female).
| Officers per 1,000 residents here: | 1.54 |
| California average: | 2.35 |
Full-time law enforcement employees in 2018, including police officers: 381 (280 officers - 260 male; 20 female).
| Officers per 1,000 residents here: | 1.58 |
| California average: | 2.34 |
Full-time law enforcement employees in 2017, including police officers: 373 (273 officers - 256 male; 17 female).
| Officers per 1,000 residents here: | 1.56 |
| California average: | 2.32 |
Full-time law enforcement employees in 2016, including police officers: 339 (254 officers - 242 male; 12 female).
| Officers per 1,000 residents here: | 1.47 |
| California average: | 2.32 |
Full-time law enforcement employees in 2015, including police officers: 321 (234 officers - 224 male; 10 female).
| Officers per 1,000 residents here: | 1.37 |
| California average: | 1.98 |
Full-time law enforcement employees in 2014, including police officers: 322 (228 officers - 219 male; 9 female).
| Officers per 1,000 residents here: | 1.35 |
| California average: | 2.00 |
Full-time law enforcement employees in 2013, including police officers: 340 (230 officers - 221 male; 9 female).
| Officers per 1,000 residents here: | 1.37 |
| California average: | 2.34 |
Full-time law enforcement employees in 2012, including police officers: 320 (224 officers - 214 male; 10 female).
| Officers per 1,000 residents here: | 1.33 |
| California average: | 2.36 |
Full-time law enforcement employees in 2011, including police officers: 320 (224 officers - 214 male; 10 female).
| Officers per 1,000 residents here: | 1.35 |
| California average: | 2.09 |
Full-time law enforcement employees in 2010, including police officers: 329 (224 officers - 214 male; 10 female).
| Officers per 1,000 residents here: | 1.37 |
| California average: | 2.46 |
Full-time law enforcement employees in 2009, including police officers: 324 (220 officers - 210 male; 10 female).
| Officers per 1,000 residents here: | 1.27 |
| California average: | 2.52 |
Full-time law enforcement employees in 2008, including police officers: 333 (228 officers - 217 male; 11 female).
| Officers per 1,000 residents here: | 1.32 |
| California average: | 2.55 |
Full-time law enforcement employees in 2007, including police officers: 336 (231 officers - 221 male; 10 female).
| Officers per 1,000 residents here: | 1.32 |
| California average: | 2.48 |
Full-time law enforcement employees in 2006, including police officers: 327 (225 officers - 215 male; 10 female).
| Officers per 1,000 residents here: | 1.29 |
| California average: | 2.38 |
Full-time law enforcement employees in 2005, including police officers: 314 (218 officers - 207 male; 11 female).
| Officers per 1,000 residents here: | 1.27 |
| California average: | 2.34 |
Full-time law enforcement employees in 2004, including police officers: 309 (218 officers - 206 male; 12 female).
| Officers per 1,000 residents here: | 1.29 |
| California average: | 2.36 |
Full-time law enforcement employees in 2003, including police officers: 320 (220 officers - 205 male; 15 female).
| Officers per 1,000 residents here: | 1.32 |
| California average: | 2.42 |