West Covina: Fire Incidents, California (CA)
Where are fire incidents reported in West Covina, CA
Something went wrong! Please refresh the page.
| Fire incidents reported | |
|---|---|
| Sreet name | Count |
| AZUSA AVE | 154 |
| I10 | 98 |
| GARVEY AVE | 74 |
| SUNSET AVE | 72 |
| E I10 | 68 |
| CAMERON AVE | 60 |
| AMAR RD | 56 |
| GLENDORA AVE | 54 |
| AZUSA | 50 |
| BARRANCA | 50 |
| CITRUS | 40 |
| MERCED AVE | 40 |
| FRANCISQUITO AVE | 38 |
| PLAZA DR | 38 |
| W I10 | 34 |
| WORKMAN AVE | 34 |
| PUENTE AVE | 32 |
| AMAR | 30 |
| SAN BERNARDINO RD | 30 |
| CORTEZ | 28 |
| ORANGE AVE | 24 |
| WOODGATE DR | 24 |
| BADILLO | 22 |
| NOGALES | 22 |
| CALIFORNIA AVE | 20 |
| MICHELLE | 20 |
| VINE AVE | 20 |
| AROMA DR | 18 |
| CAMERON | 18 |
| EASTLAND CENTER DR | 18 |
| Other | 123 |
2005 - 2018 National Fire Incident Reporting System (NFIRS) incidents
- Incident types reported to NFIRS in West Covina, CA
- 11,82863.7%Rescue & EMS
- 2,16411.7%Good Intent Call
- 1,4097.6%Fire
- 1,2376.7%Service Call
- 1,2076.5%Hazardous Condition
- 6823.7%False Alarm
- 230.1%Severe Weather
- Fire incident types reported to NFIRS in West Covina, CA
- 50836.1%Structure Fires
- 49134.8%Outside Fires
- 38527.3%Mobile Property/Vehicle Fires
- 251.8%Other
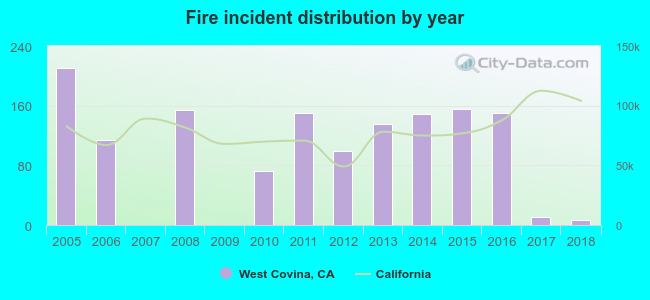 Based on the data from the years 2005 - 2018 the average number of fires per year is 101. The highest number of fires - 211 took place in 2005, and the least - 0 in 2007. The data has a dropping trend.
The average number of yearly fire incidents per 10k residents in West Covina, CA compared to nearest cities:
(Note: Based on data for the last 3 years, including only cities with population 5,000 and above)
| West Covina: | 5.2 |
| Valinda: | 10.2 |
| La Puente: | 8.3 |
| Covina: | 12.7 |
| Baldwin Park: | 8.9 |
| Walnut: | 8.6 |
| Charter Oak: | 6.4 |
| Hacienda Heights: | 11.5 |
| Azusa: | 13.9 |
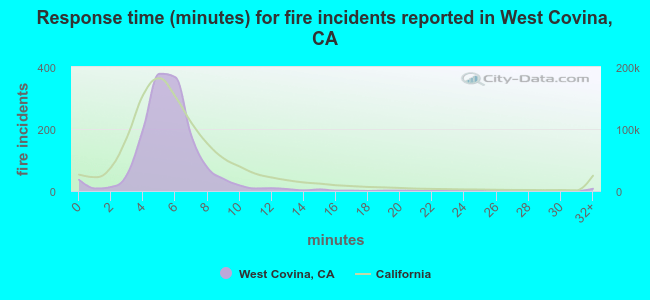 The median response time based on all reported fire incidents is 6 minutes. This is similar to the California median value.
The median response time in West Covina, CA compared to nearest cities:
(Note: Based on data for all years, including only cities with at least 500 fire incidents)
| West Covina: | 6 minutes |
| Covina: | 4 minutes |
| Industry: | 6 minutes |
| Baldwin Park: | 5 minutes |
| Hacienda Heights: | 6 minutes |
| Azusa: | 5 minutes |
| Glendora: | 5 minutes |
| El Monte: | 4 minutes |
| San Dimas: | 5 minutes |
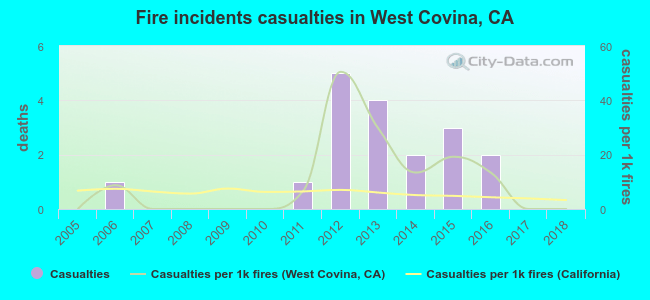 Based on the reports from the years 2005 - 2018 the average number of fire-related casualties per year is 1. The highest number of reported injuries - 5 took place in 2012, and the lowest - 0 in 2005. The data has a constant trend.
The average number of injuries per 1,000 fires is 10. This indicator was the highest - 51 in 2012, and the lowest 0 in 2005. The trend for casualties per 1,000 incidents is growing. Compared to the California value the number of casualties per 1,000 incidents is much higher.
Based on the reports from the years 2005 - 2018 the average number of fire-related casualties per year is 1. The highest number of reported injuries - 5 took place in 2012, and the lowest - 0 in 2005. The data has a constant trend.
The average number of injuries per 1,000 fires is 10. This indicator was the highest - 51 in 2012, and the lowest 0 in 2005. The trend for casualties per 1,000 incidents is growing. Compared to the California value the number of casualties per 1,000 incidents is much higher.Casualties per 1,000 incidents in West Covina, CA compared to nearest cities:
(Note: Based on data for all years, including only cities with at least 500 fire incidents)
| West Covina: | 12.8 |
| Covina: | 0.0 |
| Industry: | 1.5 |
| Baldwin Park: | 1.2 |
| Hacienda Heights: | 0.0 |
| Azusa: | 0.0 |
| Glendora: | 0.0 |
| El Monte: | 0.0 |
| San Dimas: | 0.0 |
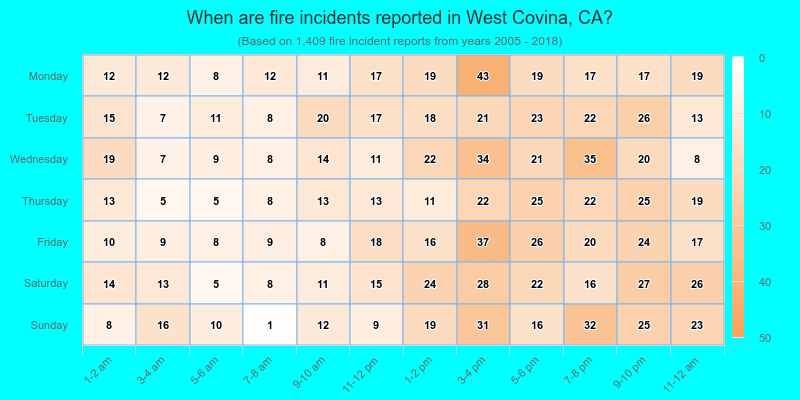
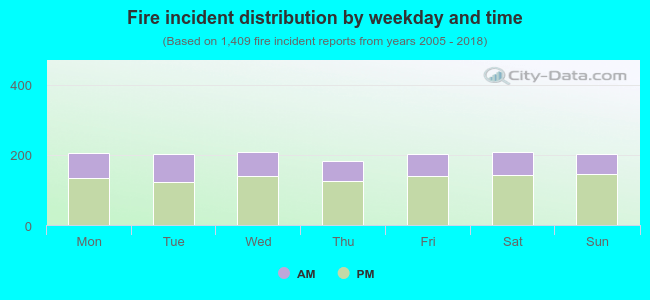 32.6% incidents where reported in the morning and 67.4% in the evening. The most fires (14.8%) took place on Saturday, and the least (12.8%) on Thursday.
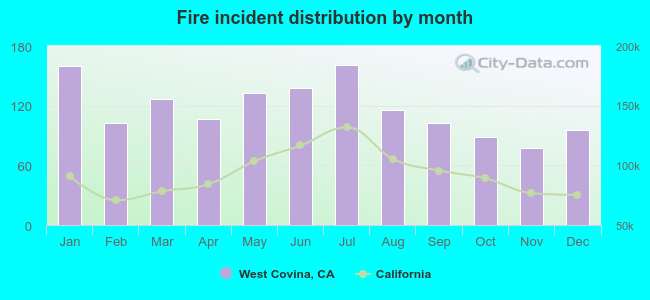 Based on the 1,409 fire incidents from years 2005 - 2018 most fires (11.4%) took place during July, and the least (5.5%) in November.
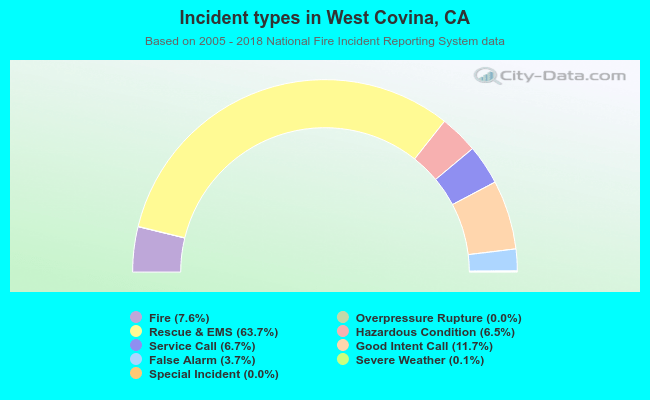 Out of all 18,558 cases reported during the years 2005 - 2018, the most belonged to the categories: Rescue & EMS (63.7%), Good Intent Call (11.7%), and Fire (7.6%).
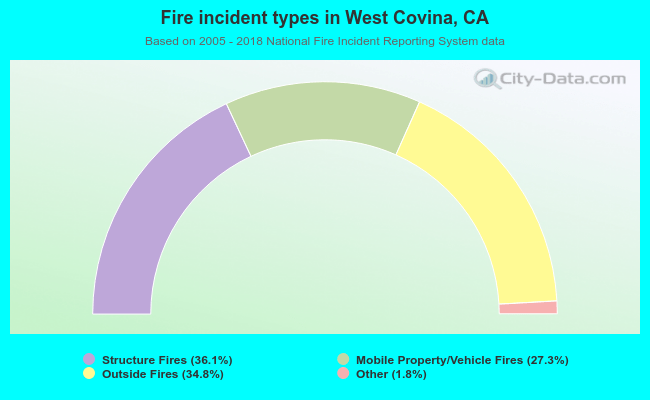 When looking into fire subcategories, the most reports belonged to: Structure Fires (36.1%), and Outside Fires (34.8%).