Valinda: Fire Incidents, California (CA)
Where are fire incidents reported in Valinda, CA
Something went wrong! Please refresh the page.
|
| |||||||||||||||||||||||||||||||||||||||||||||||||||||||||||||||||||||||||||||||||||||||||||||||||||||||||||||
2005 - 2018 National Fire Incident Reporting System (NFIRS) incidents
- Incident types reported to NFIRS in Valinda, CA
- 3,85575.8%Rescue & EMS
- 56811.2%Good Intent Call
- 2234.4%Fire
- 1833.6%False Alarm
- 1382.7%Hazardous Condition
- 1132.2%Service Call
- Fire incident types reported to NFIRS in Valinda, CA
- 9743.5%Outside Fires
- 7031.4%Structure Fires
- 3917.5%Mobile Property/Vehicle Fires
- 177.6%Other
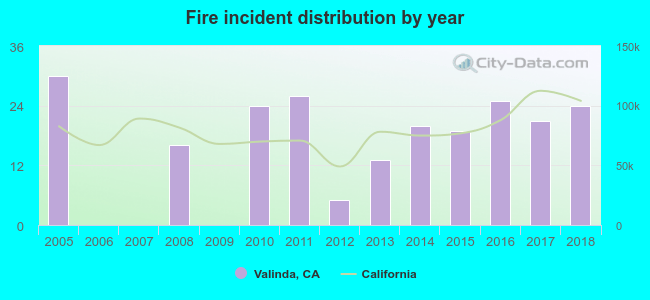 Based on the data from the years 2005 - 2018 the average number of fires per year is 16. The highest number of reported fires - 30 took place in 2005, and the least - 0 in 2006. The data has a dropping trend.
The average number of yearly fire incidents per 10k residents in Valinda, CA compared to nearest cities:
(Note: Based on data for the last 3 years, including only cities with population 5,000 and above)
| Valinda: | 10.2 |
| West Covina: | 5.2 |
| La Puente: | 8.3 |
| Hacienda Heights: | 11.5 |
| Baldwin Park: | 8.9 |
| Walnut: | 8.6 |
| Rowland Heights: | 6.5 |
| Covina: | 12.7 |
| La Habra Heights: | 18.9 |
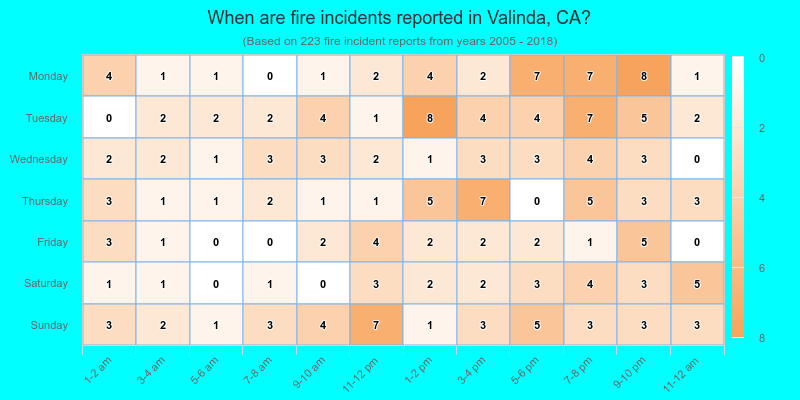
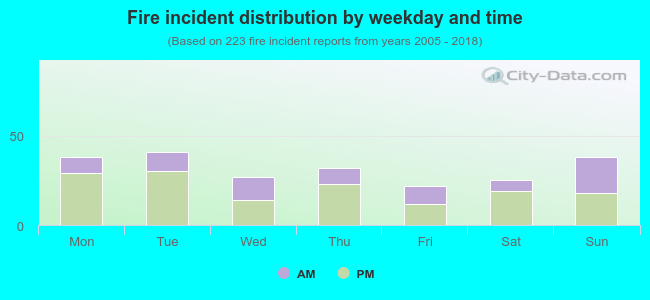 35.0% incidents where reported in the morning and 65.0% in the evening. The most fires (18.4%) took place on Tuesday, and the least (9.9%) on Friday.
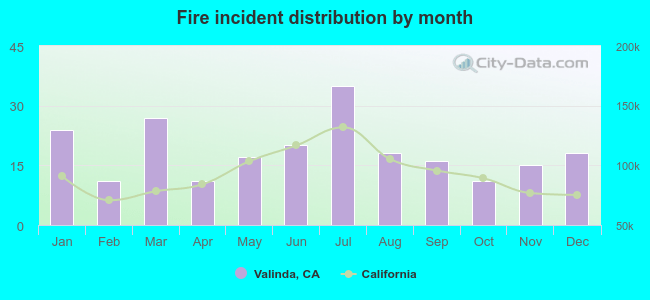 Based on the 223 fire incident reports from years 2005 - 2018 most fires (15.7%) took place during July, and the least (4.9%) in February.
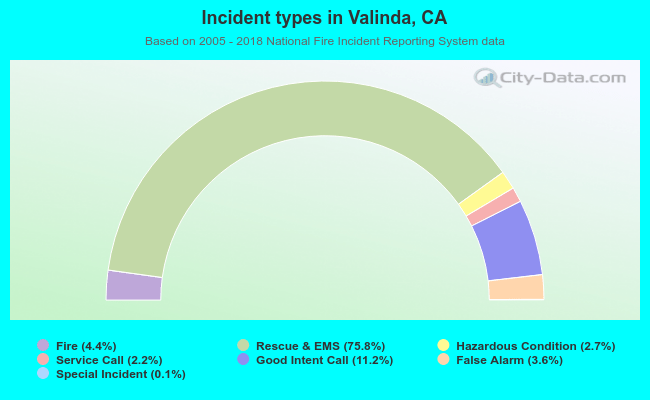 Out of all 5,084 cases reported during the years 2005 - 2018, the most belonged to the categories: Overpressure Rupture (75.8%), Service Call (11.2%), and Fire (4.4%).
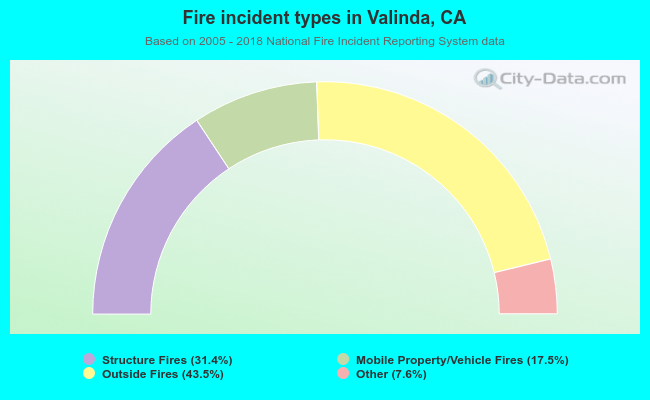 When looking into fire subcategories, the most incidents belonged to: Outside Fires (43.5%), and Structure Fires (31.4%).