Moorpark: Fire Incidents, California (CA)
Where are fire incidents reported in Moorpark, CA
Something went wrong! Please refresh the page.
|
| |||||||||||||||||||||||||||||||||||||||||||||||||||||||||||||||||||||||||||||||||||||||||||||||||||||||||||||
2005 - 2018 National Fire Incident Reporting System (NFIRS) incidents
- Incident types reported to NFIRS in Moorpark, CA
- 4,58159.3%Rescue & EMS
- 92211.9%Good Intent Call
- 78010.1%Service Call
- 6848.9%Fire
- 3674.8%Hazardous Condition
- 3664.7%False Alarm
- 90.1%Overpressure Rupture
- 90.1%Severe Weather
- Fire incident types reported to NFIRS in Moorpark, CA
- 27039.5%Outside Fires
- 14821.6%Mobile Property/Vehicle Fires
- 14020.5%Structure Fires
- 12618.4%Other
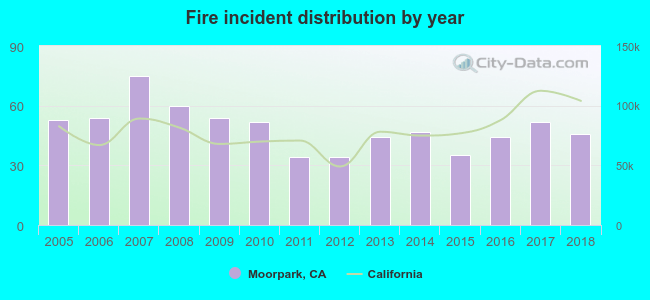 Based on the data from the years 2005 - 2018 the average number of fires per year is 49. The highest number of fire incidents - 75 took place in 2007, and the least - 34 in 2011. The data has a decreasing trend.
The average number of yearly fire incidents per 10k residents in Moorpark, CA compared to nearest cities:
(Note: Based on data for the last 3 years, including only cities with population 5,000 and above)
| Moorpark: | 13.3 |
| Thousand Oaks: | 9.7 |
| Simi Valley: | 13.7 |
| Fillmore: | 25.1 |
| Camarillo: | 17.4 |
| Oak Park: | 6.8 |
| Westlake Village: | 9.0 |
| Agoura Hills: | 13.3 |
| Santa Paula: | 24.2 |
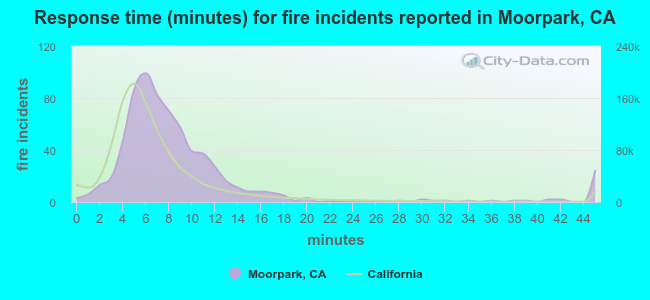 The median response time based on all reported fire incidents is 7 minutes. This is similar to the state median value.
The median response time in Moorpark, CA compared to nearest cities:
(Note: Based on data for all years, including only cities with at least 500 fire incidents)
| Moorpark: | 7 minutes |
| Thousand Oaks: | 6 minutes |
| Simi Valley: | 6 minutes |
| Camarillo: | 6 minutes |
| Santa Paula: | 6 minutes |
| Malibu: | 6 minutes |
| Oxnard: | 5 minutes |
| Port Hueneme: | 6 minutes |
| Ventura: | 7 minutes |
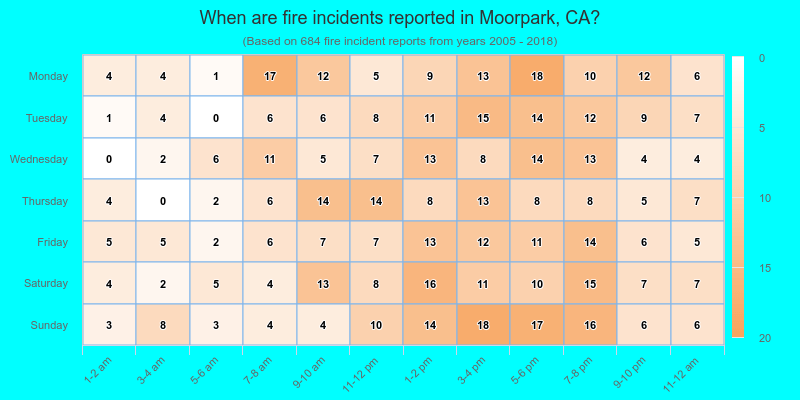
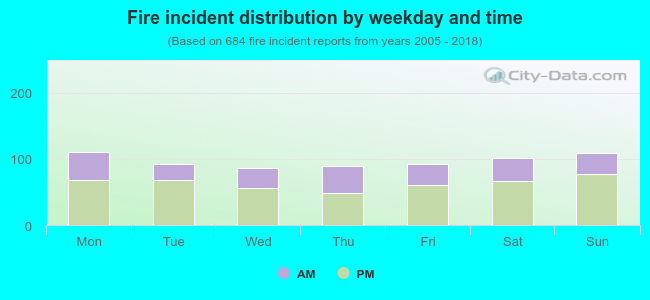 34.9% incidents where reported in the morning and 65.1% in the evening. The most fires (16.2%) took place on Monday, and the least (12.7%) on Wednesday.
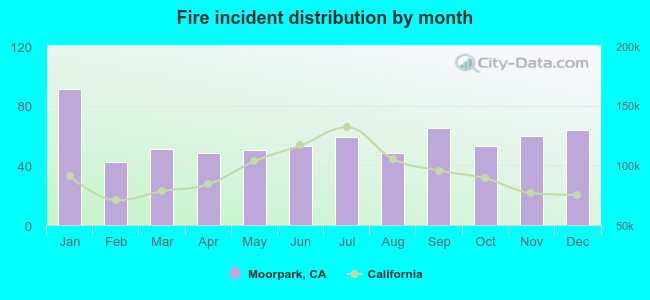 According to the 684 incident reports from years 2005 - 2018 most fires (13.3%) took place during January, and the least (6.1%) in February.
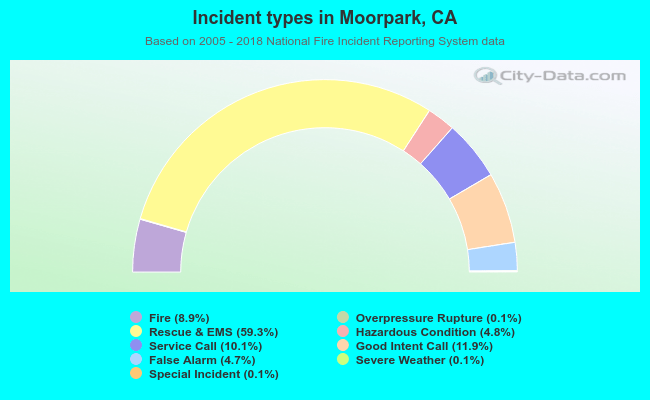 Out of all 7,723 cases reported during the years 2005 - 2018, the most belonged to the categories: Rescue & EMS (59.3%), Good Intent Call (11.9%), and Service Call (10.1%).
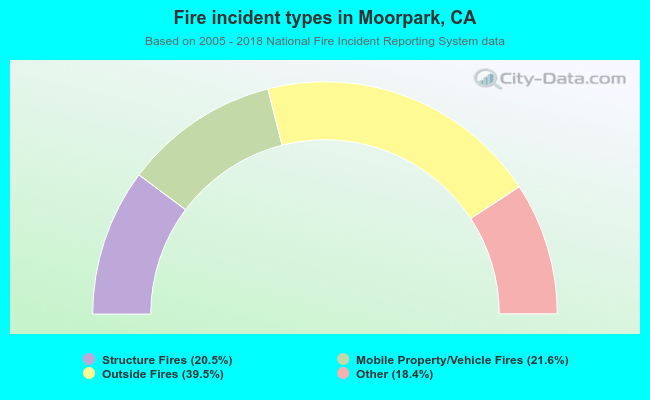 When looking into fire subcategories, the most reports belonged to: Outside Fires (39.5%), and Mobile Property/Vehicle Fires (21.6%).