Fillmore: Fire Incidents, California (CA)
Where are fire incidents reported in Fillmore, CA
Something went wrong! Please refresh the page.
|
| |||||||||||||||||||||||||||||||||||||||||||||||||||||||||||||||||||||||||||||||||||||||||||||||||||||||||||||
2005 - 2018 National Fire Incident Reporting System (NFIRS) incidents
- Incident types reported to NFIRS in Fillmore, CA
- 3,54864.0%Rescue & EMS
- 59710.8%Service Call
- 4838.7%Good Intent Call
- 4828.7%Fire
- 2454.4%Hazardous Condition
- 1813.3%False Alarm
- Fire incident types reported to NFIRS in Fillmore, CA
- 18738.8%Outside Fires
- 18237.8%Structure Fires
- 5912.2%Mobile Property/Vehicle Fires
- 5411.2%Other
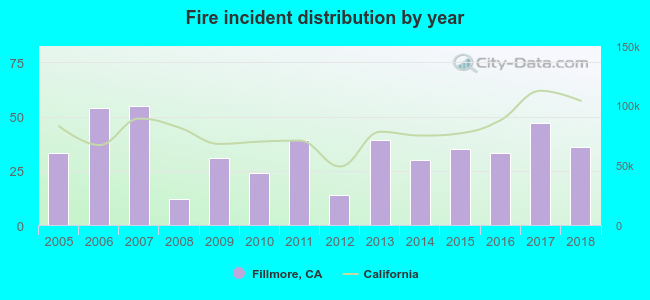 According to the data from the years 2005 - 2018 the average number of fire incidents per year is 34. The highest number of reported fire incidents - 55 took place in 2007, and the least - 12 in 2008. The data has an increasing trend.
The average number of yearly fire incidents per 10k residents in Fillmore, CA compared to nearest cities:
(Note: Based on data for the last 3 years, including only cities with population 5,000 and above)
| Fillmore: | 25.1 |
| Moorpark: | 13.3 |
| Santa Paula: | 24.2 |
| Simi Valley: | 13.7 |
| Camarillo: | 17.4 |
| Thousand Oaks: | 9.7 |
| El Rio: | 43.5 |
| Castaic: | 21.7 |
| Oak Park: | 6.8 |
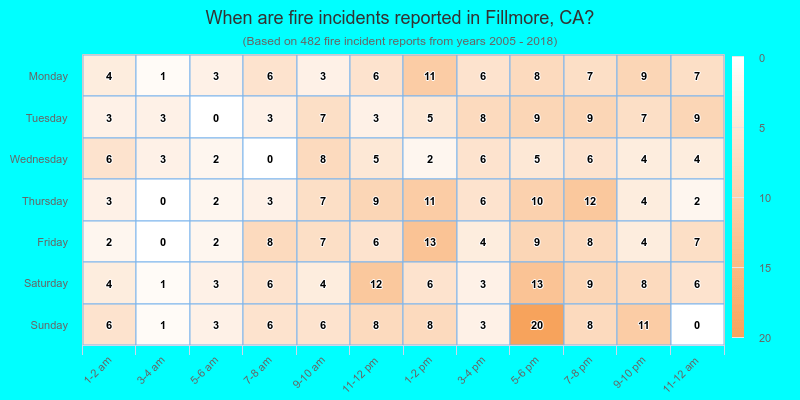
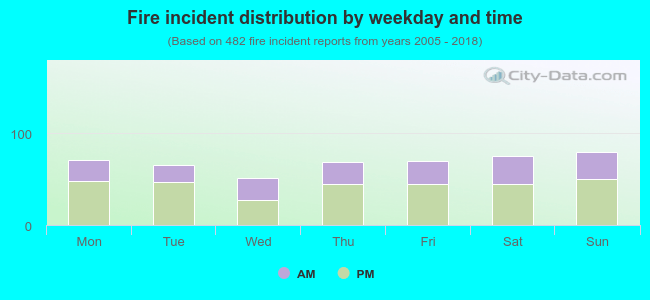 36.3% incidents where reported in the morning and 63.7% in the evening. The most fires (16.6%) took place on Sunday, and the least (10.6%) on Wednesday.
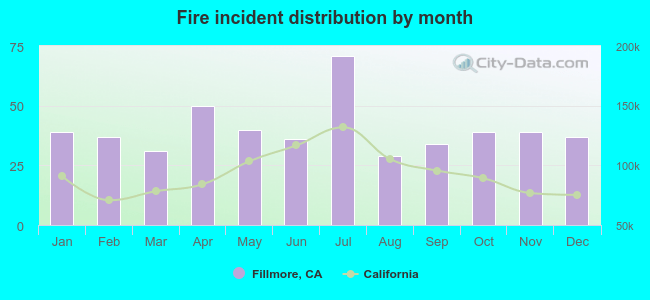 Based on the 482 incident reports from years 2005 - 2018 most fires (14.7%) took place during July, and the least (6.0%) in August.
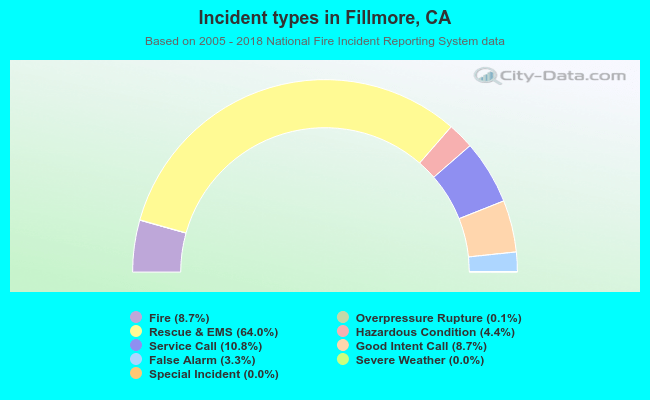 Out of all 5,541 cases reported during the years 2005 - 2018, the most belonged to the categories: Rescue & EMS (64.0%), Service Call (10.8%), and Good Intent Call (8.7%).
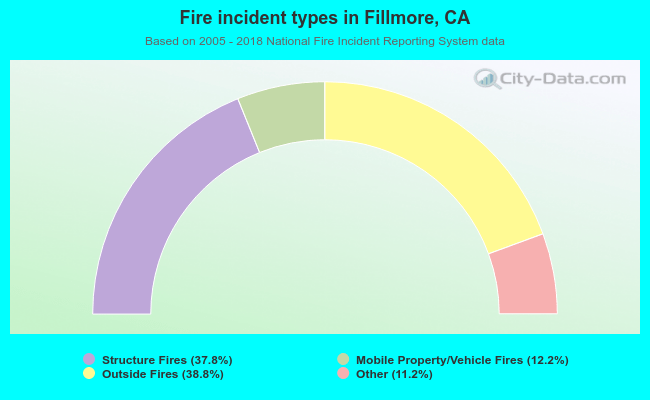 When looking into fire subcategories, the most incidents belonged to: Outside Fires (38.8%), and Structure Fires (37.8%).