Stevenson Ranch: Fire Incidents, California (CA)
Where are fire incidents reported in Stevenson Ranch, CA
Something went wrong! Please refresh the page.
|
| |||||||||||||||||||||||||||||||||||||||||||||||||||||||||||||||||||||||||||||||||||||||||||||||||||||||||||||
2005 - 2018 National Fire Incident Reporting System (NFIRS) incidents
- Incident types reported to NFIRS in Stevenson Ranch, CA
- 2,09059.4%Rescue & EMS
- 65218.5%Good Intent Call
- 38611.0%False Alarm
- 2246.4%Service Call
- 1053.0%Fire
- 571.6%Hazardous Condition
- 60.2%Special Incident
- Fire incident types reported to NFIRS in Stevenson Ranch, CA
- 5552.4%Structure Fires
- 2624.8%Outside Fires
- 2019.0%Mobile Property/Vehicle Fires
- 43.8%Other
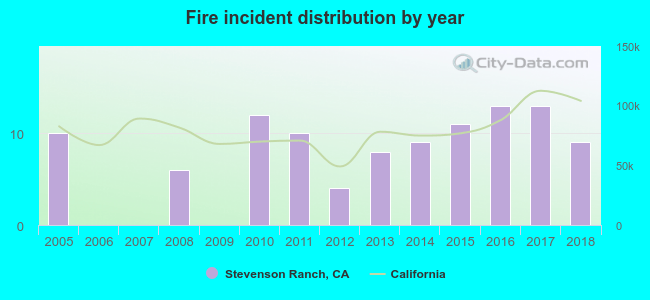 According to the data from the years 2005 - 2018 the average number of fires per year is 8. The highest number of fires - 13 took place in 2016, and the least - 0 in 2006. The data has a dropping trend.
The average number of yearly fire incidents per 10k residents in Stevenson Ranch, CA compared to nearest cities:
(Note: Based on data for the last 3 years, including only cities with population 5,000 and above)
| Stevenson Ranch: | 6.6 |
| Newhall: | 0.1 |
| Santa Clarita: | 12.9 |
| Castaic: | 21.7 |
| San Fernando: | 4.9 |
| Simi Valley: | 13.7 |
| Calabasas: | 15.5 |
| Oak Park: | 6.8 |
| Moorpark: | 13.3 |
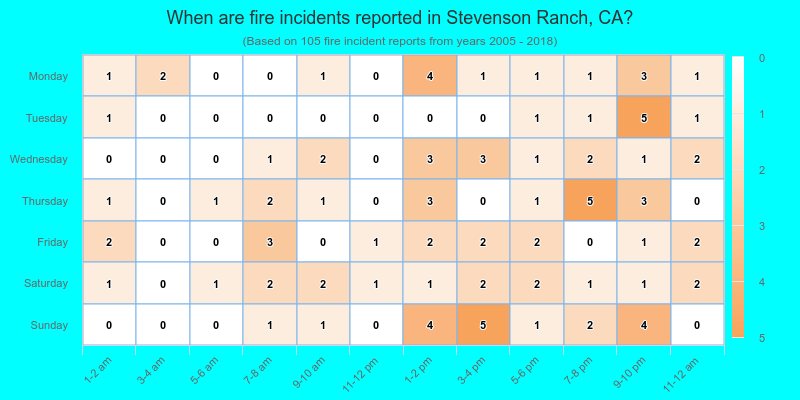
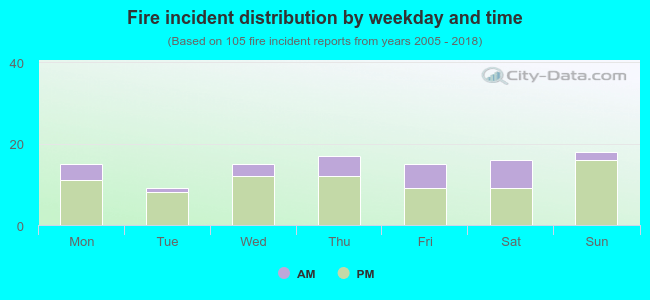 26.7% incidents where reported in the morning and 73.3% in the evening. The most fires (17.1%) took place on Sunday, and the least (8.6%) on Tuesday.
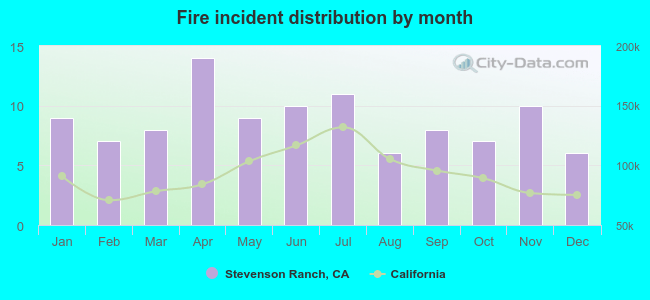 According to the 105 fire incidents from years 2005 - 2018 most fires (13.3%) took place during April, and the least (5.7%) in August.
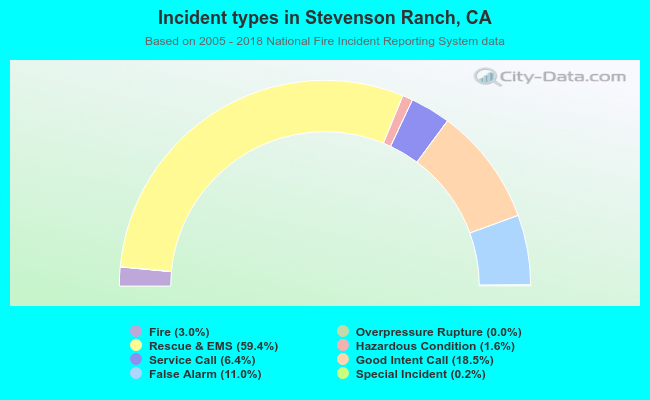 Out of all 3,521 cases reported during the years 2005 - 2018, the most belonged to the categories: Rescue & EMS (59.4%), Good Intent Call (18.5%), and False Alarm (11.0%).
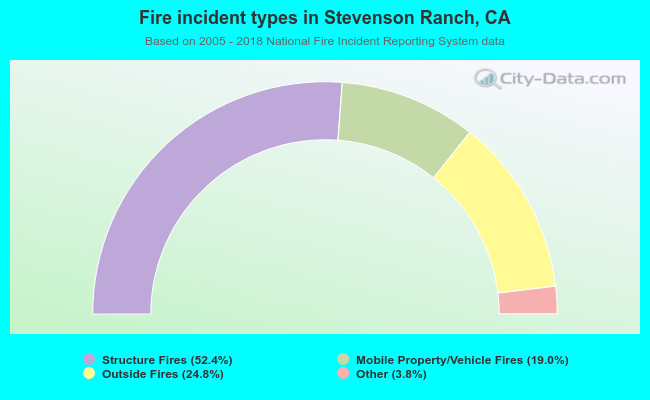 When looking into fire subcategories, the most incidents belonged to: Structure Fires (52.4%), and Outside Fires (24.8%).